Mhlontlo Local Municipality
Mhlontlo | |
|---|---|
 Seal | |
 Location in the Eastern Cape | |
| Country | South Africa |
| Province | Eastern Cape |
| District | OR Tambo |
| Seat | Qumbu |
| Wards | 26 |
| Government | |
| • Type | Municipal council |
| • Mayor | Nompumelelo Dywili (ANC) |
| • Speaker | Mbulelo Jara (ANC) |
| • Chief Whip | Nozolile Margaret Mvanyashe (ANC) |
| Area | |
| • Total | 2,826 km2 (1,091 sq mi) |
| Population (2011)[2] | |
| • Total | 188,226 |
| • Density | 67/km2 (170/sq mi) |
| Racial makeup (2011) | |
| • Black African | 99.4% |
| • Coloured | 0.2% |
| • Indian/Asian | 0.1% |
| • White | 0.2% |
| First languages (2011) | |
| • Xhosa | 94.9% |
| • English | 2.3% |
| • Other | 2.8% |
| Time zone | UTC+2 (SAST) |
| Municipal code | EC156 |
Mhlontlo Local Municipality is an administrative area in the OR Tambo District of Eastern Cape in South Africa.
was a chief of the people during the 19th century.[4]
Main places[]
The 2001 census divided the municipality into the following main places:[5]
| Place | Code | Area (km2) | Population |
|---|---|---|---|
| 23501 | 177.82 | 20,419 | |
| 23502 | 109.24 | 12,566 | |
| 23503 | 0.35 | 0 | |
| 23504 | 8.02 | 475 | |
| 23505 | 7.95 | 0 | |
| Bhele | 23506 | 70.31 | 4,240 |
| 23507 | 197.19 | 18,717 | |
| 23508 | 99.50 | 9,501 | |
| 23509 | 203.35 | 22,254 | |
| 23510 | 162.71 | 10,214 | |
| 23511 | 67.98 | 2,907 | |
| 23512 | 280.77 | 22,631 | |
| 23513 | 6.87 | 369 | |
| 23514 | 70.06 | 7,600 | |
| 23515 | 48.43 | 1,625 | |
| 23516 | 24.83 | 629 | |
| Masizakhe | 23517 | 293.67 | 18,661 |
| 23518 | 32.91 | 52 | |
| 23519 | 125.22 | 10,021 | |
| 23520 | 19.82 | 6 | |
| 23521 | 106.95 | 5,855 | |
| 23522 | 16.95 | 633 | |
| 23523 | 294.50 | 15,987 | |
| Qumbu | 23524 | 38.15 | 3,275 |
| Tsolo Part 1 | 23525 | 53.97 | 5,678 |
| Tsolo Part 2 | 23526 | 184.59 | 2,361 |
Politics[]
The municipal council consists of fifty-one members elected by mixed-member proportional representation. Twenty-six councillors are elected by first-past-the-post voting in twenty-six wards, while the remaining twenty-five are chosen from party lists so that the total number of party representatives is proportional to the number of votes received. In the election of 3 August 2016 the African National Congress (ANC) won a majority of forty seats on the council. The following table shows the results of the election.[6][7]
| Party | Votes | Seats | ||||||
|---|---|---|---|---|---|---|---|---|
| Ward | List | Total | % | Ward | List | Total | ||
| ANC | 38,067 | 39,974 | 78,041 | 78.1 | 24 | 16 | 40 | |
| UDM | 2,821 | 3,155 | 5,976 | 6.0 | 0 | 3 | 3 | |
| 1,449 | 3,615 | 5,064 | 5.1 | 0 | 2 | 2 | ||
| Independent | 3,823 | – | 3,823 | 3.8 | 2 | – | 2 | |
| Democratic Alliance | 1,644 | 1,622 | 3,266 | 3.3 | 0 | 2 | 2 | |
| EFF | 1,624 | 1,572 | 3,196 | 3.2 | 0 | 2 | 2 | |
| COPE | 255 | 313 | 568 | 0.6 | 0 | 0 | 0 | |
| Total | 49,683 | 50,251 | 99,934 | 100.0 | 26 | 25 | 51 | |
| Spoilt votes | 1,158 | 1,245 | 2,403 | |||||
References[]
- ^ "Contact list: Executive Mayors". Government Communication & Information System. Archived from the original on 14 July 2010. Retrieved 22 February 2012.
- ^ a b "Statistics by place". Statistics South Africa. Retrieved 27 September 2015.
- ^ "Statistics by place". Statistics South Africa. Retrieved 27 September 2015.
- ^ South African Languages - Place names
- ^ Lookup Tables - Statistics South Africa[permanent dead link]
- ^ "Results Summary – All Ballots: Mhlontlo" (PDF). Independent Electoral Commission. Retrieved 21 December 2016.
- ^ "Seat Calculation Detail: Mhlontlo" (PDF). Independent Electoral Commission. Retrieved 21 December 2016.
External links[]
Municipalities of the Eastern Cape | |||||||||||||
|---|---|---|---|---|---|---|---|---|---|---|---|---|---|
| Metropolitan | 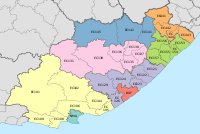 | ||||||||||||
| District and local |
| ||||||||||||

- Local municipalities of the OR Tambo District Municipality