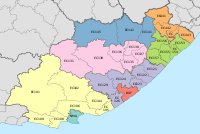
Mnquma Local Municipality
Mnquma | |
|---|---|
 Seal | |
 Location in the Eastern Cape | |
| Country | South Africa |
| Province | Eastern Cape |
| District | Amathole |
| Seat | Butterworth |
| Wards | 31 |
| Government | |
| • Type | Municipal council |
| • Mayor | Sithembiso Ncetezo (ANC) |
| • Speaker | Thobeka Bikitsha (ANC) |
| • Chief Whip | Nomfundiso Tshona (ANC) |
| Area | |
| • Total | 3,270 km2 (1,260 sq mi) |
| Population (2011)[2] | |
| • Total | 252,390 |
| • Density | 77/km2 (200/sq mi) |
| Racial makeup (2011) | |
| • Black African | 99.4% |
| • Coloured | 0.2% |
| • Indian/Asian | 0.1% |
| • White | 0.2% |
| First languages (2011) | |
| • Xhosa | 96.1% |
| • English | 1.4% |
| • Other | 2.5% |
| Time zone | UTC+2 (SAST) |
| Municipal code | EC122 |
Mnquma Local Municipality is an administrative area in the Amatole District of the Eastern Cape in South Africa.
Main places[]
The 2001 census divided the municipality into the following main places:[4]
| Place | Code | Area (km2) | Population |
|---|---|---|---|
| 21101 | 526.95 | 32,672 | |
| 21102 | 631.51 | 42,651 | |
| 21103 | 21.21 | 1,562 | |
| 21104 | 623.87 | 54,406 | |
| Butterworth | 21105 | 26.88 | 45,900 |
| 21106 | 105.70 | 6,481 | |
| Gcaleka | 21107 | 61.93 | 5,898 |
| 21108 | 39.39 | 2,302 | |
| 21109 | 64.07 | 4,239 | |
| 21110 | 90.71 | 7,795 | |
| Centane Part 1 | 21111 | 4.44 | 784 |
| Centane Part 2 | 21131 | 2.99 | 528 |
| 21112 | 9.66 | 630 | |
| 21113 | 55.14 | 2,602 | |
| 21114 | 134.74 | 6,410 | |
| Mazeppa Bay | 21115 | 0.57 | 42 |
| 21116 | 43.39 | 2,040 | |
| 21117 | 56.03 | 727 | |
| 21118 | 52.88 | 4,260 | |
| 21119 | 193.31 | 14,912 | |
| 21120 | 17.93 | 1,793 | |
| 21121 | 114.11 | 7,347 | |
| 21122 | 3.71 | 231 | |
| Nqamakwe | 21123 | 16.09 | 1,405 |
| 21124 | 0.72 | 0 | |
| Qolora Mouth | 21126 | 0.34 | 69 |
| 21125 | 201.39 | 20,265 | |
| 21127 | 0.80 | 116 | |
| 21128 | 61.74 | 5,686 | |
| 21129 | 47.50 | 5,664 | |
| 21130 | 113.68 | 8,359 |
Politics[]
The municipal council consists of sixty-two members elected by mixed-member proportional representation. Thirty-one councillors are elected by first-past-the-post voting in thirty-one wards, while the remaining thirty-one are chosen from party lists so that the total number of party representatives is proportional to the number of votes received. In the election of 3 August 2016 the African National Congress (ANC) won a majority of forty-eight seats on the council. The following table shows the results of the election.[5][6]
| Party | Votes | Seats | ||||||
|---|---|---|---|---|---|---|---|---|
| Ward | List | Total | % | Ward | List | Total | ||
| ANC | 48,249 | 46,693 | 94,942 | 75.3 | 31 | 17 | 48 | |
| UDM | 4,492 | 4,738 | 9,230 | 7.3 | 0 | 5 | 5 | |
| Democratic Alliance | 2,993 | 2,931 | 5,924 | 4.7 | 0 | 3 | 3 | |
| EFF | 2,713 | 3,183 | 5,896 | 4.7 | 0 | 3 | 3 | |
| African Independent Congress | 78 | 2,699 | 2,777 | 2.2 | 0 | 1 | 1 | |
| COPE | 1,280 | 1,429 | 2,709 | 2.1 | 0 | 1 | 1 | |
| Independent | 1,971 | – | 1,971 | 1.6 | 0 | – | 0 | |
| PAC | 776 | 615 | 1,391 | 1.1 | 0 | 1 | 1 | |
| United Congress | 275 | 425 | 700 | 0.6 | 0 | 0 | 0 | |
| ACDP | 200 | 198 | 398 | 0.3 | 0 | 0 | 0 | |
| Kingdom Governance Movement | 8 | 60 | 68 | 0.1 | 0 | 0 | 0 | |
| Total | 63,035 | 62,971 | 126,006 | 100.0 | 31 | 31 | 62 | |
| Spoilt votes | 1,444 | 1,626 | 3,070 | |||||
References[]
- ^ "Contact list: Executive Mayors". Government Communication & Information System. Archived from the original on 14 July 2010. Retrieved 22 February 2012.
- ^ a b "Statistics by place". Statistics South Africa. Retrieved 27 September 2015.
- ^ "Statistics by place". Statistics South Africa. Retrieved 27 September 2015.
- ^ Lookup Tables - Statistics South Africa
- ^ "Results Summary – All Ballots: Mnquma" (PDF). Independent Electoral Commission. Retrieved 8 December 2016.
- ^ "Seat Calculation Detail: Mnquma" (PDF). Independent Electoral Commission. Retrieved 8 December 2016.
External links[]
Categories:
- Local municipalities of the Amatole District Municipality

