North Warwickshire (UK Parliament constituency)
| North Warwickshire | |
|---|---|
| County constituency for the House of Commons | |
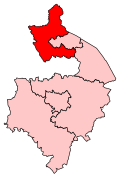 Boundary of North Warwickshire in Warwickshire | |
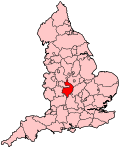 Location of Warwickshire within England | |
| County | Warwickshire |
| Electorate | 70,544 (December 2010)[1] |
| Major settlements | Atherstone, Bedworth, Coleshill and Polesworth |
| Current constituency | |
| Created | 1983 |
| Member of Parliament | Craig Tracey (Conservative) |
| Number of members | One |
| Created from | Meriden Nuneaton |
| 1832–1885 | |
| Number of members | Two |
| Type of constituency | County constituency |
| Replaced by | Nuneaton Rugby Tamworth |
| Created from | Warwickshire |
North Warwickshire is a constituency[n 1] represented in the House of Commons of the UK Parliament since 2015 by Craig Tracey, a Conservative.[n 2]
Members of Parliament[]
MPs 1832–1885[]
| Election | 1st Member[2] | 1st Party | 2nd Member[2] | 2nd Party | ||
|---|---|---|---|---|---|---|
| 1832 | William Stratford Dugdale | Tory[3] | Sir John Eardley-Wilmot, Bt | Tory[3] | ||
| 1834 | Conservative[3] | Conservative[3] | ||||
| Charles Newdegate | Conservative[3] | |||||
| 1847 | Richard Spooner | Conservative | ||||
| William Bromley-Davenport | Conservative | |||||
| Philip Muntz | Conservative | |||||
| 1885 | Constituency abolished: see Nuneaton, Rugby, Stratford-on-Avon and Tamworth | |||||
MPs since 1983[]
| Election | Member[2] | Party | |
|---|---|---|---|
| 1983 | Francis Maude | Conservative | |
| 1992 | Mike O'Brien | Labour | |
| 2010 | Dan Byles | Conservative | |
| 2015 | Craig Tracey | Conservative | |
Constituency profile[]
Warwickshire North has wards which are the most "working-class" (lowest average income) and industrial of the six constituencies in the county, politically frequently with the best returns locally for Labour candidates. In the 2010 election all six Warwickshire constituencies were won by the Conservative party, though this constituency was the most marginal, falling on a substantial swing of 8.1% from Labour to the Conservatives (compared to a national swing of 5%).
Like much of the county, the area includes many rural villages which can today be classified as 'commuter' and 'retirement', south of the National Forest, south east of Tamworth and the small cathedral city of Lichfield and centred less than 10 miles (16 km) east of Birmingham, which provides some work locally in the creative and international export sectors. Many towns and villages have a history of coal mining and heavy industry, linked to a strong Labour vote.[4]
Settlements include Bedworth, just north of Coventry, and the historic market town of Atherstone.[n 3]
Boundaries[]

The constituency since 2010 has all but two wards of North Warwickshire.[n 4]
1832–1885: The Hundred of Hemlingford, the County of the City of Coventry, and the Rugby and Kirby Divisions of the Hundred of Knightlow.[5]
1983–2010: The Borough of North Warwickshire, and the Borough of Nuneaton and Bedworth wards of Exhall, Heath, Mount Pleasant, and Poplar.
2010–present: The Borough of North Warwickshire wards of Atherstone Central, Atherstone North, Atherstone South and Mancetter, Baddesley and Grendon, Coleshill North, Coleshill South, Curdworth, Dordon, Fillongley, Hurley and Wood End, Kingsbury, Newton Regis and Warton, Polesworth East, Polesworth West, and Water Orton, and the Borough of Nuneaton and Bedworth wards of Bede, Exhall, Heath, Poplar, and Slough.
History[]
History 1832–1885[]
The North Warwickshire constituency was created for the 1832 general election, when the Great Reform Act divided the former Warwickshire constituency into two new divisions: North Warwickshire and South Warwickshire.
Under the Redistribution of Seats Act 1885, North Warwickshire was abolished for the 1885 general election, when Warwickshire was divided into six new single-member constituencies: Rugby, Stratford-on-Avon, Nuneaton, Sutton Coldfield, Erdington and Tamworth.
History 1983–present[]
The current North Warwickshire county constituency was created for the 1983 general election, replacing outlying parts of the Meriden and Nuneaton constituencies. The seat was won by Francis Maude of the Conservative Party at the 1983 general election, who held it until 1992, when it was taken by Mike O'Brien of Labour. Labour held the seat comfortably until 2010.
On 8 March 2007, former Army Officer and polar explorer Dan Byles was selected at an open primary to contest North Warwickshire for the Conservative Party. At the 2010 general election, Byles won the seat off Mike O'Brien by just 54 votes, making him the Conservative Member of Parliament with the smallest majority in the country. However, a strong Conservative performance during the latter part of the decade saw the seat become safer for the Conservatives - the result in 2019 being akin to a safe Conservative seat.
Elections[]
Elections in the 2010s[]
| Party | Candidate | Votes | % | ±% | |
|---|---|---|---|---|---|
| Conservative | Craig Tracey | 30,249 | 65.9 | ||
| Labour | Claire Breeze | 12,293 | 26.8 | ||
| Liberal Democrats | Richard Whelan | 2,069 | 4.5 | ||
| Green | James Platt | 1,303 | 2.8 | ||
| Majority | 17,956 | 39.1 | |||
| Turnout | 45,914 | 65.3 | |||
| Conservative hold | Swing | ||||
| Party | Candidate | Votes | % | ±% | |
|---|---|---|---|---|---|
| Conservative | Craig Tracey | 26,860 | 56.9 | ||
| Labour | Julie Jackson | 18,350 | 38.9 | ||
| Liberal Democrats | James Cox | 1,028 | 2.2 | ||
| Green | Keith Kondakor | 940 | 2.0 | ||
| Majority | 8,510 | 18.0 | |||
| Turnout | 47,178 | 63.5 | |||
| Conservative hold | Swing | ||||
| Party | Candidate | Votes | % | ±% | |
|---|---|---|---|---|---|
| Conservative | Craig Tracey | 20,042 | 42.3 | ||
| Labour | Mike O'Brien | 17,069 | 36.0 | ||
| UKIP | William Cash[8] | 8,256 | 17.4 | ||
| Liberal Democrats | Alan Beddow | 978 | 2.1 | ||
| Green | Ian Bonner | 894 | 1.9 | New | |
| TUSC | Eileen Hunter | 138 | 0.3 | New | |
| Majority | 2,973 | 6.3 | |||
| Turnout | 47,377 | 67.2 | |||
| Conservative hold | Swing | ||||
| Party | Candidate | Votes | % | ±% | |
|---|---|---|---|---|---|
| Conservative | Daniel Byles | 18,993 | 40.2 | ||
| Labour | Mike O'Brien | 18,939 | 40.1 | ||
| Liberal Democrats | Stephen Martin | 5,481 | 11.6 | ||
| BNP | Jason Holmes | 2,106 | 4.5 | ||
| UKIP | Stephen Fowler | 1,335 | 2.8 | ||
| English Democrat | David Lane | 411 | 0.9 | New | |
| Majority | 54 | 0.1 | N/A | ||
| Turnout | 47,265 | 67.4 | |||
| Conservative gain from Labour | Swing | ||||
Elections in the 2000s[]
| Party | Candidate | Votes | % | ±% | |
|---|---|---|---|---|---|
| Labour | Mike O'Brien | 22,561 | 48.1 | ||
| Conservative | Ian Gibb | 15,008 | 32.0 | ||
| Liberal Democrats | Jerry Roodhouse | 6,212 | 13.2 | ||
| BNP | Michaela Mackenzie | 1,910 | 4.1 | New | |
| UKIP | Ian Campbell | 1,248 | 2.7 | ||
| Majority | 7,553 | 16.1 | |||
| Turnout | 46,939 | 62.2 | |||
| Labour hold | Swing | ||||
| Party | Candidate | Votes | % | ±% | |
|---|---|---|---|---|---|
| Labour | Mike O'Brien | 24,023 | 54.1 | ||
| Conservative | Geoffrey Parsons | 14,384 | 32.4 | ||
| Liberal Democrats | William Powell | 5,052 | 11.4 | ||
| UKIP | John Flynn | 950 | 2.1 | ||
| Majority | 9,639 | 21.7 | |||
| Turnout | 44,409 | 60.2 | |||
| Labour hold | Swing | ||||
Elections in the 1990s[]
| Party | Candidate | Votes | % | ±% | |
|---|---|---|---|---|---|
| Labour | Mike O'Brien | 31,669 | 58.4 | ||
| Conservative | Stephen Hammond | 16,902 | 31.2 | ||
| Liberal Democrats | William Powell | 4,040 | 7.4 | ||
| Referendum | Roland Mole | 917 | 1.7 | New | |
| UKIP | Christopher Cooke | 533 | 1.0 | New | |
| Berties Party | Ian Moorecroft | 178 | 0.3 | New | |
| Majority | 14,767 | 27.2 | |||
| Turnout | 54,239 | 74.7 | |||
| Labour hold | Swing | ||||
| Party | Candidate | Votes | % | ±% | |
|---|---|---|---|---|---|
| Labour | Mike O'Brien | 27,599 | 46.1 | ||
| Conservative | Francis Maude | 26,145 | 43.6 | ||
| Liberal Democrats | Noel R Mitchell | 6,167 | 10.3 | ||
| Majority | 1,454 | 2.5 | N/A | ||
| Turnout | 59,862 | 82.8 | |||
| Labour gain from Conservative | Swing | ||||
Elections in the 1980s[]
| Party | Candidate | Votes | % | ±% | |
|---|---|---|---|---|---|
| Conservative | Francis Maude | 25,453 | 45.08 | ||
| Labour | Mike O'Brien | 22,624 | 40.07 | ||
| SDP | Suzan Neale | 8,382 | 14.85 | ||
| Majority | 2,829 | 5.01 | |||
| Turnout | 56,459 | 79.87 | |||
| Conservative hold | Swing | ||||
| Party | Candidate | Votes | % | ±% | |
|---|---|---|---|---|---|
| Conservative | Francis Maude | 22,452 | 42.0 | ||
| Labour | John Tomlinson | 19,867 | 37.1 | ||
| SDP | Howard Kerry | 11,207 | 20.9 | ||
| Majority | 2,585 | 4.9 | |||
| Turnout | 53,526 | 78.0 | |||
| Conservative win (new seat) | |||||
Elections in the 1880s[]
| Party | Candidate | Votes | % | ±% | |
|---|---|---|---|---|---|
| Conservative | Philip Muntz | 5,282 | 59.9 | N/A | |
| Liberal | Archibald Corbett | 3,538 | 40.1 | New | |
| Majority | 1,744 | 19.8 | N/A | ||
| Turnout | 8,820 | 73.5 | N/A | ||
| Registered electors | 11,993 | ||||
| Conservative hold | |||||
- Caused by Bromley-Davenport's death.
| Party | Candidate | Votes | % | ±% | |
|---|---|---|---|---|---|
| Conservative | William Bromley-Davenport | Unopposed | |||
| Conservative | Charles Newdigate Newdegate | Unopposed | |||
| Registered electors | 11,789 | ||||
| Conservative hold | |||||
| Conservative hold | |||||
Elections in the 1870s[]
| Party | Candidate | Votes | % | ±% | |
|---|---|---|---|---|---|
| Conservative | Charles Newdigate Newdegate | 4,672 | 38.3 | +9.3 | |
| Conservative | William Bromley-Davenport | 4,322 | 35.5 | +7.5 | |
| Liberal | George Frederick Muntz[20] | 3,189 | 26.2 | −16.8 | |
| Majority | 1,133 | 9.3 | +3.1 | ||
| Turnout | 7,686 (est) | 75.4 (est) | −0.9 | ||
| Registered electors | 10,200 | ||||
| Conservative hold | Swing | +8.9 | |||
| Conservative hold | Swing | +8.0 | |||
Elections in the 1860s[]
| Party | Candidate | Votes | % | ±% | |
|---|---|---|---|---|---|
| Conservative | Charles Newdigate Newdegate | 4,547 | 29.0 | −8.4 | |
| Conservative | William Bromley-Davenport | 4,377 | 28.0 | −6.0 | |
| Liberal | George Frederick Muntz | 3,411 | 21.8 | +7.5 | |
| Liberal | Edward Fordham Flower | 3,322 | 21.2 | +6.9 | |
| Majority | 966 | 6.2 | +0.7 | ||
| Turnout | 7,829 (est) | 76.3 (est) | −4.5 | ||
| Registered electors | 10,266 | ||||
| Conservative hold | Swing | −7.8 | |||
| Conservative hold | Swing | −6.6 | |||
| Party | Candidate | Votes | % | ±% | |
|---|---|---|---|---|---|
| Conservative | Charles Newdigate Newdegate | 3,159 | 37.4 | N/A | |
| Conservative | William Bromley | 2,873 | 34.0 | N/A | |
| Liberal | George Frederick Muntz | 2,408 | 28.5 | New | |
| Majority | 465 | 5.5 | N/A | ||
| Turnout | 5,424 (est) | 80.8 (est) | N/A | ||
| Registered electors | 6,710 | ||||
| Conservative hold | Swing | N/A | |||
| Conservative hold | Swing | N/A | |||
| Party | Candidate | Votes | % | ±% | |
|---|---|---|---|---|---|
| Conservative | William Bromley | Unopposed | |||
| Conservative hold | |||||
- Caused by Spooner's death.
Elections in the 1850s[]
| Party | Candidate | Votes | % | ±% | |
|---|---|---|---|---|---|
| Conservative | Charles Newdigate Newdegate | Unopposed | |||
| Conservative | Richard Spooner | Unopposed | |||
| Registered electors | 6,871 | ||||
| Conservative hold | |||||
| Conservative hold | |||||
| Party | Candidate | Votes | % | ±% | |
|---|---|---|---|---|---|
| Conservative | Charles Newdigate Newdegate | Unopposed | |||
| Conservative | Richard Spooner | Unopposed | |||
| Registered electors | 6,832 | ||||
| Conservative hold | |||||
| Conservative hold | |||||
| Party | Candidate | Votes | % | ±% | |
|---|---|---|---|---|---|
| Conservative | Charles Newdigate Newdegate | 2,950 | 30.0 | -8.1 | |
| Conservative | Richard Spooner | 2,822 | 28.7 | -3.4 | |
| Whig | Frederick Craven[22] | 2,038 | 20.7 | ||
| Whig | Sir Thomas George Skipwith, 9th Baronet | 2,021 | 20.6 | ||
| Majority | 784 | 8.0 | +5.7 | ||
| Turnout | 4,916 (est) | 70.2 (est) | |||
| Registered electors | 7,002 | ||||
| Conservative hold | Swing | ||||
| Conservative hold | Swing | ||||
Elections in the 1840s[]
| Party | Candidate | Votes | % | ±% | |
|---|---|---|---|---|---|
| Conservative | Charles Newdigate Newdegate | 2,915 | 38.1 | N/A | |
| Conservative | Richard Spooner | 2,451 | 32.1 | N/A | |
| Whig | William Henry Leigh[23] | 2,278 | 29.8 | New | |
| Majority | 173 | 2.3 | N/A | ||
| Turnout | 4,961 (est) | 77.9 (est) | N/A | ||
| Registered electors | 6,371 | ||||
| Conservative hold | Swing | N/A | |||
| Conservative hold | Swing | N/A | |||
| Party | Candidate | Votes | % | ±% | |
|---|---|---|---|---|---|
| Conservative | Charles Newdigate Newdegate | Unopposed | |||
| Conservative hold | |||||
- Caused by Eardley-Wilmot's resignation after being appointed Governor of Tasmania
| Party | Candidate | Votes | % | ±% | |
|---|---|---|---|---|---|
| Conservative | William Stratford Dugdale | Unopposed | |||
| Conservative | John Eardley-Wilmot | Unopposed | |||
| Registered electors | 6,785 | ||||
| Conservative hold | |||||
| Conservative hold | |||||
Elections in the 1830s[]
| Party | Candidate | Votes | % | ±% | |
|---|---|---|---|---|---|
| Conservative | William Stratford Dugdale | 3,326 | 32.7 | −3.4 | |
| Conservative | John Eardley-Wilmot | 2,768 | 27.2 | −10.1 | |
| Whig | Grey Skipwith | 2,292 | 22.5 | +9.2 | |
| Whig | Charles Holte Bracebridge | 1,787 | 17.6 | +4.3 | |
| Majority | 476 | 4.7 | −4.8 | ||
| Turnout | 5,099 | 76.9 | c. +4.0 | ||
| Registered electors | 6,632 | ||||
| Conservative hold | Swing | −5.1 | |||
| Conservative hold | Swing | −8.4 | |||
| Party | Candidate | Votes | % | ±% | |
|---|---|---|---|---|---|
| Conservative | John Eardley-Wilmot | 2,600 | 37.3 | −3.6 | |
| Conservative | William Stratford Dugdale | 2,513 | 36.1 | +5.7 | |
| Whig | Arthur Francis Gregory[24] | 1,854 | 26.6 | −2.1 | |
| Majority | 659 | 9.5 | +7.8 | ||
| Turnout | c. 3,484 | c. 72.9 | c. −10.5 | ||
| Registered electors | 4,779 | ||||
| Conservative hold | Swing | −1.3 | |||
| Conservative hold | Swing | +3.4 | |||
| Party | Candidate | Votes | % | ||
|---|---|---|---|---|---|
| Tory | John Eardley-Wilmot | 2,237 | 40.9 | ||
| Tory | William Stratford Dugdale | 1,666 | 30.4 | ||
| Whig | Dempster Heming | 1,573 | 28.7 | ||
| Majority | 93 | 1.7 | |||
| Turnout | 3,109 | 83.4 | |||
| Registered electors | 3,730 | ||||
| Tory win (new seat) | |||||
| Tory win (new seat) | |||||
See also[]
Notes[]
- ^ A county constituency (for the purposes of election expenses and type of returning officer)
- ^ As with all constituencies, the constituency elects one Member of Parliament (MP) by the first past the post system of election at least every five years.
- ^ This saw considerable population expansion from 1995–2010
- ^ Arley and Whitacre and Hartshill, moved in 2010 to Nuneaton
References[]
- ^ "Electorate Figures – Boundary Commission for England". 2011 Electorate Figures. Boundary Commission for England. 4 March 2011. Archived from the original on 6 November 2010. Retrieved 13 March 2011.
- ^ a b c Leigh Rayment's Historical List of MPs – Constituencies beginning with "W" (part 1)
- ^ a b c d e f g h i j Stooks Smith, Henry (1845). The Parliaments of England, from 1st George I., to the Present Time. Vol II: Oxfordshire to Wales Inclusive. London: Simpkin, Marshall, & Co. p. 96. Retrieved 3 June 2019 – via Google Books.
- ^ "2011 Census Interactive – ONS". ons.gov.uk. Archived from the original on 29 January 2016.
- ^ "The statutes of the United Kingdom of Great Britain and Ireland. 2 & 3 William IV. Cap. XLV: An Act to amend the Representation of the People in England and Wales". London: His Majesty's statute and law printers. 1832. pp. 154–206. Retrieved 27 July 2017.
- ^ "Warwickshire North Parliamentary constituency". BBC News. BBC. Retrieved 30 November 2019.
- ^ "Election Data 2015". Electoral Calculus. Archived from the original on 17 October 2015. Retrieved 17 October 2015.
- ^ "UK Polling Report".
- ^ "Election Data 2010". Electoral Calculus. Archived from the original on 26 July 2013. Retrieved 17 October 2015.
- ^ "UK > England > West Midlands > Warwickshire North". Election 2010. BBC. 7 May 2010. Retrieved 10 May 2010.
- ^ "Election Data 2005". Electoral Calculus. Archived from the original on 15 October 2011. Retrieved 18 October 2015.
- ^ "Election Data 2001". Electoral Calculus. Archived from the original on 15 October 2011. Retrieved 18 October 2015.
- ^ "Election Data 1997". Electoral Calculus. Archived from the original on 15 October 2011. Retrieved 18 October 2015.
- ^ "'Warwickshire North', May 1997 -". ElectionWeb Project. Cognitive Computing Limited. Retrieved 18 May 2016.
- ^ "Election Data 1992". Electoral Calculus. Archived from the original on 15 October 2011. Retrieved 18 October 2015.
- ^ "UK General Election results April 1992". Richard Kimber's Political Science Resources. Politics Resources. 9 April 1992. Archived from the original on 8 May 2015. Retrieved 6 December 2010.
- ^ "Election Data 1987". Electoral Calculus. Archived from the original on 15 October 2011. Retrieved 18 October 2015.
- ^ "Election Data 1983". Electoral Calculus. Archived from the original on 15 October 2011. Retrieved 18 October 2015.
- ^ a b c d e f g h i j k l m n o Craig, F. W. S., ed. (1977). British Parliamentary Election Results 1832-1885 (e-book) (1st ed.). London: Macmillan Press. pp. 474–475. ISBN 978-1-349-02349-3.
{{cite book}}:|format=requires|url=(help) - ^ "The Polling". Leamington Spa Courier. 14 February 1874. p. 7. Retrieved 22 January 2018 – via British Newspaper Archive.
- ^ "General Election". The Ipswich Journal. 17 July 1852. p. 3. Retrieved 18 August 2018 – via British Newspaper Archive.
- ^ "The English Elections". Cork Examiner. 12 July 1852. p. 3. Retrieved 18 August 2018 – via British Newspaper Archive.
- ^ "Election Movements". Greenock Advertiser. 20 August 1847. p. 1. Retrieved 3 June 2019 – via British Newspaper Archive.
- ^ "General Elections". Morning Chronicle. 16 January 1835. p. 1. Retrieved 3 May 2020 – via British Newspaper Archive.
| Authority control |
|---|

- Parliamentary constituencies in Warwickshire
- Constituencies of the Parliament of the United Kingdom established in 1832
- Constituencies of the Parliament of the United Kingdom disestablished in 1885
- Constituencies of the Parliament of the United Kingdom established in 1983