Odžak
This article needs additional citations for verification. (February 2022) |
Odžak
Оџак | |
|---|---|
Town and municipality | |
 | |
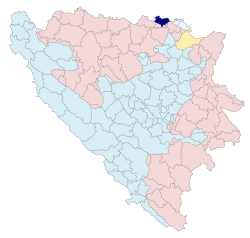 Location of Odžak within Bosnia and Herzegovina | |
 Odžak Location of Odžak within Bosnia and Herzegovina | |
| Coordinates: 45°0′38″N 18°19′35″E / 45.01056°N 18.32639°ECoordinates: 45°0′38″N 18°19′35″E / 45.01056°N 18.32639°E | |
| Country | |
| Entity | Federation of Bosnia and Herzegovina |
| Canton | |
| Geographical region | Posavina |
| Government | |
| • Municipal mayor | Nada Ćulap (HDZ BiH) |
| Area | |
| • Town and municipality | 118 km2 (46 sq mi) |
| Population (2013 census) | |
| • Town and municipality | 18,821[1] |
| • Density | 180/km2 (500/sq mi) |
| • Urban | 8,259 |
| Time zone | UTC+1 (CET) |
| • Summer (DST) | UTC+2 (CEST) |
| Area code(s) | +387 31 |
| Website | odzak |

Odžak (Serbian Cyrillic: Оџак) is a town and municipality located in Posavina Canton of the Federation of Bosnia and Herzegovina, an entity of Bosnia and Herzegovina. It is situated in the northern part of Bosnia and Herzegovina, near the river of Sava, 10 km (6.2 mi) from the border with Croatia.
Demographics[]
Population[]
| Population of settlements – Odžak municipality | |||||
|---|---|---|---|---|---|
| Settlement | 1971. | 1981. | 1991. | 2013. | |
| Total | 25,901 | 27,895 | 28,568 | 18,821 | |
| 1 | Donja Dubica | 3,254 | 1,472 | ||
| 2 | Donji Svilaj | 1,576 | 1,107 | ||
| 3 | Gornja Dubica | 1,596 | 918 | ||
| 4 | Gornji Svilaj | 1,810 | 673 | ||
| 5 | Novi Grad | 1,907 | 362 | ||
| 6 | Novo Selo | 2,669 | 1,605 | ||
| 7 | Odžak | 6,064 | 7,634 | 8,987 | 8,259 |
| 8 | Posavska Mahala | 1,199 | 849 | ||
| 9 | Potočani | 1,822 | 1,332 | ||
| 10 | Prud | 1,293 | 941 | ||
| 11 | Vrbovac | 1,695 | 1,015 | ||
Ethnic composition[]
| Ethnic composition – Odžak town | |||||||
|---|---|---|---|---|---|---|---|
| 2013. | 1991. | 1981. | 1971. | ||||
| Total | 8,259 (100,0%) | 9,386 (100,0%) | 7,634 (100,0%) | 6,064 (100,0%) | |||
| Bosniaks | 6,185 (74,89%) | 6,205 (66,11%) | 5,347 (70,04%) | 4,760 (78,50%) | |||
| Croats | 1,682 (20,37%) | 1,404 (14,96%) | 950 (12,44%) | 751 (12,38%) | |||
| Others | 311 (3,766%) | 359 (3,825%) | 85 (1,113%) | 48 (0,792%) | |||
| Serbs | 81 (0,981%) | 599 (6,382%) | 470 (6,157%) | 372 (6,135%) | |||
| Yugoslavs | 819 (8,726%) | 740 (9,693%) | 81 (1,336%) | ||||
| Montenegrins | 15 (0,196%) | 11 (0,181%) | |||||
| Albanians | 14 (0,183%) | 27 (0,445%) | |||||
| Slovenes | 5 (0,065%) | 2 (0,033%) | |||||
| Hungarians | 5 (0,065%) | 10 (0,165%) | |||||
| Macedonians | 3 (0,039%) | 2 (0,033%) | |||||
| Ethnic composition – Odžak municipality | |||||||
|---|---|---|---|---|---|---|---|
| 2013. | 1991. | 1981. | 1971. | ||||
| Total | 21,289 (100,0%) | 30,056 (100,0%) | 27,895 (100,0%) | 25,901 (100,0%) | |||
| Croats | 11,621 (61,74%) | 16,338 (54,36%) | 15,430 (55,31%) | 14,995 (57,89%) | |||
| Bosniaks | 6,220 (33,05%) | 6,220 (20,69%) | 5,371 (19,25%) | 4,777 (18,44%) | |||
| Serbs | 582 (3,092%) | 5,667 (18,85%) | 5 361 (19,22%) | 5,881 (22,71%) | |||
| Others | 340 (1,806%) | 684 (2,276%) | 376 (1,348%) | 97 (0,375%) | |||
| Albanians | 48 (0,255%) | 21 (0,075%) | 28 (0,108%) | ||||
| Roma | 8 (0,043%) | ||||||
| Montenegrins | 1 (0,005%) | 28 (0,100%) | 15 (0,058%) | ||||
| Slovenes | 1 (0,005%) | 8 (0,029%) | 3 (0,012%) | ||||
| Yugoslavs | 1 147 (3,816%) | 1 276 (4,574%) | 85 (0,328%) | ||||
| Macedonians | 13 (0,047%) | 5 (0,019%) | |||||
| Hungarians | 11 (0,039%) | 15 (0,058%) | |||||
Economy[]
Before the Breakup of Yugoslavia Over 5,000 people were employed primarily in industry and agriculture. From the largest industrial facilities were: "Strolit" - over 700 employees, "Energoinvest" - over 460 employees, "Vuntex" - over 400 employees, "Borovo" - about 200, 300 people were in Water Management Company "Posavina", there are also "Izbor", "Ratar", "Novogranja" etc.
Sports[]
The town is home to Napredak volleyball club. The local football club is NK Odžak 102.
References[]
- ^ "Naseljena Mjesta 1991/2013" (in Bosnian). Statistical Office of Bosnia and Herzegovina. Retrieved December 19, 2021.
External links[]
| Wikimedia Commons has media related to Odžak. |
- Official website

 Geographic data related to Odžak at OpenStreetMap
Municipalities of the Posavina Canton, Bosnia and Herzegovina | ||
|---|---|---|

This Posavina Canton geography article is a stub. You can help Wikipedia by . |
- Odžak
- Populated places in Odžak
- Cities and towns in the Federation of Bosnia and Herzegovina
- Municipalities of the Posavina Canton
- Federation of Bosnia and Herzegovina geography stubs