Rogatica
Rogatica
Рогатица | |
|---|---|
Town and municipality | |
 View on Rogatica | |
 Location of Rogatica within Republika Srpska | |
| Coordinates: 43°47′55″N 19°00′13″E / 43.79861°N 19.00361°ECoordinates: 43°47′55″N 19°00′13″E / 43.79861°N 19.00361°E | |
| Country | |
| Entity | |
| Geographical region | Podrinje |
| Government | |
| • Mayor | Milorad Jagodić (SNSD) |
| • Municipality | 645 km2 (249 sq mi) |
| Population (2013 census) | |
| • Town | 6,855 |
| • Municipality | 10,723 |
| • Municipality density | 17/km2 (43/sq mi) |
| Time zone | UTC+1 (CET) |
| • Summer (DST) | UTC+2 (CEST) |
| Area code(s) | 57 |
| Website | www |


Settlements of Rogatica municipality

Drina River in Slap, Rogatica

Monument dedicated to the fallen soldiers of the Bosnian Serb Army
Rogatica (Serbian Cyrillic: Рогатица) is a town and municipality located in eastern Republika Srpska, an entity of Bosnia and Herzegovina. As of 2013, it has a population of 10,723 inhabitants, while the town of Rogatica has a population of 6,855 inhabitants.
Demographics[]
Population[]
| Population of settlements – Rogatica municipality | |||||
|---|---|---|---|---|---|
| Settlement | 1971. | 1981. | 1991. | 2013. | |
| Total | 25,501 | 23,771 | 21,812 | 10,723 | |
| 1 | Plješevica | 454 | 426 | ||
| 2 | Rogatica | 4,792 | 6,496 | 8,916 | 6,855 |
| 3 | Seljani | 474 | 276 | ||
Ethnic composition[]
| Ethnic composition – Rogatica town | |||||||
|---|---|---|---|---|---|---|---|
| 2013. | 1991. | 1981. | 1971. | ||||
| Total | 6,855 (100,0%) | 8,916 (100,0%) | 6,496 (100,0%) | 4,792 (100,0%) | |||
| Bosniaks | 5,681 (63,72%) | 3,855 (59,34%) | 3,172 (66,19%) | ||||
| Serbs | 2,971 (33,32%) | 1,998 (30,76%) | 1,524 (31,80%) | ||||
| Yugoslavs | 140 (1,570%) | 584 (8,990%) | 41 (0,856%) | ||||
| Others | 108 (1,211%) | 9 (0,139%) | 17 (0,355%) | ||||
| Croats | 16 (0,179%) | 21 (0,323%) | 25 (0,522%) | ||||
| Montenegrins | 15 (0,231%) | 10 (0,209%) | |||||
| Albanians | 9 (0,139%) | 2 (0,042%) | |||||
| Slovenes | 4 (0,062%) | 1 (0,021%) | |||||
| Macedonians | 1 (0,015%) | ||||||
| Ethnic composition – Rogatica municipality | |||||||
|---|---|---|---|---|---|---|---|
| 2013. | 1991. | 1981. | 1971. | ||||
| Total | 10,723 (100,0%) | 21 978 (100,0%) | 23,771 (100,0%) | 25,501 (100,0%) | |||
| Serbs | 9,527 (88,85%) | 8,391 (38,18%) | 8,877 (37,34%) | 10,208 (40,03%) | |||
| Bosniaks | 1,117 (10,42%) | 13,209 (60,10%) | 14,020 (58,98%) | 15,096 (59,20%) | |||
| Others | 60 (0,560%) | 173 (0,787%) | 31 (0,130%) | 66 (0,259%) | |||
| Croats | 19 (0,177%) | 19 (0,086%) | 32 (0,135%) | 45 (0,176%) | |||
| Yugoslavs | 186 (0,846%) | 762 (3,206%) | 62 (0,243%) | ||||
| Montenegrins | 22 (0,093%) | 17 (0,067%) | |||||
| Albanians | 20 (0,084%) | 4 (0,016%) | |||||
| Slovenes | 5 (0,021%) | 1 (0,004%) | |||||
| Macedonians | 2 (0,008%) | 2 (0,008%) | |||||
Economy[]
The following table gives a preview of total number of registered people employed in legal entities per their core activity (as of 2018):[1]
| Activity | Total |
|---|---|
| Agriculture, forestry and fishing | 255 |
| Mining and quarrying | - |
| Manufacturing | 363 |
| Electricity, gas, steam and air conditioning supply | 69 |
| Water supply; sewerage, waste management and remediation activities | 65 |
| Construction | 30 |
| Wholesale and retail trade, repair of motor vehicles and motorcycles | 346 |
| Transportation and storage | 48 |
| Accommodation and food services | 71 |
| Information and communication | 15 |
| Financial and insurance activities | 25 |
| Real estate activities | - |
| Professional, scientific and technical activities | 22 |
| Administrative and support service activities | 6 |
| Public administration and defense; compulsory social security | 180 |
| Education | 149 |
| Human health and social work activities | 104 |
| Arts, entertainment and recreation | 26 |
| Other service activities | 29 |
| Total | 1,803 |
Notable people[]
- Kemal Mešić, athlete
- Muhamed Mustafić, handball player
- Ibrahim Šehić, football goalkeeper
- Mersad Selimbegović, football player
- Nezir Škaljić, third mayor of Sarajevo (1899–1905)
- Safet Zec, painter
Gallery[]

Ancien Roman tomb
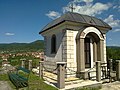
Ossuary of the Serbian Army member killed in action in World War I
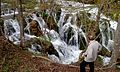
Waterfall located in the municipality
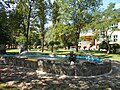
Park in the city
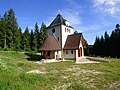
Monastery of Saint John the Baptist

Church in Obrtići


References[]
- ^ "Cities and Municipalities of Republika Srpska" (PDF). rzs.rs.ba. Republika Srspka Institute of Statistics. 25 December 2019. Retrieved 31 December 2019.
External links[]
| Wikimedia Commons has media related to Rogatica. |

| show Authority control |
|---|
Categories:
- Rogatica
- Populated places in Rogatica
- Cities and towns in Republika Srpska
- Glasinac plateau