Population of Canada by province and territory

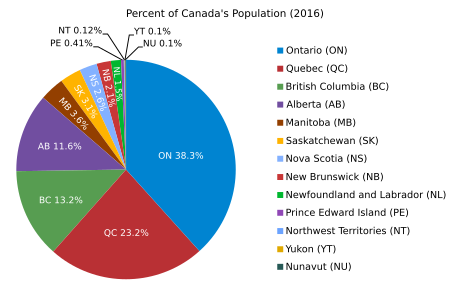
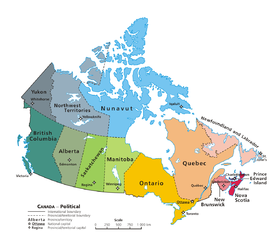
Canada is divided into 10 provinces and three territories. The majority of Canada's population is concentrated in the areas close to the Canada–US border. Its four largest provinces by area (Quebec, Ontario, British Columbia, and Alberta) are also (with Quebec and Ontario switched in order) its most populous; together they account for 86% of the country's population. The territories (the Northwest Territories, Nunavut, and Yukon) account for over a third of Canada's area but are home to only 0.3% of its population, which skews the national population density value.
Canada's population grew by 5.0% between the 2006 and 2011 censuses.[1] Except for New Brunswick, all territories and provinces increased in population from 2011 to 2016. In terms of percent change, the fastest-growing province or territory was Nunavut with an increase of 12.7% between 2011 and 2016, followed by Alberta with 11.6% growth. New Brunswick's population decreased by 0.5% between 2011 and 2016.
Generally, provinces steadily grew in population along with Canada. However, some provinces such as Saskatchewan, Prince Edward Island, and Newfoundland and Labrador experienced long periods of stagnation or population decline. Ontario and Quebec were always the two biggest provinces in Canada, with over 60% of the population at any given time. The demographic importance of the West steadily grew over time, while the importance of Atlantic Canada steadily slipped. Canada's population has increased every year since Confederation in 1867: see List of population of Canada by year.
Population[]
| Population | Name[1] | Population, 2016 Census |
Growth, 2011–16 |
Land area (km2) |
Population density (per km2) |
House of Commons seats |
Senate seats | 2021 population (Q2 est.)[2] |
Growth,
2016–21 | ||||
|---|---|---|---|---|---|---|---|---|---|---|---|---|---|
| Total | Proportion | Total | Proportion | Total | Proportion | Total | Proportion | ||||||
| 1 | 13,448,494 | 38.26% | 4.6% | 908,699.33 | 14.8 | 121 | 35.8% | 24 | 22.86% | 14,789,778 | 38.78% | 9.97% | |
| 2 | 8,164,361 | 23.23% | 3.3% | 1,356,625.27 | 6.0 | 78 | 23.1% | 24 | 22.86% | 8,585,523 | 22.54% | 5.16% | |
| 3 | 4,648,055 | 13.22% | 5.6% | 922,503.01 | 5.0 | 42 | 12.4% | 6 | 5.71% | 5,174,724 | 13.54% | 11.33% | |
| 4 | 4,067,175 | 11.57% | 11.6% | 640,330.46 | 6.4 | 34 | 10.1% | 6 | 5.71% | 4,444,277 | 11.66% | 9.27% | |
| 5 | 1,278,365 | 3.64% | 5.8% | 552,370.99 | 2.3 | 14 | 4.1% | 6 | 5.71% | 1,382,904 | 3.63% | 8.18% | |
| 6 | 1,098,352 | 3.12% | 6.3% | 588,243.54 | 1.9 | 14 | 4.1% | 6 | 5.71% | 1,179,906 | 3.10% | 7.43% | |
| 7 | 923,598 | 2.63% | 0.2% | 52,942.27 | 17.4 | 11 | 3.3% | 10 | 9.52% | 982,326 | 2.57% | 6.36% | |
| 8 | 747,101 | 2.13% | −0.5% | 71,388.81 | 10.5 | 10 | 3.0% | 10 | 9.52% | 783,721 | 2.06% | 4.90% | |
| 9 | 519,716 | 1.48% | 1.0% | 370,514.08 | 1.4 | 7 | 2.1% | 6 | 5.71% | 520,286 | 1.37% | 0.11% | |
| 10 | 142,907 | 0.41% | 1.9% | 5,686.03 | 25.1 | 4 | 1.2% | 4 | 3.81% | 160,536 | 0.42% | 12.34% | |
| 11 | 41,786 | 0.12% | 0.8% | 1,143,793.86 | 0.04 | 1 | 0.3% | 1 | 0.95% | 44,991 | 0.12% | 7.97% | |
| 12 | 35,944 | 0.10% | 12.7% | 1,877,778.53 | 0.02 | 1 | 0.3% | 1 | 0.95% | 39,536 | 0.10% | 9.99% | |
| 13 | 35,874 | 0.10% | 5.8% | 474,712.68 | 0.08 | 1 | 0.3% | 1 | 0.95% | 42,596 | 0.11% | 18.74% | |
| Total | Totals | 35,151,728 | 100% | 5.0% | 8,965,588.85 | 3.9 | 338 | 100% | 105 | 100% | 38,131,104 | 100% | 8.48% |
Population growth rate[]

Current provinces and territories population growth rate are based on the Statistics Canada 2016 Census of Population.[3]
| Rank | Name | 2016 Census | 2011 Census | Change |
|---|---|---|---|---|
| 1 | 35,944 | 31,906 | +12.66% | |
| 2 | 4,067,175 | 3,645,257 | +11.57% | |
| 3 | 1,098,352 | 1,033,381 | +6.29% | |
| 4 | 35,874 | 33,897 | +5.83% | |
| 5 | 1,278,365 | 1,208,268 | +5.80% | |
| 6 | 4,648,055 | 4,400,057 | +5.64% | |
| 7 | 13,448,494 | 12,851,821 | +4.64% | |
| 8 | 8,164,361 | 7,903,001 | +3.31% | |
| 9 | 142,907 | 140,204 | +1.93% | |
| 10 | 519,716 | 514,536 | +1.01% | |
| 11 | 41,786 | 41,462 | +0.78% | |
| 12 | 923,598 | 921,727 | +0.20% | |
| 13 | 747,101 | 751,171 | −0.54% | |
| Total | 35,151,728 | 33,476,688 | +5.00% |
Demographic evolution[]
Historical population[]

The population of Canada increased every year since Confederation in 1867.[4] The first national census of the country was taken in 1871, and it covered the four provinces which were part of Canada at the time.[5] It recorded a population of 1,620,851 in Ontario, 1,191,516 in Quebec, 387,800 in Nova Scotia and 285,594 in New Brunswick [6] The population of each of these provinces continued to grow every year uninterrupted. However, their growth was slow in the late 19th century because there were few economic opportunities. As a result, many Canadians opted to emigrate in the United States for work.[7]
This phenomenon hit Quebec especially hard. Approximately 900,000 Quebec residents (French Canadian for the great majority) left for the United States between 1840 and 1930.[8][9] However, Quebec's population losses to emigration during this period were largely offset by its natural population growth. Indeed, until the middle of the 20th century, Quebec had a birth rate considerably higher than most of its contemporary industrialized societies.[10] This period of high French-Canadian population growth is nicknamed La Revanche des berceaux.[11]

Population growth in the Northwest Territories, and then the Western Provinces, picked up when the Canadian government passed the Dominion Lands Act in 1872 to encourage the settlement of the Canadian Prairies, and to help prevent the area from being claimed by the United States.[12] The act gave a claimant 160 acres (65 ha) for free, the only cost to the farmer being a $10 administration fee. Any male farmer who was at least 21 years of age and agreed to cultivate at least 40 acres (16 ha) of the land and build a permanent dwelling on it (within three years) qualified.[13] The population of the Canadian prairies grew rapidly in the last decade of the 19th century, and the population of Saskatchewan quintupled from 91,000 in 1901 to 492,000 in 1911.[14] The vast majority of these people were immigrants from Europe.[13]
Early counts of Northwest Territories' population tend to exclude the indigenous inhabitants of the territory.[6] The territory's population drops at the turn of the 20th and 21st centuries are due to its reduction in size, as Yukon, then Saskatchewan and Alberta were carved out of its territory, and the same with Nunavut a century later. Yukon's population spike at the turn of the 20th century is due to the Klondike Gold Rush, when an estimated 100,000 people tried to reach the Klondike goldfields between 1896 and 1899, of whom only around 30,000 to 40,000 eventually did.[15]
Generally, provinces steadily grew in population along with Canada. However, some provinces experienced long periods of stagnation or population decline. After peaking in 1891, Prince Edward Island's population started to decline every year until 1941, after which the province started growing again. In Saskatchewan, after a rapid population explosion at the beginning of the century that propelled the province to being the 3rd largest in the country, its population declined during the Great Depression, and its growth had been slow ever since. From 1931 to 2016, Saskatchewan's population increased by only 19.2%, well below the national average. Newfoundland and Labrador, on the other hand, experienced slow but continuous growth until the 1990s, when the cod fisheries collapsed, and their population started to fall.
After the collapse of the Canadian birth rate, most provinces now sustain their population with immigration from the developing world. The number of new immigrants increases every year.[16]
Demographic weight of provinces and territories[]
The demographic weight of each province in Canada has always constituted a sensitive issue. In 1840, the Durham Report recommended that Upper (now Ontario) and Lower Canada (now Quebec) be united into one province. The newly created Legislative Assembly of the Province of Canada was required to have equal representation from Canada East (now Quebec) and Canada West (now Ontario),[35] even though the population of Canada East was considerably larger. In 1840, the population of Canada East was estimated at 670,000, while the population of Canada West was estimated to be 480,000.[36] Lord Durham had not recommended this approach, and had instead proposed that the representation should be based on the respective populations of the two regions.[37] The British government rejected that recommendation and instead implemented sectional equality, apparently to give the English-speaking population of the new province a dominant voice in the provincial government.
However, the 1851 census revealed that Canada West's population had surpassed Canada East's. This fact fuelled demands in Canada West for the end of sectional equality and the move toward allocating seats in the legislation on the basis of population, nicknamed "rep by pop". This was a hotly contested issues at the constitutional conferences leading up to confederation, and the colonies reached a comprise in which the seats in the federal lower house (House of commons) would be allocated by population, and the seats in the federal upper house (Senate) would be allocated on the basis of three defined regions – Ontario, Quebec and the Maritimes – that would each have 24 seats.[38]
Since Confederation, Ontario and Quebec were always Canada's two most populous provinces. However, their combined demographic weight decreased from over 80% at Confederation to just over 60% in 2016. The Atlantic provinces also lost importance within Canada, from around 20% at Confederation to under 7% today. The West's importance, however, has only increased, from insignificant levels in 1871 to over 30% of the country in 2016. In the first half of the 20th century, the most populous western province was Saskatchewan, but its population was later eclipsed by British Columbia, Alberta, and Manitoba.[6][39]
The issue of the demographic weight of each provinces came up during the negotiations for the Patriation of the Constitution, and especially discussions around the amending formula of the constitution. The final formula stipulates that minor changes to the constitution had to be approved by the Parliament of Canada and the Legislature of 7 provinces representing at least 50% of the Canadian population. The essentially meant that either Ontario or Quebec had to agree to any constitutional amendments that affect all provinces.[40]
Quebec had managed to maintain a stable demographic weight within to Canada during the first half of the 20th century due to its high birth rate. However, their importance began to slip as their birth rate started to fall in the 1960s.[41] Quebec wanted to make it up through immigration, and for this purpose created its Ministry of Immigration in 1968, and negotiated for increased powers in this field with the federal government. However, new immigrants to Canada disproportionally go the Ontario, British Columbia and Alberta, fuelling their rise in demographic weight.[42] In response, a Canada–Québec Accord was concluded in 1991 which, among other things, guaranteed Quebec an immigration rate proportional to its demographic weight in Canada.[43] This provision was not fulfilled, as in 2005, immigration to Quebec represented only 16.5% of all immigration to Canada.[44]
Quebec also attempted to maintain its weight within the Canadian House of Commons during the constitutional negotiations of the early 1990s. Under the Charlottetown Accord, in exchange for Quebec losing Senate seats under a Triple-E Senate (dropping from 24 to 6), Quebec was guaranteed never to be allotted less than 25% of the seats in the House of Commons. The Accord was ultimately defeated in a public referendum.[45]
| Alberta |
| British Columbia |
| Manitoba |
| New Brunswick |
| Newfoundland & Labrador |
| Northwest Territories |
| Nova Scotia |
| Nunavut |
| Ontario |
| Prince Edward Island |
| Quebec |
| Saskatchewan |
| Yukon |
- Historical demographic weight of provinces and territories
See also[]
 Canada portal
- Population of Canada
- Interprovincial migration in Canada
- List of the largest cities and towns in Canada by area
- List of the largest municipalities in Canada by population
- List of the largest population centres in Canada
- List of largest Canadian cities by census
References[]
- ^ Jump up to: a b "Population and dwelling counts, for Canada, provinces and territories, 2016 and 2011 censuses – 100% data". Statistics Canada. February 8, 2017. Retrieved February 8, 2017.
- ^ "Table 051-0005: Estimates of population, Canada, provinces and territories". Statistics Canada. March 19, 2020. Retrieved March 19, 2020.
- ^ Canada, Government of Canada, Statistics (8 February 2017). "Census Profile, 2016 Census". www12.statcan.gc.ca.
- ^ "Estimated population of Canada, 1605 to present". Statistics Canada. 2009. Retrieved 16 April 2010.
- ^ "History of the Census of Canada". Statistics Canada. 2006. Retrieved 22 June 2010.
- ^ Jump up to: a b c d Series A2-14. Population of Canada by province, census dates, 1851 to 1976
- ^ "Emigration The Canadian Encyclopedia". www.thecanadianencyclopedia.ca. Retrieved 2020-03-30.
- ^ Bélanger, Damien-Claude (23 August 2000). "French Canadian Emigration to the United States, 1840–1930". Québec History, Claude Bélanger, Marianopolis College. Archived from the original on 25 January 2007. Retrieved 2007-01-31.
- ^ Bélanger, Claude. "Emigration to the United States from Canada and Quebec, 1840–1940". Quebec History. Marianopolis College. Retrieved 24 July 2013.
- ^ "Québec: dénatalité et immigration". www.axl.cefan.ulaval.ca. Retrieved 2020-03-30.
- ^ Colombo's Canadian References, Oxford University Press, 1976, p.444.
- ^ Lambrecht, Kirk N (1991). The Administration of Dominion Lands, 1870-1930.
- ^ Jump up to: a b "Dominion Lands Act | The Canadian Encyclopedia". www.thecanadianencyclopedia.ca. Retrieved 2018-12-27.
- ^ The history of Saskatchewan's population Archived 2006-05-19 at the Wayback Machine from Statistics Canada
- ^ Berton, Pierre, 1920-2004. (2001). Klondike : the last great gold rush, 1896-1899 (Rev. ed., Anchor Canada paperback ed.). Toronto: Anchor Canada. p. 396. ISBN 0-385-65844-3. OCLC 46661521.CS1 maint: multiple names: authors list (link)
- ^ "Canada Expected To Take In More Than One Million New Immigrants Between 2020-2022 | Link Newspaper". Retrieved 2020-03-30.
- ^ Belshaw, John Douglas (2015). "10.2 Demographics". Canadian History: Pre-Confederation. BCCampus.
- ^ "2006 Community Profiles - 2006 Canada Census". Statistics Canada. 2006.
- ^ "2011 Census Profiles". Statistics Canada. 2011.
- ^ "2016 Census profiles". Statistics Canada. 2016.
- ^ "Population urban and rural, by province and territory - Ontario". 2008-05-01. Archived from the original on 2008-04-10. Retrieved 2020-03-30.
- ^ "Population urban and rural, by province and territory - Quebec". 2008-05-01. Archived from the original on 2008-05-01. Retrieved 2020-03-30.
- ^ "Population urban and rural, by province and territory - Nova Scotia". 2008-05-01. Archived from the original on 2008-05-01. Retrieved 2020-03-30.
- ^ "Population urban and rural, by province and territory - New Brunswick". 2008-05-01. Archived from the original on 2008-05-01. Retrieved 2020-03-30.
- ^ "Population urban and rural, by province and territory - Manitoba". 2008-05-01. Archived from the original on 2008-05-13. Retrieved 2020-03-30.
- ^ "Population urban and rural, by province and territory - British Columbia". 2008-05-01. Archived from the original on 2008-04-10. Retrieved 2020-03-30.
- ^ "Population urban and rural, by province and territory - Prince Edward Island". 2008-05-01. Archived from the original on 2008-04-10. Retrieved 2020-03-30.
- ^ "Population urban and rural, by province and territory - Saskatchewan". 2008-05-01. Archived from the original on 2008-04-10. Retrieved 2020-03-30.
- ^ "Population urban and rural, by province and territory - Alberta". 2008-05-01. Archived from the original on 2008-04-10. Retrieved 2020-03-30.
- ^ "Census of Newfoundland and Labrador, 1935, vol. 1 : population by districts and settlements :: NL Books - Reference Sources, Directories, Etc". collections.mun.ca. Retrieved 2020-04-01.
- ^ "Population urban and rural, by province and territory - Newfoundland and Labrador". 2008-05-01. Archived from the original on 2008-03-21. Retrieved 2020-03-30.
- ^ "Population urban and rural, by province and territory - Northwest Territories". 2008-05-01. Archived from the original on 2008-04-10. Retrieved 2020-03-30.
- ^ "Population urban and rural, by province and territory - Yukon". 2008-05-01. Archived from the original on 2008-04-10. Retrieved 2020-03-30.
- ^ "Population urban and rural, by province and territory - Nunavut". 2008-05-01. Archived from the original on 2008-04-10. Retrieved 2020-03-30.
- ^ Union Act, 1840, s. 12.
- ^ "Province of Canada (1841-67)", Canadian Encyclopedia.
- ^ Lord Durham's Report, pp. 323-324.
- ^ "Rep by Pop | The Canadian Encyclopedia". www.thecanadianencyclopedia.ca. Retrieved 2020-03-30.
- ^ "Census profiles, 2016 census". Statistics Canada.
- ^ "Patriation of the Constitution | The Canadian Encyclopedia". www.thecanadianencyclopedia.ca. Retrieved 2020-03-30.
- ^ "Chapitre 2: Naissances et fécondité". Le bilan démographique du Québec: Édition 2019. Quebec city: Institut de la statistique du Québec. 2019. p. 36.
- ^ "Immigration and Ethnocultural Diversity Highlight Tables". Statistics Canada. 2016.
- ^ ICI.Radio-Canada.ca, Zone Politique -. "Il y a 50 ans, le Québec se dotait d'un ministère de l'Immigration". Radio-Canada.ca (in French). Retrieved 2018-11-04.
- ^ Annual Immigration by Province Archived 2006-10-07 at the Wayback Machine, Citizenship and Immigration Canada, URL accessed 2 July 2006
- ^ "Charlottetown Accord | The Canadian Encyclopedia". www.thecanadianencyclopedia.ca. Retrieved 2020-03-30.
- Lists of provinces and territories of Canada
- Ranked lists of country subdivisions
- Lists by population
- Demographics of Canada by province or territory