List of Canadian provinces and territories by gross domestic product
This article lists Canadian provinces and territories by gross domestic product (GDP).
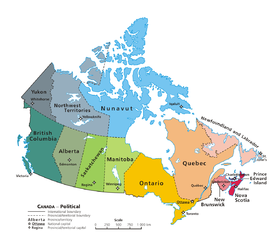
While Canada's ten provinces and three territories exhibit high per capita GDPs, there is wide variation among them. Ontario, the country's most populous province, is a major manufacturing and trade hub with extensive linkages to the northeastern and midwestern United States. The economies of Alberta, Saskatchewan, Newfoundland and Labrador and the territories rely heavily on natural resources. On the other hand, Manitoba, Quebec and The Maritimes have the country's lowest per capita GDP values.
In the face of these long-term regional disparities, the Government of Canada redistributes some of its revenues through unconditional equalization payments and finances the delivery of comparable levels of government services through the Canada Health Transfer and the Canada Social Transfer.
GDP and per capita GDP, 2019[]
A table listing total GDP (expenditure-based), share of Canadian GDP, population, and per capita GDP in 2019. For illustrative purposes, market income (total income less government transfers)[1] per capita from tax returns is included. (The per capita, rather than per tax filer, measure is chosen for comparability with GDP per capita.)
| Province or territory |
GDP (million CAD, 2019) |
Share of national GDP (%, 2019) |
Population (July 1, 2019) |
GDP per capita (CAD, 2019) |
Market income per capita (CAD, 2019) |
|---|---|---|---|---|---|
| Canada | 2,310,712 | 100 | 37,593,384 | 61,466 | 35,135 |
| Alberta | 352,884 | 15.27 | 4,361,694 | 80,905 | 40,094 |
| British Columbia | 309,059 | 13.38 | 5,090,955 | 60,707 | 36,723 |
| Manitoba | 73,814 | 3.19 | 1,369,540 | 53,897 | 30,132 |
| Newfoundland and Labrador | 35,349 | 1.53 | 523,476 | 71,527 | 30,977 |
| New Brunswick | 38,236 | 1.65 | 776,868 | 49,218 | 28,649 |
| Northwest Territories | 4,542 | 0.20 | 45,028 | 100,871 | 43,125 |
| Nova Scotia | 46,586 | 2.02 | 969,747 | 47,837 | 30,224 |
| Nunavut | 3,689 | 0.16 | 38,614 | 95,535 | 27,251 |
| Ontario | 891,811 | 38.59 | 14,544,718 | 61,315 | 36,298 |
| Prince Edward Island | 7,523 | 0.33 | 157,262 | 48,039 | 28,414 |
| Quebec | 460,357 | 19.92 | 8,501,703 | 54,149 | 32,351 |
| Saskatchewan | 82,917 | 3.59 | 1,172,302 | 70,730 | 32,516 |
| Yukon | 3,157 | 0.14 | 41,477 | 76,114 | 42,715 |
Source: Statistics Canada: GDP (totals),[2] Population,[3] Total income and government transfers,[4] Population covered by income data[5]
International comparisons, 2019[]
In the table below, the figures from the previous table are converted to United States dollars using the ratio of the International Monetary Fund's estimate for Canada's GDP by purchasing power parity to Canada's nominal GDP.[6] The national economy with the closest figure for the relevant year according to the International Monetary Fund is then indicated.
(Note that because the same conversion rate is used for all of Canada, this method overstates the GDP PPP of provinces and territories with high price levels, and understates the GDP PPP of provinces and territories with low price levels.)
| Province or territory |
GDP PPP (million Int$, 2019) |
Comparable economy by GDP PPP |
GDP per capita PPP (Int$, 2019) |
Comparable economy by GDP PPP per capita |
|---|---|---|---|---|
| Canada | 1,932,305 | Spain | 51,400 | Bahrain |
| Ontario | 745,766 | South Africa | 51,274 | Finland |
| Quebec | 384,968 | Israel | 45,281 | South Korea |
| Alberta | 295,095 | Sri Lanka | 67,656 | Norway |
| British Columbia | 258,447 | Ethiopia | 50,766 | Finland |
| Saskatchewan | 69,338 | Yemen | 59,147 | Netherlands |
| Manitoba | 61,726 | Latvia | 45,071 | South Korea |
| Nova Scotia | 38,957 | Trinidad and Tobago | 40,172 | Bahamas |
| New Brunswick | 31,974 | Tajikistan | 41,158 | Slovenia |
| Newfoundland and Labrador | 29,560 | Niger | 56,469 | Germany |
| Prince Edward Island | 6,291 | Eritrea | 40,003 | Bahamas |
| Northwest Territories | 3,798 | Cabo Verde | 84,352 | Ireland |
| Nunavut | 3,085 | Saint Lucia | 79,890 | Switzerland |
| Yukon | 2,640 | Comoros | 63,650 | United Arab Emirates |
Source: International Monetary Fund[7]
Real GDP at basic prices, 2014-2018[]
A table listing annual GDP at basic prices from 2014 through 2018 in chained 2012 dollars. Caution: GDP at basic prices differs from GDP in the treatment of taxes and subsidies.[8]
| Province or territory |
GDP (million chained (2012) CAD, 2014) |
GDP (million chained (2012) CAD, 2015) |
GDP (million chained (2012) CAD, 2016) |
GDP (million chained (2012) CAD, 2017) |
GDP (million chained (2012) CAD, 2018) |
|---|---|---|---|---|---|
| British Columbia | 219,060.9 | 224,153.4 | 231,509.9 | 240,657.9 | 246,506.3 |
| Alberta | 338,262.6 | 326,476.7 | 313,241.5 | 327,596.2 | 335,095.6 |
| Saskatchewan | 80,175.7 | 79,574.2 | 79,364.4 | 81,179.0 | 82,502.7 |
| Manitoba | 58,276.3 | 59,082.5 | 60,066.2 | 61,941.2 | 62,723.1 |
| Ontario | 659,861.2 | 677,384.0 | 693,900.4 | 712,984.3 | 728,363.7 |
| Quebec | 338,319.0 | 341,688.0 | 346,713.7 | 356,677.9 | 365,614.4 |
| New Brunswick | 29,039.6 | 29,275.7 | 29,686.3 | 30,271.8 | 30,295.3 |
| Prince Edward Island | 5,205.6 | 5,280.7 | 5,372.2 | 5,553.3 | 5,700.0 |
| Nova Scotia | 34,747.2 | 35,013.4 | 35,549.3 | 36,075.4 | 36,518.2 |
| Newfoundland and Labrador | 31,143.3 | 30,806.0 | 31,334.5 | 31,610.6 | 30,757.9 |
| Yukon | 2,510.9 | 2,320.2 | 2,482.5 | 2,554.5 | 2,626.1 |
| Northwest Territories | 4,574.6 | 4,621.3 | 4,679.8 | 4,861.3 | 4,954.7 |
| Nunavut | 2,363.6 | 2,353.0 | 2,434.3 | 2,685.3 | 2,955.0 |
Source: Statistics Canada[9]
Components of GDP, 2014[]
A table of Canadian provinces and territories by descending GDP (at current prices and expenditure-based); all figures are from Statistics Canada.[10]
| Province or territory |
GDP (million CAD, 2014) |
= Final consumption expenditure |
+ Gross capital formation |
+ Investment in Inventories |
+ Exports | − Imports |
|---|---|---|---|---|---|---|
| Canada | 1,973,043 | 1,513,043 | 469,739 | 8,488 | 1,005,446 | 1,024,061 |
| British Columbia | 237,188 | 202,405 | 56,081 | 1,747 | 93,215 | 116,444 |
| Alberta | 375,756 | 198,643 | 132,709 | 1,876 | 206,923 | 164,444 |
| Saskatchewan | 82,780 | 50,046 | 26,100 | −2,316 | 58,328 | 49,340 |
| Manitoba | 64,077 | 55,129 | 15,663 | −385 | 35,992 | 42,256 |
| Ontario | 721,970 | 576,173 | 135,610 | 5,234 | 370,845 | 365,804 |
| Quebec | 370,064 | 315,396 | 74,182 | 2,110 | 171,350 | 193,352 |
| New Brunswick | 32,056 | 31,898 | 5,391 | 1 | 25,792 | 31,015 |
| Prince Edward Island | 6,003 | 6,106 | 989 | 56 | 2,729 | 3,877 |
| Nova Scotia | 39,077 | 42,981 | 7,465 | 25 | 15,377 | 26,756 |
| Newfoundland and Labrador | 33,514 | 23,786 | 11,853 | −68 | 19,787 | 21,855 |
| Yukon | 2,603 | 2,783 | 814 | 4 | 802 | 1,791 |
| Northwest Territories | 4,731 | 3,705 | 1,485 | 83 | 3,392 | 3,929 |
| Nunavut | 2,487 | 2,473 | 1,293 | 122 | 910 | 2,301 |
Figures may not add up precisely due to omission of the statistical discrepancy column and the "Outside Canada" row.
See also[]
- Economy of Canada
- List of Canadian provinces by unemployment rate
Notes[]
- ^ Canada, Government of Canada, Statistics. "Dictionary, Census of Population, 2016 - Market income". www12.statcan.gc.ca. Retrieved 2019-11-07.
- ^ Canada, Government of Canada, Statistics. "Gross domestic product, expenditure-based, provincial and territorial, annual". www150.statcan.gc.ca. Retrieved 2020-12-26.
- ^ Canada, Government of Canada, Statistics. "Population estimates, quarterly". www150.statcan.gc.ca. Retrieved 2020-12-26.
- ^ Canada, Government of Canada, Statistics. "Tax filers and dependants with income by source of income". www150.statcan.gc.ca. Retrieved 2021-07-16.
- ^ Canada, Government of Canada, Statistics. "Selected characteristics of tax filers and dependants, income and demographics (final T1 Family File)". www150.statcan.gc.ca. Retrieved 2021-07-16.
- ^ "World Economic Outlook Database, April 2021". www.imf.org. Retrieved 2021-05-02.
- ^ "World Economic Outlook Database, April 2021". www.imf.org. Retrieved 2021-05-02.
- ^ "Glossary". www150.statcan.gc.ca. Retrieved 2019-11-07.
- ^ "Gross domestic product (GDP) at basic prices, by industry, provinces and territories (x 1,000,000)". Government of Canada, Statistics. September 7, 2019. Retrieved September 7, 2019.
- ^ "Table 384-0038 - Gross domestic product, expenditure-based, provincial and territorial, annual (dollars unless otherwise noted), CANSIM (database)". Statistics Canada. 2012-11-26.
References[]
- Lists of provinces and territories of Canada
- Lists by economic indicators
- Lists by province or territory of Canada
- Canada economy-related lists
- Gross state product
- Ranked lists of country subdivisions