List of German states by GRP per capita
Thr gross regional product (GRP) per capita of the German states is given in this article in nominal values, shown in euros. For easy comparison, all GRP figures are converted into US dollars according to annual average exchange rates.[1][n 1] All values are rounded to the nearest hundred.

German states by nominal GRP per capita
2019[]
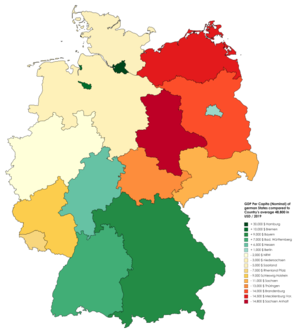
GDP Per Capita Nominal of german States compared to Country s average 48 800 in USD 2019
| State | Rank | GRP per capita | Comparable country[2] | |
|---|---|---|---|---|
| (EUR€)[3] | (US$) | |||
| — | 41,358 | 48,794 | ||
| 1 | 66,879 | 78,904 | ||
| 2 | 49,215 | 58,064 | ||
| 3 | 48,323 | 57,012 | ||
| 4 | 47,290 | 55,793 | ||
| 5 | 46,923 | 55,360 | ||
| 6 | 41,967 | 49,513 | ||
| 7 | 39,678 | 46,812 | ||
| 8 | 38,423 | 45,332 | ||
| 9 | 36,684 | 43,280 | ||
| 10 | 35,457 | 41,832 | ||
| 11 | 33,712 | 39,773 | ||
| 12 | 31,453 | 37,108 | ||
| 13 | 29,883 | 35,256 | ||
| 14 | 29,541 | 34,853 | ||
| 15 | 28,940 | 34,143 | ||
| 16 | 28,800 | 33,978 | ||
2018[]
| State | Rank | GRP per capita (EUR€)[4] | GRP per capita (US$) | Comparable country[5] |
|---|---|---|---|---|
| — | 40,900 | 48,200 | ||
| 1 | 65,600 | 77,400 | ||
| 2 | 50,400 | 59,500 | ||
| 3 | 47,900 | 56,600 | ||
| 4 | 46,700 | 55,100 | ||
| 5 | 46,300 | 54,600 | ||
| 6 | 40,600 | 47,900 | ||
| 7 | 39,400 | 46,400 | ||
| 8 | 37,100 | 43,800 | ||
| 9 | 36,600 | 43,200 | ||
| 10 | 36,200 | 42,800 | ||
| 11 | 33,600 | 39,600 | ||
| 12 | 31,000 | 36,600 | ||
| 13 | 29,700 | 35,100 | ||
| 14 | 29,400 | 34,700 | ||
| 15 | 28,700 | 33,800 | ||
| 16 | 27,900 | 33,000 |
2017[]
| State | Rank | GRP per capita (EUR€)[6] | GRP per capita (US$) | Comparable country[7] |
|---|---|---|---|---|
| — | 39,500 | 47,600 | ||
| 1 | 64,600 | 73,100 | ||
| 2 | 49,600 | 56,000 | ||
| 3 | 45,800 | 51,800 | ||
| 4 | 44,900 | 50,700 | ||
| 5 | 44,800 | 50,600 | ||
| 6 | 38,600 | 43,700 | ||
| 7 | 38,000 | 43,000 | ||
| 8 | 36,200 | 40,900 | ||
| 9 | 35,500 | 40,100 | ||
| 10 | 35,500 | 40,100 | ||
| 11 | 32,300 | 36,500 | ||
| 12 | 29,900 | 33,700 | ||
| 13 | 28,800 | 32,600 | ||
| 14 | 27,700 | 31,300 | ||
| 15 | 27,200 | 30,700 | ||
| 16 | 26,600 | 30,000 |
2016[]
| State | Rank | GRP per capita (EUR€)[8] | GRP per capita (US$) | Comparable country[9] |
|---|---|---|---|---|
| — | 38,200 | 42,300 | ||
| 1 | 61,800 | 68,400 | ||
| 2 | 47,900 | 53,000 | ||
| 3 | 44,200 | 48,900 | ||
| 4 | 43,800 | 48,500 | ||
| 4 | 43,800 | 48,500 | ||
| 6 | 37,600 | 41,600 | ||
| 7 | 36,600 | 40,500 | ||
| 8 | 35,300 | 39,100 | ||
| 9 | 34,500 | 38,200 | ||
| 10 | 33,300 | 36,800 | ||
| 11 | 31,100 | 34,400 | ||
| 12 | 29,200 | 32,300 | ||
| 13 | 28,300 | 31,300 | ||
| 14 | 27,600 | 30,500 | ||
| 15 | 26,600 | 29,400 | ||
| 16 | 25,800 | 28,500 |
See also[]
Notes[]
- ^ Euro figures are converted to US dollars rates as of 31 December of a given year.
References[]
- ^ "Yearly Average Rates & Forex History Data". OFX. Retrieved 21 May 2018.
- ^ "World Economic Outlook Database, October 2019". World Economic Outlook. International Monetary Fund. October 2019. Retrieved 1 January 2020.
- ^ https://www.statistik-bw.de/VGRdL/tbls/tab.jsp[dead link]
- ^ https://www.statistik-bw.de/VGRdL/tbls/tab.jsp?rev=RV2014&tbl=tab01&lang=de-DE#tab01[dead link]
- ^ World Economic Outlook Database, April 2019, International Monetary Fund. Accessed on 17 April 2018.
- ^ https://www.statistik-bw.de/VGRdL/tbls/tab.jsp?rev=RV2014&tbl=tab01&lang=de-DE#tab01[dead link]
- ^ World Economic Outlook Database, April 2018, International Monetary Fund. Accessed on 17 April 2018.
- ^ "Regional GDP in the European Union, 2016". ec.europa.eu. Retrieved 21 May 2018.
- ^ National Accounts Main Aggregates Database, 2016, (Select all countries, "GDP, Per Capita GDP - US Dollars", and 2016 to generate table), United Nations Statistics Division. Accessed on 26 February 2019.
Categories:
- States of Germany-related lists
- Economy of Germany by state
- Ranked lists of country subdivisions
- Gross state product