Sabangan
Sabangan | |
|---|---|
| Municipality of Sabangan | |
 Flag  Seal | |
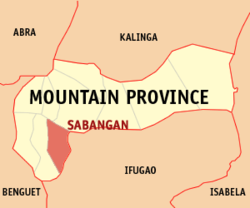 Map of Mountain Province with Sabangan highlighted | |
OpenStreetMap  | |
 Sabangan Location within the Philippines | |
| Coordinates: 16°57′N 120°55′E / 16.95°N 120.92°ECoordinates: 16°57′N 120°55′E / 16.95°N 120.92°E | |
| Country | Philippines |
| Region | Cordillera Administrative Region |
| Province | Mountain Province |
| District | Lone district |
| Barangays | 15 (see Barangays) |
| Government | |
| • Type | Sangguniang Bayan |
| • Mayor | Marcial C. Lawilao Jr. |
| • Vice Mayor | Dario P. Esden |
| • Representative | Maximo Y. Dalug Jr. |
| • Electorate | 7,834 voters (2019) |
| Area | |
| • Total | 72.04 km2 (27.81 sq mi) |
| Elevation | 1,441 m (4,728 ft) |
| Highest elevation | 2,665 m (8,743 ft) |
| Lowest elevation | 970 m (3,180 ft) |
| Population (2020 census) [3] | |
| • Total | 9,621 |
| • Density | 130/km2 (350/sq mi) |
| • Households | 2,215 |
| Economy | |
| • Income class | 5th municipal income class |
| • Poverty incidence | 19.07% (2015)[4] |
| • Revenue | ₱94,744,131.98 (2020) |
| • Assets | ₱274,977,350.75 (2020) |
| • Expenditure | ₱67,311,968.10 (2020) |
| • Liabilities | ₱86,886,008.63 (2020) |
| Service provider | |
| • Electricity | Mountain Province Electric Cooperative (MOPRECO) |
| Time zone | UTC+8 (PST) |
| ZIP code | 2622 |
| PSGC | |
| IDD : area code | +63 (0)74 |
| Native languages | Balangao Bontoc Ilocano Tagalog |
| Website | www |

Sabangan, officially the Municipality of Sabangan is a 5th class municipality in the province of Mountain Province, Philippines. According to the 2020 census, it has a population of 9,621 people. [3]
History[]
Chico River Dam Project[]
Sabangan was one of several municipalities in Mountain Province which would have been flooded by the Chico River Dam Project during the Marcos dictatorship, alongside Bauko, Bontoc, Sadanga, Sagada, and parts of Barlig.[5] However, the indigenous peoples of Kalinga Province and Mountain Province resisted the project and when hostilities resulted in the murder of Macli-ing Dulag, the project became unpopular and was abandoned before Marcos was ousted by the 1986 People Power Revolution.[6]
Barangays[]
Sabangan is politically subdivided into 15 barangays.
- Bao-angan
- Bun-ayan
- Busa
- Camatagan
- Capinitan
- Data
- Gayang
- Lagan
- Losad
- Namatec
- Napua
- Pingad
- Poblacion
- Supang
- Tambingan
Climate[]
| Climate data for Sabangan, Mountain Province | |||||||||||||
|---|---|---|---|---|---|---|---|---|---|---|---|---|---|
| Month | Jan | Feb | Mar | Apr | May | Jun | Jul | Aug | Sep | Oct | Nov | Dec | Year |
| Average high °C (°F) | 21 (70) |
23 (73) |
24 (75) |
26 (79) |
25 (77) |
25 (77) |
24 (75) |
24 (75) |
24 (75) |
24 (75) |
23 (73) |
22 (72) |
24 (75) |
| Average low °C (°F) | 15 (59) |
15 (59) |
16 (61) |
18 (64) |
19 (66) |
19 (66) |
19 (66) |
19 (66) |
19 (66) |
18 (64) |
17 (63) |
16 (61) |
18 (63) |
| Average precipitation mm (inches) | 35 (1.4) |
46 (1.8) |
63 (2.5) |
117 (4.6) |
402 (15.8) |
400 (15.7) |
441 (17.4) |
471 (18.5) |
440 (17.3) |
258 (10.2) |
94 (3.7) |
68 (2.7) |
2,835 (111.6) |
| Average rainy days | 9.9 | 19.5 | 13.9 | 18.9 | 26.0 | 27.3 | 28.9 | 28.5 | 26.1 | 19.7 | 14.5 | 12.8 | 246 |
| Source: Meteoblue [7] | |||||||||||||
Demographics[]
| Year | Pop. | ±% p.a. |
|---|---|---|
| 1903 | 49 | — |
| 1918 | 3,092 | +31.83% |
| 1939 | 4,706 | +2.02% |
| 1948 | 4,581 | −0.30% |
| 1960 | 8,900 | +5.69% |
| 1970 | 6,517 | −3.06% |
| 1975 | 7,599 | +3.13% |
| 1980 | 8,194 | +1.52% |
| 1990 | 8,083 | −0.14% |
| 1995 | 8,609 | +1.19% |
| 2000 | 8,728 | +0.29% |
| 2007 | 9,098 | +0.57% |
| 2010 | 8,741 | −1.45% |
| 2015 | 9,315 | +1.22% |
| 2020 | 9,621 | +0.64% |
| Source: Philippine Statistics Authority [8] [9] [10][11] | ||
Economy[]
| Poverty Incidence of Sabangan | |
| Source: Philippine Statistics Authority[12][13][14][15][16][17][18] | |
References[]
- ^ Municipality of Sabangan | (DILG)
- ^ "2015 Census of Population, Report No. 3 – Population, Land Area, and Population Density" (PDF). Philippine Statistics Authority. Quezon City, Philippines. August 2016. ISSN 0117-1453. Archived (PDF) from the original on May 25, 2021. Retrieved July 16, 2021.
- ^ a b Census of Population (2020). "Cordillera Administrative Region (CAR)". Total Population by Province, City, Municipality and Barangay. PSA. Retrieved 8 July 2021.
- ^ https://psa.gov.ph/sites/default/files/City%20and%20Municipal-level%20Small%20Area%20Poverty%20Estimates_%202009%2C%202012%20and%202015_0.xlsx; publication date: 10 July 2019; publisher: Philippine Statistics Authority.
- ^ "Valley of Sorrow". Asiaweek. 1980-09-05.
- ^ Doyo, Ma. Ceres P. (2015). Macli-ing Dulag: Kalinga Chief, Defender of the Cordillera. Diliman, Quezon City: University of the Philippines Press. ISBN 978971542772-2.
- ^ "Sabangan: Average Temperatures and Rainfall". Meteoblue. Retrieved 8 March 2020.
- ^ Census of Population (2015). "Cordillera Administrative Region (CAR)". Total Population by Province, City, Municipality and Barangay. PSA. Retrieved 20 June 2016.
- ^ Census of Population and Housing (2010). "Cordillera Administrative Region (CAR)". Total Population by Province, City, Municipality and Barangay. NSO. Retrieved 29 June 2016.
- ^
Censuses of Population (1903–2007). "Cordillera Administrative Region (CAR)". Table 1. Population Enumerated in Various Censuses by Province/Highly Urbanized City: 1903 to 2007. NSO.
{{cite encyclopedia}}: CS1 maint: url-status (link) - ^ "Province of Mountain Province". Municipality Population Data. Local Water Utilities Administration Research Division. Retrieved 17 December 2016.
- ^ "Poverty incidence (PI):". Philippine Statistics Authority. Retrieved 28 December 2020.
- ^ https://psa.gov.ph/sites/default/files/NSCB_LocalPovertyPhilippines_0.pdf; publication date: 29 November 2005; publisher: Philippine Statistics Authority.
- ^ https://psa.gov.ph/sites/default/files/2003%20SAE%20of%20poverty%20%28Full%20Report%29_1.pdf; publication date: 23 March 2009; publisher: Philippine Statistics Authority.
- ^ https://psa.gov.ph/sites/default/files/2006%20and%202009%20City%20and%20Municipal%20Level%20Poverty%20Estimates_0_1.pdf; publication date: 3 August 2012; publisher: Philippine Statistics Authority.
- ^ https://psa.gov.ph/sites/default/files/2012%20Municipal%20and%20City%20Level%20Poverty%20Estima7tes%20Publication%20%281%29.pdf; publication date: 31 May 2016; publisher: Philippine Statistics Authority.
- ^ https://psa.gov.ph/sites/default/files/City%20and%20Municipal-level%20Small%20Area%20Poverty%20Estimates_%202009%2C%202012%20and%202015_0.xlsx; publication date: 10 July 2019; publisher: Philippine Statistics Authority.
- ^ "PSA Releases the 2018 Municipal and City Level Poverty Estimates". Philippine Statistics Authority. 15 December 2021. Retrieved 22 January 2022.
External links[]
Places adjacent to Sabangan | ||||||||||||||||
|---|---|---|---|---|---|---|---|---|---|---|---|---|---|---|---|---|
| ||||||||||||||||
Bontoc (capital) | |
| Municipalities | |
| Barangays | |
This article about a location in the Cordillera Administrative Region is a stub. You can help Wikipedia by . |
- Municipalities of Mountain Province
- Populated places on the Rio Chico de Cagayan
- Philippines geography stubs