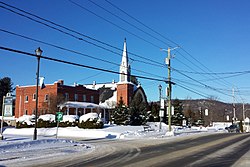
Saint-Hippolyte, Quebec
Saint-Hippolyte | |
|---|---|
Municipality | |
 | |
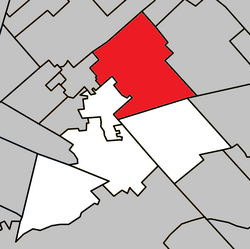 Location within La Rivière-du-Nord RCM | |
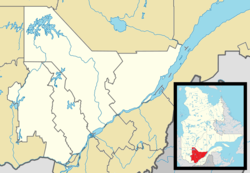 Saint-Hippolyte Location in central Quebec | |
| Coordinates: 45°56′N 74°01′W / 45.93°N 74.02°WCoordinates: 45°56′N 74°01′W / 45.93°N 74.02°W[1] | |
| Country | |
| Province | |
| Region | Laurentides |
| RCM | La Rivière-du-Nord |
| Constituted | July 1, 1855 |
| Government | |
| • Mayor | Bruno Laroche |
| • Federal riding | Rivière-du-Nord |
| • Prov. riding | Rousseau |
| Area | |
| • Total | 132.60 km2 (51.20 sq mi) |
| • Land | 120.65 km2 (46.58 sq mi) |
| Population | |
| • Total | 8,083 |
| • Density | 67.0/km2 (174/sq mi) |
| • Pop 2006-2011 | |
| Time zone | UTC−5 (EST) |
| • Summer (DST) | UTC−4 (EDT) |
| Postal code(s) | J8A 1A1 |
| Area code(s) | 450 and 579 |
| Highways | |
| Website | saint-hippolyte |

Saint-Hippolyte is a municipality within La Rivière-du-Nord Regional County Municipality in the Laurentides region of Quebec, Canada, in the Laurentian mountains about 45 km north of Montreal. The name comes from Saint Hippolytus.
Part of the town was formerly known as Abercrombie-Est.
Police services are provided by the Régie intermunicipale de police de la Rivière-du-Nord, which also serves Piedmont, Prévost and some other communities in the Laurentians.
Demographics[]
Population trend:[4]
- Population in 2011: 8083 (2006 to 2011 population change: 12.0%)
- Population in 2006: 7219
- Population in 2001: 6039
- Population in 1996: 5672
- Population in 1991: 4697
Private dwellings occupied by usual residents: 3,558 (total dwellings: 4,784)
Mother tongue:
- French as first language: 92.6%
- English as first language: 4.7%
- English and French as first language: 1%
- Other as first language: 1.7%

Climate[]
St Hippolyte has a warm-summer humid continental climate (Köppen climate classification: Dfb) with long, very cold winters, and short, mild summers.[5] Days with temperatures below 0 °C (32 °F) all day are very frequent from November to March, with an average 95.7 days per year. Days with maximum temperatures over 30 °C (86 °F) are not infrequent during summer, with an average of 3.3 days per year. The highest temperature on record in St Hippolyte is 36.1 °C (97.0 °F) set on 1 August 1975 and the lowest is −41.7 °C (−43.1 °F) set on 23 February 1972. [6]
Precipitation is heavy throughout the year. Heavy snow is commonplace throughout the winter, with heavy rain in the summer. The highest daily rainfall on record is 101.1 millimetres (3.98 in) on 1 July 1979 and the record daily snowfall is 50.8 centimetres (20.0 in) on 3 February 1972, with the greatest measured snow depth being 150 centimetres (59 in) on 9 March 2008. On average, 1 centimetre (0.39 in) of snow will be lying on 154.1 days per year, with a significant accumulation of over 20 centimetres (7.9 in) lying on an average of 119.1 days per year. On average, 0.2 millimetres (0.0079 in) of rain falls on 179.0 days per year, with 25 millimetres (0.98 in) falling on 6.7 days. Days of snowfall greater than 5 centimetres (2.0 in) average at 20.3 days per year with days of snowfall greater than 25 centimetres (9.8 in) average 0.79 days per year. In March, the average snow depth is 72 centimetres (28 in).[7]
The average frost-free period is short, averaging only 138 days per year. The last frost, on average, occurs on 15 May and the first frost of the new season occurs on 30 September.[8]
| hide | |||||||||||||
|---|---|---|---|---|---|---|---|---|---|---|---|---|---|
| Month | Jan | Feb | Mar | Apr | May | Jun | Jul | Aug | Sep | Oct | Nov | Dec | Year |
| Record high °C (°F) | 10.0 (50.0) |
12.5 (54.5) |
24.0 (75.2) |
29.5 (85.1) |
33.7 (92.7) |
34.0 (93.2) |
35.0 (95.0) |
36.1 (97.0) |
33.5 (92.3) |
26.1 (79.0) |
19.0 (66.2) |
13.0 (55.4) |
36.1 (97.0) |
| Average high °C (°F) | −7.1 (19.2) |
−4.3 (24.3) |
1.3 (34.3) |
9.1 (48.4) |
17.2 (63.0) |
22.1 (71.8) |
24.3 (75.7) |
23.2 (73.8) |
18.1 (64.6) |
10.4 (50.7) |
3.0 (37.4) |
−4.0 (24.8) |
9.4 (49.0) |
| Daily mean °C (°F) | −12.5 (9.5) |
−10.4 (13.3) |
−4.5 (23.9) |
3.7 (38.7) |
11.5 (52.7) |
16.6 (61.9) |
19.0 (66.2) |
17.9 (64.2) |
13.2 (55.8) |
6.2 (43.2) |
−0.6 (30.9) |
−8.6 (16.5) |
4.3 (39.7) |
| Average low °C (°F) | −17.9 (−0.2) |
−16.4 (2.5) |
−10.4 (13.3) |
−1.7 (28.9) |
5.6 (42.1) |
11.1 (52.0) |
13.6 (56.5) |
12.6 (54.7) |
8.2 (46.8) |
1.9 (35.4) |
−4.2 (24.4) |
−13.1 (8.4) |
−0.9 (30.4) |
| Record low °C (°F) | −40.0 (−40.0) |
−41.7 (−43.1) |
−33.3 (−27.9) |
−22.2 (−8.0) |
−6.7 (19.9) |
−0.6 (30.9) |
3.9 (39.0) |
1.1 (34.0) |
−5.0 (23.0) |
−9.0 (15.8) |
−25.6 (−14.1) |
−36.5 (−33.7) |
−41.7 (−43.1) |
| Average precipitation mm (inches) | 90.3 (3.56) |
71.3 (2.81) |
79.7 (3.14) |
91.9 (3.62) |
98.9 (3.89) |
121.9 (4.80) |
105.9 (4.17) |
101.0 (3.98) |
109.6 (4.31) |
109.8 (4.32) |
108.6 (4.28) |
104.0 (4.09) |
1,192.9 (46.97) |
| Average rainfall mm (inches) | 22.2 (0.87) |
16.9 (0.67) |
33.5 (1.32) |
77.0 (3.03) |
97.8 (3.85) |
121.9 (4.80) |
105.9 (4.17) |
101.0 (3.98) |
109.5 (4.31) |
104.3 (4.11) |
80.0 (3.15) |
31.6 (1.24) |
901.6 (35.5) |
| Average snowfall cm (inches) | 68.1 (26.8) |
54.4 (21.4) |
46.2 (18.2) |
15.0 (5.9) |
1.1 (0.4) |
0.0 (0.0) |
0.0 (0.0) |
0.0 (0.0) |
0.1 (0.0) |
5.5 (2.2) |
28.6 (11.3) |
72.5 (28.5) |
291.5 (114.7) |
| Average precipitation days (≥ 0.2 mm) | 17.6 | 13.4 | 12.6 | 13.0 | 14.7 | 16.1 | 14.8 | 14.0 | 13.9 | 15.4 | 16.0 | 17.6 | 179.1 |
| Average rainy days (≥ 0.2 mm) | 2.5 | 2.3 | 5.2 | 10.9 | 14.7 | 16.1 | 14.8 | 14.0 | 13.9 | 14.7 | 9.6 | 3.6 | 122.3 |
| Average snowy days (≥ 0.2 cm) | 16.8 | 12.2 | 8.9 | 3.7 | 0.3 | 0.0 | 0.0 | 0.0 | 0.03 | 1.5 | 8.5 | 15.1 | 67.03 |
| Source: Environment Canada[9] | |||||||||||||
Education[]
The Commission scolaire de la Rivière-du-Nord operates French-language public schools.[10]
- École primaire des Hauteurs
- The primary school École des Hautbois in Saint-Colomban, Jean-Moreau in Sainte-Sophie and Sacré-Coeur in Saint-Jérôme serve sections
- École secondaire Cap-Jeunesse and École secondaire des Hauts-Sommets in Saint-Jérôme
Sir Wilfrid Laurier School Board operates English-language public schools. Schools serving the town:
- Morin Heights Elementary School in Morin-Heights serves a portion of the town[11]
- Laurentia Elementary School in Saint-Jérôme serves a portion of the town[12]
- Ste-Adèle Elementary School in Saint-Adèle serves a portion of the town[13]
- Laurentian Regional High School in Lachute[14]
References[]
- ^ Reference number 56730 of the Commission de toponymie du Québec (in French)
- ^ Jump up to: a b Geographic code 75045 in the official Répertoire des municipalités (in French)
- ^ Jump up to: a b "(Code 2475045) Census Profile". 2011 census. Statistics Canada. 2012.
- ^ Statistics Canada: 1996, 2001, 2006, 2011 census
- ^ "Climatic Regions [Köppen]". Atlas of Canada. Natural Resources Canada. June 2003. Archived from the original on March 16, 2014. Retrieved December 8, 2020.
- ^ "Canadian Climate Normals 1981-2010 Station Data". Government of Canada. Retrieved December 7, 2020.
- ^ "Canadian Climate Normals 1981-2010 Station Data". Government of Canada. Retrieved December 7, 2020.
- ^ "Canadian Climate Normals 1981-2010 Station Data". Government of Canada. Retrieved December 7, 2020.
- ^ "Canadian Climate Normals 1981-2010 Station Data". Government of Canada. Retrieved December 7, 2020.
- ^ "Trouver une école ou un centre." Commission scolaire de la Rivière-du-Nord. Retrieved on September 24, 2017. For attendance boundary information, click "Par bassin d'école"
- ^ "MORIN HEIGHTS ELEMENTARY ZONE." Sir Wilfrid Laurier School Board. Retrieved on September 16, 2017.
- ^ "LAURENTIA ELEMENTARY ZONE." Sir Wilfrid Laurier School Board. Retrieved on September 4, 2017.
- ^ "maps zone/171 - WEB SAINTE ADELE.pdf SAINTE ADÈLE ELEMENTARY ZONE." Sir Wilfrid Laurier School Board. Retrieved on September 16, 2017.
- ^ "LAURENTIAN REGIONAL HS ZONE." Sir Wilfrid Laurier School Board. Retrieved on September 4, 2017.
External links[]
 Media related to Saint-Hippolyte, Quebec at Wikimedia Commons
| show Places adjacent to Saint-Hippolyte, Quebec |
|---|
| hide | |
|---|---|
| Towns | |
| Municipalities | |
| |
| show Authority control |
|---|
- Municipalities in Quebec
- Incorporated places in Laurentides