San Leonardo, Nueva Ecija
San Leonardo | |
|---|---|
| Municipality of San Leonardo | |
 Welcome arch | |
 Seal | |
 Map of Nueva Ecija with San Leonardo highlighted | |
OpenStreetMap  | |
 San Leonardo Location within the Philippines | |
| Coordinates: 15°22′N 120°58′E / 15.37°N 120.97°ECoordinates: 15°22′N 120°58′E / 15.37°N 120.97°E | |
| Country | Philippines |
| Region | Central Luzon |
| Province | Nueva Ecija |
| District | 4th district |
| Barangays | 15 (see Barangays) |
| Government | |
| • Type | Sangguniang Bayan |
| • Mayor | Froilan A. Nagaño |
| • Vice Mayor | Joel C. Nagaño |
| • Representative | Maricel Natividad-Nagaño |
| • Municipal Council | Members |
| • Electorate | 41,378 voters (2019) |
| Area | |
| • Total | 151.90 km2 (58.65 sq mi) |
| Elevation | 29 m (95 ft) |
| Highest elevation | 51 m (167 ft) |
| Lowest elevation | 18 m (59 ft) |
| Population (2020 census) [3] | |
| • Total | 68,536 |
| • Density | 450/km2 (1,200/sq mi) |
| • Households | 14,690 |
| Economy | |
| • Income class | 1st municipal income class |
| • Poverty incidence | 15.84% (2015)[4] |
| • Revenue | ₱345,870,844.05 (2020) |
| • Assets | ₱552,865,138.73 (2020) |
| • Expenditure | ₱286,411,973.29 (2020) |
| • Liabilities | ₱277,475,626.54 (2020) |
| Service provider | |
| • Electricity | Nueva Ecija 2 Area 2 Electric Cooperative (NEECO 2 A2) |
| Time zone | UTC+8 (PST) |
| ZIP code | 3102 |
| PSGC | |
| IDD : area code | +63 (0)44 |
| Native languages | Tagalog Ilocano |
| Website | www |
San Leonardo, officially the Municipality of San Leonardo (Tagalog: Bayan ng San Leonardo), is a 1st class municipality in the province of Nueva Ecija, Philippines. According to the 2020 census, it has a population of 68,536 people. [3]
San Leonardo is located between Gapan City and Santa Rosa along the Maharlika Highway. It is 103 kilometres (64 mi) from Manila. The area has a farming economy. San Leonardo has vast rice fields and land for growing vegetables and poultry products.
History[]
During World War II, Japanese Occupation forces entered San Leonardo, Nueva Ecija on 1942 during the Japanese Invasion and Occupation. Novo Ecijano and Hukbalahap Communist guerrilla resistance groups from 1942 to 1944 in San Leonardo, Nueva Ecija for the sieges and invasions to attack the Japanese Imperial forces was found retreated and before the liberation on 1945 from the Allied troops.
On January to April 1945, the joint and combined military force of Filipino soldiers and officers under the Philippine Commonwealth Army and Philippine Constabulary units and the American soldiers and officers under the United States Army units recaptured and liberated the town municipality of San Leonardo, Nueva Ecija. The joint forces assisted the Novo Ecijano and Hukbalahap Communist resistance groups and defeat the Japanese soldiers and officers under the Imperial Japanese Armed Forces and the Makapili soldiers and begins the Battle of San Leonardo and the Battle of Gapan between the Japanese and the combined American and Philippine Commonwealth troops on January to April 1945 and ended World War II.
Barangays[]
San Leonardo is politically subdivided into 15 barangays.
- Bonifacio (Población)
- Burgos (Población)
- Castellano
- Diversion
- Magpapalayoc
- Mallorca
- Mambangnan
- Nieves
- Rizal (Población)
- San Anton
- San Bartolomé (Población)
- San Roque
- Tabuating
- Tagumpay
- Tambo-Adorable
Climate[]
| Climate data for San Leonardo, Nueva Ecija | |||||||||||||
|---|---|---|---|---|---|---|---|---|---|---|---|---|---|
| Month | Jan | Feb | Mar | Apr | May | Jun | Jul | Aug | Sep | Oct | Nov | Dec | Year |
| Average high °C (°F) | 28 (82) |
30 (86) |
31 (88) |
33 (91) |
33 (91) |
31 (88) |
30 (86) |
29 (84) |
29 (84) |
30 (86) |
30 (86) |
29 (84) |
30 (86) |
| Average low °C (°F) | 20 (68) |
20 (68) |
20 (68) |
22 (72) |
24 (75) |
24 (75) |
24 (75) |
24 (75) |
24 (75) |
23 (73) |
22 (72) |
21 (70) |
22 (72) |
| Average precipitation mm (inches) | 4 (0.2) |
4 (0.2) |
5 (0.2) |
11 (0.4) |
66 (2.6) |
99 (3.9) |
127 (5.0) |
113 (4.4) |
99 (3.9) |
84 (3.3) |
35 (1.4) |
14 (0.6) |
661 (26.1) |
| Average rainy days | 2.2 | 1.9 | 3.2 | 5.3 | 16.1 | 20.8 | 23.5 | 22.8 | 22.2 | 16.5 | 8.9 | 3.5 | 146.9 |
| Source: Meteoblue [5] | |||||||||||||
Demographics[]
|
| |||||||||||||||||||||||||||||||||||||||||||||||||||
| Source: Philippine Statistics Authority [6] [7] [8][9] | ||||||||||||||||||||||||||||||||||||||||||||||||||||
Religion[]
Majority of populace is Roman Catholic. Other religious groups have churches and places of worship in the municipality.
- St. Bartholomew the Apostle Parish Church
- Bethel United Methodist Church
- Magpapalayok Catholic Church
- Saint John Marie Vianney Parish
- St. Jude Thaddeus of Nueva Ecija
- Church Of Christ Locale Of Castellano
- Iglesia Ni Cristo - Lokal ng San Leonardo
- Iglesia Ni Cristo Lokal ng Nieves
- Jesus Christ to God be the Glory Church International
- Leap of Faith Christian Church
- United Pentecostal Church -San Leonardo
- Victory Churches of Asia Incorporated
Economy[]
| Poverty Incidence of San Leonardo | |
| Source: Philippine Statistics Authority[10][11][12][13][14][15] | |

Primarily depends on rice cultivation, vegetable production, poultry, piggery & commercial fishery.
Education[]
Public elementary schools[]
- C.I. Villaroman ES (Formerly Magpapalayok Elementary School)
- Castellano Elementary School
- Mallorca Elementary School
- Mambangnan Elementary School
- Nieves Elementary School
- San Anton Elementary School
- San Leonardo Central School
- San Roque Elementary School
- Tagumpay Elementary School
- Tambo North Elementary School
- Tambo South Elementary School
Public high schools[]
- Magpapalayok National High School
- Mallorca National High School
- Mambangnan High School
- San Anton National High School
- Tagumpay Nagaño High School
Tertiary[]
- Nueva Ecija University of Science and Technology - San Leonardo Campus
Private schools[]
- Akarui Technical School Foundation
- Clever Lane Montessori School
- Dr. Gloria D. Lacson Foundation Colleges
- L.F. Gonzales College of Science & Technology, Inc (LFGCSTI)
- La Salle Tech Academy
- San Leonardo Academy
- San Lorenzo Ruiz Diocesan Academy
- Seraphin Learning Center
- Trinity Christian School (TCS)
Health services[]
Hospitals and clinics can be found for their check up and treatment.
- Gonzales General Hospital
- Dr. Gloria D. Lacson General Hospital
- Nueva Ecija Medical Center
Images[]
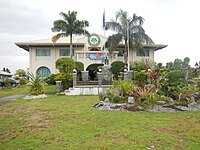
Town hall

Municipal covered courts

St. Bartholomew the Apostle Church

Public market

Biggest gymnasium in Nueva Ecija


References[]
- ^ Municipality of San Leonardo | (DILG)
- ^ "2015 Census of Population, Report No. 3 – Population, Land Area, and Population Density" (PDF). Philippine Statistics Authority. Quezon City, Philippines. August 2016. ISSN 0117-1453. Archived (PDF) from the original on May 25, 2021. Retrieved July 16, 2021.
- ^ a b Census of Population (2020). "Region III (Central Luzon)". Total Population by Province, City, Municipality and Barangay. PSA. Retrieved 8 July 2021.
- ^ https://psa.gov.ph/sites/default/files/City%20and%20Municipal-level%20Small%20Area%20Poverty%20Estimates_%202009%2C%202012%20and%202015_0.xlsx; publication date: 10 July 2019; publisher: Philippine Statistics Authority.
- ^ "San Leonardo: Average Temperatures and Rainfall". Meteoblue. Retrieved 4 May 2020.
- ^ Census of Population (2015). "Region III (Central Luzon)". Total Population by Province, City, Municipality and Barangay. PSA. Retrieved 20 June 2016.
- ^ Census of Population and Housing (2010). "Region III (Central Luzon)". Total Population by Province, City, Municipality and Barangay. NSO. Retrieved 29 June 2016.
- ^ Censuses of Population (1903–2007). "Region III (Central Luzon)". Table 1. Population Enumerated in Various Censuses by Province/Highly Urbanized City: 1903 to 2007. NSO.
- ^ "Province of Nueva Ecija". Municipality Population Data. Local Water Utilities Administration Research Division. Retrieved 17 December 2016.
- ^ "Poverty incidence (PI):". Philippine Statistics Authority. Retrieved 28 December 2020.
- ^ https://psa.gov.ph/sites/default/files/NSCB_LocalPovertyPhilippines_0.pdf; publication date: 29 November 2005; publisher: Philippine Statistics Authority.
- ^ https://psa.gov.ph/sites/default/files/2003%20SAE%20of%20poverty%20%28Full%20Report%29_1.pdf; publication date: 23 March 2009; publisher: Philippine Statistics Authority.
- ^ https://psa.gov.ph/sites/default/files/2006%20and%202009%20City%20and%20Municipal%20Level%20Poverty%20Estimates_0_1.pdf; publication date: 3 August 2012; publisher: Philippine Statistics Authority.
- ^ https://psa.gov.ph/sites/default/files/2012%20Municipal%20and%20City%20Level%20Poverty%20Estima7tes%20Publication%20%281%29.pdf; publication date: 31 May 2016; publisher: Philippine Statistics Authority.
- ^ https://psa.gov.ph/sites/default/files/City%20and%20Municipal-level%20Small%20Area%20Poverty%20Estimates_%202009%2C%202012%20and%202015_0.xlsx; publication date: 10 July 2019; publisher: Philippine Statistics Authority.
External links[]
| Wikimedia Commons has media related to San Leonardo, Nueva Ecija. |
- San Leonardo Profile at PhilAtlas.com
- The Official Website of San Leonardo, Nueva Ecija
- Philippine Standard Geographic Code
- Philippine Census Information
- Local Governance Performance Management System
Places adjacent to San Leonardo, Nueva Ecija | ||||||||||||||||
|---|---|---|---|---|---|---|---|---|---|---|---|---|---|---|---|---|
| ||||||||||||||||
Palayan (capital) | |
| Municipalities | |
| Component cities | |
- Municipalities of Nueva Ecija
- Populated places on the Pampanga River