Timeline of the 1999 Atlantic hurricane season

The 1999 Atlantic hurricane season was an event in the annual tropical cyclone season in the north Atlantic Ocean. This Atlantic hurricane season saw a near-average number of named tropical storms,[1][nb 1] though five of them became dangerous hurricanes of Category 4 intensity on the 5-level Saffir–Simpson scale, the most in a single season since 1886.[3] The season officially began on June 1, 1999 and ended on November 30, 1999. These dates, adopted by convention, historically describe the period in each year when most tropical systems form.[4] This season's first storm, Tropical Storm Arlene, formed on June 11, while the last, Hurricane Lenny, dissipated on November 23.
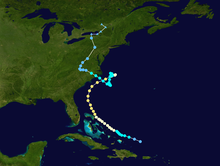
Altogether, 12 tropical storms formed during the season, including eight hurricanes of which five intensified into major hurricanes.[1][nb 2] There were also four tropical depressions that did not reach tropical storm strength.[3] The most significant hurricane of the season was Hurricane Floyd, which caused devastating flooding along the East Coast of the United States,[1] especially in North Carolina, which had been hit only ten days earlier by Hurricane Dennis.[6] Another strong hurricane, Hurricane Lenny became the strongest November Atlantic hurricane on record, and maintained a west-to-east track through the Caribbean for nearly its entire duration. Because of its unusual path, it developed the nickname "Wrong Way Lenny."[7] The deadliest tropical cyclone of the season was Tropical Depression Eleven, whose heavy rain and resultant flooding caused 400 deaths in Mexico.[3] Following the 1999 season, the names Floyd and Lenny were retired from reuse in the North Atlantic by the World Meteorological Organization.[8]
This timeline documents tropical cyclone formations, strengthening, weakening, landfalls, extratropical transitions, and dissipations during the season. It includes information that was not released throughout the season, meaning that data from post-storm reviews by the National Hurricane Center, such as a storm that was not initially warned upon, has been included.
By convention, meteorologists use one time zone when issuing forecasts and making observations: Coordinated Universal Time (UTC), and also use the 24-hour clock (where 00:00 = midnight UTC).[9] In this time line, all information is listed by UTC first with the respective local time included in parentheses.
Timeline[]

June[]
June 1
- The 1999 Atlantic hurricane season officially begins.[4]
June 11
- 18:00 UTC (2:00 p.m. AST) – Tropical Depression One forms about 535 mi (860 km) southeast of Bermuda.[10]
June 12
- 15:00 UTC (11:00 a.m. AST) – Tropical Depression One strengthens into Tropical Storm Arlene about 510 mi (820 km) southeast of Bermuda.[11]

June 13
- 06:000 UTC (2:00 a.m. AST) – Tropical Storm Arlene attains its peak intensity with sustained winds of 50 knots (93 km/h; 58 mph) 60 mph (95 km/h) and a barometric pressure of 1006 mbar (hPa; 29.71 inHg).[nb 3][10]
June 17
- 00:00 UTC (8:00 p.m. AST, June 16) – Tropical Storm Arlene weakens to a tropical depression east-southeast of Bermuda.[10]
- 06:00 UTC (2:00 a.m. AST) – Tropical Depression Arlene makes its closest approach to land at about 120 miles (190 km) east of Bermuda.[10]
June 18
- 00:00 UTC (8:00 p.m. AST, June 17) – Tropical Depression Arlene dissipates northeast of Bermuda.[10]
July[]
July 2
- 18:00 UTC (1:00 p.m. CDT) – Tropical Depression Two forms in the western Bay of Campeche.[12]
July 3
- 04:00 UTC (11:00 p.m. CDT, July 2) – Tropical Depression Two makes landfall about 40 mi (65 km) south-southeast of Tuxpan, Veracruz with sustained winds of 35 mph (55 km/h).[12]
- 12:00 UTC (7:00 a.m. CDT) – Tropical Depression Two dissipates over the Sierra Madre Oriental.[12]
August[]
August 18
- 18:00 UTC (1:00 p.m. CDT) – Tropical Depression Three forms in the Bay of Campeche.[13]
August 19
- 00:00 UTC (8:00 p.m. AST, August 18) – Tropical Depression Four forms about 250 nautical miles (460 km; 290 mi) 155 miles (250 km) east-southeast of the Cape Verde Islands.[14]
- 18:00 UTC (1:00 p.m. CDT) – Tropical Depression Three strengthens into Tropical Storm Bret southeast of Tampico, Tamaulipas.[13]
August 20
- 1:00 pm EDT (1800 UTC) - Tropical Depression Four strengthens into Tropical Storm Cindy.[14]
August 21
- 00:00 UTC (7:00 p.m. CDT, August 20) – Tropical Storm Bret reaches hurricane strength[13] about 225 miles (362 km) east of Tampico.[15]
- 18:00 UTC (1:00 p.m. CDT) – Hurricane Bret strengthens to a Category 2 hurricane.[13]
- 23:00 UTC (6:00 p.m. CDT) – Hurricane Bret strengthens to a Category 3 hurricane about 175 miles (282 km) southeast of Brownsville, Texas.[16]
August 22
- 00:00 UTC (7:00 p.m. CDT, August 21) – Hurricane Bret rapidly strengthens to a Category 4 hurricane.[13]
- 00:00 UTC (8:00 p.m. AST, August 21) – Tropical Storm Cindy reaches hurricane strength about 450 mi (720 km) west of the Cape Verde Islands.[14]
- 12:00 UTC (7:00 a.m. CDT) – Hurricane Bret attains its peak intensity with winds of 145 mph (230 km/h) and a minimum pressure of 944 mbar (hPa; 27.88 inHg).[13]
- 18:00 UTC (1:00 p.m. AST) – Hurricane Cindy weakens to a tropical storm.[14]
August 23
- 00:00 UTC (7:00 p.m. CDT, August 22) – Hurricane Bret makes landfall on central Padre Island, Texas as a Category 3 hurricane with winds of 115 mph (185 km/h).[13]
- 13:00 UTC (8:00 a.m. CDT) – Hurricane Bret weakens to a tropical storm about 40 mi (65 km) south-southwest of Alice, Texas.[17]
August 24
- 00:00 UTC (7:00 p.m. CDT, August 23) – Tropical Storm Bret weakens to a tropical depression north of Laredo, Texas and later dissipates in the mountains of northern Mexico.[13]
- 00:00 UTC (8:00 p.m. AST, August 23) – Tropical Depression Five forms about 220 mi (350 km) east of Turks Island.[18]
- 06:00 UTC (2:00 a.m. AST) – Tropical Depression Five strengthens into Tropical Storm Dennis east of Turks Island.[18]
- 06:00 UTC (2:00 a.m. AST) – Tropical Depression Six forms about 410 mi (670 km) east of the southern Windward Islands.[19]
- 12:00 UTC (8:00 a.m. AST) – Tropical Depression Six strengthens into Tropical Storm Emily.[19]
- 18:00 UTC (2:00 p.m. AST) – Tropical Storm Emily attains its peak intensity east of the Windward Islands with winds of 50 mph (85 km/h) and a minimum pressure of 1004 mbar (hPa; 29.65 inHg).[19]
August 26
- 00:00 UTC (8:00 p.m. AST, August 25) – Tropical Storm Cindy re-strengthens into a hurricane about 1,300 mi (2,000 km) southeast of Bermuda.[14]
- 06:00 UTC (2:00 a.m. AM AST) – Tropical Storm Dennis strengthens to hurricane strength about 290 mi (465 km) east-southeast of Nassau, Bahamas.[20]
August 27
- 12:00 UTC (8:00 a.m. AST) – Hurricane Cindy strengthens to a Category 2 hurricane east-southeast of Bermuda.[14]

August 28
- 00:00 UTC (8:00 p.m. AST, August 27) – Hurricane Cindy strengthens to a Category 3 hurricane.[14]
- 06:00 UTC (2:00 a.m. AST) – Hurricane Cindy strengthens to a category 4 hurricane.[14]
- 07:00 UTC (3:00 a.m. EDT) – Hurricane Dennis moves through the Abaco Islands in the Bahamas with winds of 85 mph (140 km/h) and makes landfall on some on the islands.[18]
- 12:00 UTC (8:00 a.m. AST) – Hurricane Cindy attains its peak intensity east-southeast of Bermuda with winds of 140 mph (220 km/h) and a minimum pressure of 942 mbar (hPa; 27.82 inHg).[14]
- 12:00 UTC (8:00 a.m. EDT – Hurricane Dennis strengthens to a Category 2 hurricane about 25 mi (40 km) northeast of Great Abaco Island.[21]
- 12:00 UTC (8:00 a.m. AST) – Tropical Storm Emily weakens to a tropical depression 770 mi (1,240 km) southeast of Bermuda, and is later absorbed by the much larger circulation of Hurricane Cindy.[19]
August 29
- 12:00 UTC (8:00 a.m. AST) – Hurricane Cindy weakens to a Category 3 hurricane east of Bermuda.[14]
- 18:00 UTC (2:00 p.m. AST) – Hurricane Cindy weakens to a Category 2 hurricane east of Bermuda.[14]
August 30
- 06:00 UTC (2:00 a.m. EDT) – Hurricane Dennis attains its peak intensity about 115 mi (185 km) south of Wilmington, North Carolina with winds of 105 mph (165 km/h) and a minimum pressure of 962 mbar (hPa; 28.41 inHg).[18]
- 12:00 UTC (8:00 a.m. AST) – Hurricane Cindy weakens to a Category 1 hurricane west-southwest of the Azores.[14]
August 31
- 00:00 UTC (8:00 p.m. EDT, August 30) – Hurricane Dennis weakens to a Category 1 hurricane about 120 mi (190 km) east of Cape Hatteras, North Carolina.[22]
- 06:00 UTC (2:00 a.m. AST) – Hurricane Cindy weakens to a tropical storm.[14]
- 18:00 UTC (2:00 p.m. AST) – Tropical Storm Cindy is absorbed by an extratropical low about 980 mi (1,570 km) west of the Azores..[14]
September[]
September 1
- 00:00 UTC (8:00 p.m. EDT, August 31) – Hurricane Dennis weakens to a tropical storm[18] about 110 miles (180 km) east of Cape Hatteras.[23]
September 4
- 21:00 UTC (5:00 p.m. EDT) – Tropical Storm Dennis made landfall over the Cape Lookout National Seashore just east of Harkers Island, North Carolina with winds of 70 mph (110 km/h).[18]
September 5
- 09:00 UTC (5:00 a.m. EDT) – Tropical Storm Dennis weakens to a tropical depression about 20 mi (32 km) southwest of Rocky Mount, North Carolina.[24]
- 18:00 UTC (1:00 p.m. CDT) – Tropical Depression Seven forms in the western Gulf of Mexico southeast of Tampico, Tamaulipas.[25]
September 6
- 00:00 UTC (7:00 p.m. CDT, September 5) – Tropical Depression Seven attains its peak intensity with winds of 35 mph (55 km/h) and a minimum pressure of 1006 mbar (hPa; 29.71 inHg).[25]
- 12:00 UTC (7:00 a.m. CDT) – Tropical Depression Seven makes landfall south of La Pesca, Tamaulipas with winds of 35 mph (55 km/h) and later dissipates over northern Mexico.[25]
September 7
- 17:00 UTC (1:00 p.m. EDT) – Tropical Depression Dennis becomes extratropical over the southern shore of Lake Ontario near Hilton, New York, and is subsequently absorbed into a larger extratropical low.[18][26]
- 18:00 UTC (1:00 p.m. AST) – Tropical Depression Eight forms 1,000 mi (1,600 km) east of the Lesser Antilles.[27]
September 8
- 06:00 UTC (2:00 a.m. AST) – Tropical Depression Eight strengthens into Tropical Storm Floyd about 860 mi (1,390 km) east of the Leeward Islands.[27]
September 10
- 12:00 UTC (8:00 a.m. AST) – Tropical Storm Floyd reaches hurricane strength about 210 mi (340 km) east-northeast of Barbuda in the Northern Leeward Islands.[28]
September 11
- 06:00 UTC (2:00 a.m. AST) – Hurricane Floyd strengthens to a Category 2 hurricane well to the northeast of the Leeward Islands.[27]
- 15:00 UTC (11:00 a.m. AST) – Tropical Depression Nine forms about south of the Cape Verde Islands.[29]
September 12
- 12:00 UTC (8:00 a.m. AST) – Hurricane Floyd strengthens to a Category 3 hurricane about 365 mi (585 km) east of the Turks Islands.[30]
- 12:00 UTC (8:00 a.m. AST) – Tropical Depression Nine strengthens into Tropical Storm Gert roughly 470 mi (760 km) west of the Cape Verde Islands.[29]
- 18:00 UTC (2:00 p.m. AST) – Hurricane Floyd strengthens to a category 4 hurricane about 265 mi (425 km) east-northeast of Grand Turk Island.[31]
September 13
- 12:00 UTC (8:00 a.m. AST) – Hurricane Floyd attained its peak intensity about 195 mi (315 km) east of San Salvador Island, Bahamas, with sustained winds of near 155 mph (250 km/h) and a minimum pressure of 921 mbar (hPa; 27.20 inHg).[32]
- 12:00 UTC (8:00 a.m. AST) – Tropical Storm Gert reaches hurricane strength in the central Atlantic.[29]

September 14
- 06:00 UTC (2:00 a.m. EDT) – Hurricane Floyd weakens to a Category 3 hurricane[27] about 55 mi (85 km) east of Eleuthera Island, Bahamas.[33]
- 06:00 UTC (2:00 a.m. AST) – Hurricane Gert strengthens to a Category 2 hurricane in the central Atlantic.[29]
- 12:00 UTC (8:00 a.m. EDT) – Hurricane Floyd makes landfall on Eleuthera Island, Bahamas with winds of 120 mph (190 km/h) .[27]
- 18:00 UTC (2:00 a.m. EDT) – Hurricane Floyd re-strengthens to a borderline Category 3 / 4 hurricane[27]
- 19:00 UTC (3:00 p.m. EDT) – Hurricane Floyd makes landfall on Great Abaco Island, Bahamas, with winds of 140 mph (220 km/h).[27]
September 15
- 00:00 UTC (8:00 p.m. AST, September 14) – Hurricane Gert strengthens to a Category 3 hurricane well east of the Lesser Antilles.[29]
- 12:00 UTC (8:00 a.m. AST) – Hurricane Gert strengthens to a Category 4 hurricane.[29]
- 18:00 UTC (2:00 a.m. EDT) – Hurricane Floyd weakens to a Category 2 hurricane east of Jacksonville, Florida.[27]

September 16
- 00:00 UTC (8:00 p.m. AST, September 15) – Hurricane Gert attains its peak intensity with winds of 150 mph (240 km/h) and a minimum pressure of 930 mbar (hPa; 27.46 inHg).[29]
- 06:30 UTC (2:30 a.m. EDT) – Hurricane Floyd makes landfall near Cape Fear, North Carolina with winds of 105 mph (169 km/h).[27]
- 12:00 UTC (8:00 a.m. EDT) – Hurricane Floyd weakens to a Category 1 hurricane roughly 15 mi (24 km) northeast of Washington, North Carolina.[27]
- 18:00 UTC (2:00 p.m. EDT) – Hurricane Floyd weakens to a tropical storm near the coast just north of Chincoteague, Virginia.[27]
September 17
- 09:00 UTC (5:00 a.m. EDT) – Tropical Storm Floyd transitions to an extratropical low about 25 mi (40 km) west-southwest of Portland, Maine,[34] and subsequently merges with another extratropical low over the north Atlantic.[27]
September 18
- 00:00 UTC (8:00 p.m. AST, September 17) – Hurricane Gert weakens to a Category 3 hurricane.[29]
September 19
- 06:00 UTC (2:00 a.m. AST) – Hurricane Gert re-strengthens to a Category 4 hurricane.[29]
- 06:00 UTC (1:00 a.m. CDT) – Tropical Depression Ten forms about 350 nautical miles (650 km; 400 mi) west-southwest of St. Petersburg, Florida in the Gulf of Mexico.[35]
September 20
- 00:00 UTC (7:00 p.m. CDT, September 19) – Tropical Depression Ten strengthens into Tropical Storm Harvey about 300 nautical miles (560 km; 350 mi) west-southwest of St. Petersburg.[35]
- 06:00 UTC (2:00 a.m. AST) – Hurricane Gert again weakens to a Category 3 hurricane.[29]

September 21
- 00:00 UTC (8:00 p.m. AST, September 20) – Hurricane Gert weakens to a Category 2 hurricane.[29]
- 08:00 UTC (4:00 a.m. EDT) – Tropical Storm Harvey attains its peak intensity with maximum sustained winds of 60 mph (95 km/h) and a minimum pressure of 994 mbar (hPa; 29.35 inHg).[35]
- 17:00 UTC (1:00 p.m. EDT) – Tropical Storm Harvey makes landfall near Everglades City, Florida with winds of 60 mph (95 km/h).[35]
- 18:00 UTC (1:00 p.m. AST) – Hurricane Gert weakens to a Category 1 hurricane,[29] about 140 mi (230 km) east of Bermuda.[36]
September 22
- 03:00 UTC (11:00 p.m. EDT, September 21) – Tropical Storm Harvey is absorbed by an extratropical low about 115 mi (185 km) northeast of Freeport, Bahamas.[37]
September 23
- 00:00 UTC (8:00 p.m. AST, September 22) – Hurricane Gert weakens to a tropical storm south-southwest of St. John's, Newfoundland.[29]
- 12:00 UTC (8:00 a.m. AST) – Tropical Storm Gert becomes extratropical southeast of St. John's, Newfoundland and later merges with another extratropical low.[29]
October[]
October 4
- 06:00 UTC (1:00 a.m. CDT) – Tropical Depression Eleven forms in the Gulf of Mexico about 125 nautical miles (232 km; 144 mi) east-northeast of Veracruz.[38]
October 5
- 00:00 UTC (7:00 p.m. CDT, October 4) – Tropical Depression Eleven attains its peak intensity with maximum sustained winds of 35 mph (55 km/h) and a minimum pressure of 1002 mbar (hPa; 29.59 inHg).[38]
October 6
- 00:00 UTC (8:00 p.m. AST, October 5) – Tropical Depression Twelve forms east of the Lesser Antilles over the central tropical Atlantic Ocean.[39]
- 12:00 UTC (8:00 a.m. AST) – Tropical Depression Twelve attained its peak intensity with maximum sustained winds of 35 mph (55 km/h) and a minimum pressure of 1007 mbar (hPa; 29.74 inHg).[39]
- 18:00 UTC (1:00 p.m. CDT) – Tropical Depression Eleven dissipates north-northeast of Veracruz.[38]
October 8
- 18:00 UTC (2:00 p.m. AST) – Tropical Depression Twelve dissipates north of the Lesser Antilles.[39]
October 13
- 06:00 UTC (2:00 a.m. EDT) – Tropical Depression Thirteen forms in the northwestern Caribbean Sea.[40]
- 12:00 UTC (8:00 a.m. EDT) – Tropical Depression Thirteen strengthens into Tropical Storm Irene about 180 mi (290 km) west-southwest of Grand Cayman.[40]
October 14
- 12:00 UTC (8:00 a.m. EDT) – Tropical Storm Irene makes landfall on Isle of Youth, Cuba, with winds of 70 mph (110 km/h).[40]
- 19:00 UTC (3:00 p.m. EDT) – Tropical Storm Irene made landfall on Batabano, Cuba with winds 70 mph (110 km/h).[40]

October 15
- 06:00 UTC (2:00 a.m. EDT) – Tropical Storm Irene reaches hurricane strength after emerging into the Florida Straits east of Havana.[40]
- 13:00 UTC (9:00 a.m. EDT) – Hurricane Irene makes landfall on Key West, Florida with winds of 75 mph (120 km/h).[40]
- 20:00 UTC) (4:00 pm EDT) – Hurricane Irene makes landfall near Cape Sable, Florida with winds of 80 mph (130 km/h).[40]
October 16
- 09:00 UTC (5:00a.m. EDT) – Hurricane Irene emerges into the Atlantic Ocean just south of Ft. Pierce, Florida.[41]
October 17
- 18:00 UTC (2:00 p.m. AST) – Tropical Depression Fourteen forms about 700 mi (1,100 km) east of the southern Windward Islands.[42]
October 18
- 06:00 UTC (2:00 a.m. EDT) – Hurricane Irene strengthens to a Category 2 hurricane[40] about 40 mi (64 km) east-southeast of Cape Hatteras, North Carolina.[43]
- 06:00 UTC (2:00 a.m. AST) – Tropical Depression Fourteen strengthens into Tropical Storm Jose about 400 mi (640 km) east of the Windward Islands.[42]
- 08:00 UTC (4:00 a.m. EDT) – Hurricane Irene attains its peak intensity about 70 mi (110 km) east-northeast of Cape Hatteras with winds of 110 mph (175 km/h) and a minimum pressure of 958 mbar (hPa; 28.29 inHg).[40]
- 18:00 UTC (2:00 pm EDT) – Hurricane Irene weakens to a Category 1 hurricane.[40]
October 19
- 06:00 UTC (2:00 a.m. AST) – Hurricane Irene becomes extratropical south of Newfoundland and is subsequently absorbed by a much larger extratropical low.[40]
- 18:00 UTC (2:00 p.m. AST) – Tropical Storm Jose attains hurricane strength about 150 mi (240 km) east of the Leeward Islands.[42]

October 20
- 06:00 UTC (2:00 a.m. AST) – Hurricane Jose attained its minimum pressure of 979 mbar (hPa; 28.91 inHg).[42]
- 12:00 UTC (8:00 a.m. EDT) – Hurricane Jose strengthens to a Category 2 hurricane and attains its peak sustained winds of 100 mph (155 km/h).[42]
- 16:00 UTC (12:00 p.m. AST) – Hurricane Jose weakens to a Category 1 hurricane as it makes landfall on Antigua with winds of 90 mph (155 km/h).[42]
October 21
- 11:00 UTC (7:00 a.m. AST) – Hurricane Jose weakens to a tropical storm as it makes landfall on Tortola with sustained winds of 70 mph (110 km/h).[42]
October 24
- 12:00 UTC (8:00 a.m. AST) – Tropical Storm Jose regains hurricane strength east-southeast of Bermuda.[42]
October 25
- 00:00 UTC (8:00 pm AST, October 24) – Hurricane Jose weakens again to a tropical storm east-northeast of Bermuda..[42]
- 09:00 UTC (5:00 a.m. AST) – Tropical Storm Jose becomes extratropical about 575 mi (925 km) southeast of Halifax, Nova Scotia,[44] and is later absorbed by a large extratropical low.[42]
October 28
- 18:00 UTC (2:00 pm AST) – Tropical Depression Fifteen forms about 170 miles (280 km) east of Bluefields, Nicaragua.[45]
October 29
- 18:00 UTC (2:00 pm AST) – Tropical Depression Fifteen strengthens into Tropical Storm Katrina[45] about 55 mi (85 km) southeast Puerto Cabezas, Nicaragua.[46]
October 30
- 00:00 UTC (8:00 p.m. AST, October 29) – Tropical Storm Katrina makes landfall about 25 mi (40 km) southwest Puerto Cabeza with sustained winds of 40 mph (65 km/h) and a minimum pressure of 999 mbar (hPa; 29.5 inHg).[47]
- 06:00 UTC (2:00 a.m. EDT) – Tropical Storm Katrina weakens to a tropical depression, and is subsequently absorbed by a cold front just north of the Yucatan Peninsula.[45]
November[]
November 13
- 18:00 UTC (1:00 p.m. EST) – Tropical Depression Sixteen forms about 170 mi (280 km) south of the Cayman Islands.[48]
November 14
- 12:00 UTC (7:00 a.m. EST) – Tropical Depression Sixteen strengthens into Tropical Storm Lenny.[48]
- 18:00 UTC (1:00 p.m. EST) – Tropical Storm Lenny intensifies to hurricane strength about 150 mi (240 km) southwest of Kingston, Jamaica.[48]
November 15
- 12:00 UTC (7:00 a.m. EST) – Hurricane Lenny strengthens to a Category 2 hurricane about 175 mi (280 km) south of Jamaica.[49]
- 18:00 UTC (1:00 p.m. EST) – Hurricane Lenny weakens to a Category 1 hurricane.[48]
November 16
- 12:00 UTC (8:00 a.m. AST) – Hurricane Lenny re-strengthens to a Category 2 hurricane about 255 mi (410 km) south-southwest of Santo Domingo, Dominican Republic.[50]
November 17

- 00:00 UTC (8:00 p.m. AST, November 16) – Hurricane Lenny strengthens to a Category 3 hurricane about 205 mi (330 km) southwest of San Juan, Puerto Rico.[51]
- 12:00 UTC (8:00 a.m. AST) – Hurricane Lenny strengthens to a Category 4 hurricane.[48]
- 18:00 UTC (2:00 p.m. AST) – Hurricane Lenny attains its peak intensity with winds of 155 mph (250 km/h) and a minimum pressure of 933 mbar (hPa; 27.55 inHg), while simultaneously making landfall on St. Croix, United States Virgin Islands with winds of 155 mph (250 km/h).[48]
November 18
- 18:00 UTC (2:00 p.m. AST) – Hurricane Lenny weakens to a Category 3 hurricane, while simultaneously making landfall on St. Martin with winds of 125 mph (205 km/h).[48]
November 19
- 00:00 UTC (8:00 p.m. AST, November 18) – Hurricane Lenny weakens to a Category 2 hurricane, while simultaneously making landfall on Anguilla with winds of 100 mph (155 km/h).[48]
- 06:00 UTC (2:00 a.m. AST) – Hurricane Lenny weakens to a Category 1 hurricane, while simultaneously making landfall on St. Barthelemy with winds of 85 mph (140 km/h).[48]
- 18:00 UTC (2:00 p.m. AST) – Hurricane Lenny weaken to a tropical storm.[48]
November 20
- 00:00 UTC (8:00 p.m. AST, November 19) – Tropical Storm Lenny makes landfall on Antigua with winds of 65 mph (100 km/h).[48]
November 21
- 00:00 UTC (8:00 p.m. AST, November 20) – Tropical Storm Lenny weakens to a tropical depression while moving away from the Leeward Islands to the southeast, and subsequently dissipates in the central Atlantic Ocean.[48]
November 30
- The 1999 Atlantic hurricane season officially ends.[4]
Notes[]
- ^ An average Atlantic hurricane season, as defined by the National Oceanic and Atmospheric Administration, has 12 tropical storms, six hurricanes and two major hurricanes.[2]
- ^ Hurricanes reaching Category 3 (111 miles per hour (179 km/h)) and higher on the 5-level Saffir–Simpson wind speed scale are considered major hurricanes.[5]
- ^ The figures for maximum sustained winds and position estimates are rounded to the nearest 5 units (knots, miles, or kilometers), following the convention used in the National Hurricane Center's operational products for each storm. All other units are rounded to the nearest digit.
References[]
- ^ a b c Dolce, Chris (June 12, 2018). "Top-10 Most Extreme Atlantic Hurricane Seasons in the Satellite Era". weather.com. Atlanta, Georgia: The Weather Channel. Retrieved July 23, 2020.
- ^ "Background Information: North Atlantic Hurricane Season". College Park, Maryland: NOAA Climate Prediction Center. Retrieved July 11, 2020.
- ^ a b c Lawrence, Miles B.; Avila, Lixion A.; Beven, Jack L.; Franklin, James L.; Guiney, John L.; Pasch, Richard J. (December 2001). "Atlantic Hurricane Season of 1999". Monthly Weather Review. American Meteorological Society. 129 (12): 3057–3084. Bibcode:2001MWRv..129.3057L. doi:10.1175/1520-0493(2001)129<3057:AHSO>2.0.CO;2. Retrieved July 23, 2020.
- ^ a b c Dorst, Neal (June 1, 2018). "Hurricane Season Information". Frequently Asked Questions About Hurricanes. Miami, Florida: NOAA Atlantic Oceanographic and Meteorological Laboratory. Retrieved July 23, 2020.
- ^ "Saffir-Simpson Hurricane Wind Scale". Miami, Florida: National Hurricane Center. Retrieved June 29, 2020.
- ^ Herring, David (March 1, 2000). "Hurricane Floyd Series: Hurricane Floyd's Lasting Legacy". Greenbelt, Maryland: NASA Earth Observatory, Goddard Space Flight Center. Retrieved July 23, 2020.
- ^ Mitchell, Chaffin (November 29, 2019). "Remembering some of the most notorious November Atlantic hurricanes". accuweather.com. State College, Pennsylvania: AccuWeather. Retrieved July 23, 2020.
- ^ "Tropical Cyclone Naming History and Retired Names". miami, Florida: NOAA National Hurricane Center. Retrieved July 23, 2020.
- ^ "Understanding the Date/Time Stamps". miami, Florida: NOAA National Hurricane Center. Retrieved July 14, 2020.
- ^ a b c d e Franklin, James (July 7, 1999). Preliminary Report Tropical Storm Arlene (PDF) (Report). Miami, Florida: National Hurricane Center. Retrieved July 31, 2020.
- ^ Guiney, John L. (June 12, 1999). Tropical Storm Arlene Advisory Number 4 (Report). Miami, Florida: National Weather Service. Retrieved July 31, 2020.
- ^ a b c Pasch, Richard J. (July 29, 1999). "Brief Information About Tropical Depression Two" (PDF). Miami, Florida: National Hurricane Center. Retrieved July 31, 2020.
- ^ a b c d e f g h Lawrence, Miles B.; Kimberlain (February 26, 2001). Preliminary report Hurricane Bret (PDF) (Report). Miami, Florida: National Hurricane Center. Retrieved July 31, 2020.
- ^ a b c d e f g h i j k l m n Guiney, John (December 9, 1999). Preliminary Report Hurricane Cindy (PDF) (Report). Miami, Florida: National Hurricane Center. Retrieved July 31, 2020.
- ^ Franklin, James (August 20, 1999). Tropical Storm Bret Intermediate Advisory Number 9A (Report). Miami, Florida: National Weather Service. Retrieved July 31, 2020.
- ^ Avila, Lixion (August 21, 1999). Hurricane Storm Bret Intermediate Advisory Number 13A (Report). Miami, Florida: National Weather Service. Retrieved July 31, 2020.
- ^ Lawrence, Miles B. (August 23, 1999). Tropical Storm Bret Intermediate Advisory Number 19B (Report). Miami, Florida: National Weather Service. Retrieved July 31, 2020.
- ^ a b c d e f g Beven, Jack (January 11, 2000). Preliminary Report Hurricane Dennis (PDF) (Report). Miami, Florida: National Hurricane Center. Retrieved July 31, 2020.
- ^ a b c d Avila, Lixion (September 30, 1999). Preliminary Report Tropical Storm Emily (PDF) (Report). Miami, Florida: National Hurricane Center. Retrieved July 31, 2020.
- ^ Beven, Jack (August 26, 1999). Hurricane Dennis Intermediate Advisory Number 9A (Report). Miami, Florida: National Weather Service. Retrieved July 31, 2020.
- ^ Avila, Lixion (August 28, 1999). Hurricane Dennis Intermediate Advisory Number 18A (Report). Miami, Florida: National Weather Service. Retrieved July 31, 2020.
- ^ Beven, Jack (August 30, 1999). Hurricane Dennis Intermediate Advisory Number 28A (Report). Miami, Florida: National Weather Service. Retrieved July 31, 2020.
- ^ Beven, Jack (August 31, 1999). Hurricane Dennis Intermediate Advisory Number 32A (Report). Miami, Florida: National Weather Service. Retrieved July 31, 2020.
- ^ Jarvinen, Brian R. (September 5, 1999). Tropical Depression Dennis Advisory Number 50 (Report). Miami, Florida: National Weather Service. Retrieved August 2, 2020.
- ^ a b c Avila, Lixion (October 17, 1999). Preliminary Report Tropical Depression Seven (PDF) (Report). Miami, Florida: National Hurricane Center. Retrieved July 31, 2020.
- ^ Roth, David (September 7, 1999). Remnants of DENNIS Advisory Number 60 (Report). Camp Springs, Maryland: National Centers For Environmental Prediction Hydrometeorological Prediction Center, NWS. Retrieved August 2, 2020.
- ^ a b c d e f g h i j k l Pasch, Richard J.; Kimberlain, Todd B.; Stewart, Stacy R. (November 18, 1999) [Updated September 9, 2014]. Preliminary Report Hurricane Floyd (PDF) (Report). Miami, Florida: National Hurricane Center. Retrieved August 2, 2020.
- ^ Franklin, James (September 10, 1999). Hurricane Floyd Intermediate Advisory Number 11A (Report). Miami, Florida: National Weather Service. Retrieved August 2, 2020.
- ^ a b c d e f g h i j k l m n Lawrence, Miles (July 22, 2000). Preliminary report Hurricane Gert (PDF) (Report). National Hurricane Center. Retrieved August 2, 2020.
- ^ Franklin, James (September 12, 1999). Hurricane Floyd Intermediate Advisory Number 19A (Report). Miami, Florida: National Weather Service. Retrieved August 2, 2020.
- ^ Franklin, James (September 12, 1999). Hurricane Floyd Intermediate Advisory Number 20A (Report). Miami, Florida: National Weather Service. Retrieved August 2, 2020.
- ^ Lawrence, Miles (September 13, 1999). Hurricane Floyd Intermediate Advisory Number 23A (Report). Miami, Florida: National Weather Service. Retrieved August 2, 2020.
- ^ Guiney, John (September 14, 1999). Hurricane Floyd Intermediate Advisory Number 26A (Report). Miami, Florida: National Weather Service. Retrieved August 2, 2020.
- ^ Guiney, John (September 17, 1999). Tropical Storm Floyd Advisory Number 39 (Report). Miami, Florida: National Weather Service. Retrieved August 2, 2020.
- ^ a b c d Guiney, John (December 9, 1999). Preliminary Report Tropical Storm Harvey (PDF) (Report). miami, Florida: National Hurricane Center. Retrieved August 2, 2020.
- ^ Pasch, Richard J. (September 21, 1999). Tropical Storm Gert Intermediate Advisory Number 41A (Report). Miami, Florida: National Weather Service. Retrieved August 2, 2020.
- ^ Guiney, John (September 21, 1999). Tropical Storm Harvey Advisory Number 12 (Report). Miami, Florida: National Weather Service. Retrieved August 2, 2020.
- ^ a b c Beven, Jack (December 1, 1999). Brief Information about Tropical Depression Eleven (PDF) (Report). Miami, Florida: National Hurricane Center. Retrieved July 31, 2020.
- ^ a b c Franklin, James (November 9, 1999). Preliminary Report Tropical Depression Twelve (PDF) (Report). Miami, Florida: National Hurricane Center. Retrieved July 31, 2020.
- ^ a b c d e f g h i j k Avila, Lixion (November 22, 1999). Preliminary Report Hurricane Irene (PDF) (Report). Miami, Florida: National Hurricane Center. Retrieved July 31, 2020.
- ^ Beven, Jack; Guiney, John L. (October 16, 1999). Hurricane Irene Advisory Number 13 (Report). Miami, Florida: National Weather Service. Retrieved July 31, 2020.
- ^ a b c d e f g h i j Pasch, Richard J. (November 22, 1999). Preliminary Report Hurricane Jose (PDF) (Report). Miami, Florida: National Hurricane Center. Retrieved July 31, 2020.
- ^ Beven, Jack (October 18, 1999). Hurricane Irene Intermediate Advisory Number 20A (Report). Miami, Florida: National Weather Service. Retrieved July 31, 2020.
- ^ Franklin, James (October 25, 1999). Tropical Storm Jose Advisory Number 31 (Report). Miami, Florida: National Weather Service. Retrieved July 31, 2020.
- ^ a b c Lawrence, Miles (November 30, 1999). Preliminary report Tropical Storm Katrina (PDF) (Report). Miami, Florida: National Hurricane Center. Retrieved July 31, 2020.
- ^ Guiney, John L. (October 29, 1999). Tropical Depression Fifteen Intermediate Advisory Number 4A (Report). Miami, Florida: National Weather Service. Retrieved July 31, 2020.
- ^ Franklin, James (October 29, 1999). Tropical Storm Katrina Intermediate Advisory Number 5A (Report). Miami, Florida: National Weather Service. Retrieved July 31, 2020.
- ^ a b c d e f g h i j k l Guiney, John (December 9, 1999) [modified February 22, 2000]. Preliminary Report Hurricane Lenny (PDF) (Report). Miami, Florida: National Hurricane Center. Retrieved August 2, 2020.
- ^ Beven, Jack (November 15, 1999). Hurricane Lenny Intermediate Advisory Number 8A (Report). Miami, Florida: National Weather Service. Retrieved August 2, 2020.
- ^ Beven, Jack (November 16, 1999). Hurricane Lenny Intermediate Advisory Number 12A (Report). Miami, Florida: National Weather Service. Retrieved August 2, 2020.
- ^ Pasch, Richard J. (November 16, 1999). Hurricane Lenny Intermediate Advisory Number 14A (Report). Miami, Florida: National Weather Service. Retrieved August 2, 2020.
External links[]
| Wikimedia Commons has media related to 1999 Atlantic hurricane season. |
- 1999 Atlantic hurricane season
- Atlantic Ocean meteorological timelines