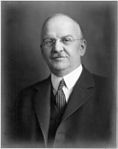
1929 Ontario general election
| |||||||||||||||||||||||||||||||||||||||||||||||||||||||||||||||||
112 seats in the 18th Legislative Assembly of Ontario 57 seats were needed for a majority | |||||||||||||||||||||||||||||||||||||||||||||||||||||||||||||||||
|---|---|---|---|---|---|---|---|---|---|---|---|---|---|---|---|---|---|---|---|---|---|---|---|---|---|---|---|---|---|---|---|---|---|---|---|---|---|---|---|---|---|---|---|---|---|---|---|---|---|---|---|---|---|---|---|---|---|---|---|---|---|---|---|---|---|
| |||||||||||||||||||||||||||||||||||||||||||||||||||||||||||||||||
| |||||||||||||||||||||||||||||||||||||||||||||||||||||||||||||||||
The 1929 Ontario general election was the 18th general election held in the Province of Ontario, Canada. It was held on October 30, 1929, to elect the 112 Members of the 18th Legislative Assembly of Ontario ("MLAs").[1]
The Ontario Conservative Party, led by George Howard Ferguson, was elected for a third consecutive term in government with an increased majority in the Legislature.
The Ontario Liberal Party, led by W.E.N. Sinclair, lost one seat, but continued to form the official opposition.
Conservative gains came at the expense of the Progressive Party and the United Farmers of Ontario.
Earl Hutchinson of Kenora is the sole Labour MLA elected.
Results[]
| Political party | Party leader | MPPs | Votes | |||||||
|---|---|---|---|---|---|---|---|---|---|---|
| Candidates | 1926 | Dissol. | 1929 | ± | # | % | ± (pp) | |||
| Conservative | Howard Ferguson | 112 | 72 | 72 | 90 | 18 |
574,730 | 56.66% | 1.30 | |
| Liberal | W.E.N. Sinclair | 84 | 14 | 14 | 13 | 1 |
326,960 | 32.23% | 14.99 | |
| Progressive | William Raney | 10 | 10 | 8 | 4 | 6 |
34,507 | 3.40% | 2.92 | |
| Liberal–Progressive | 1 | 4 | 4 | 1 | 3 |
5,449 | 0.54% | 3.45 | ||
| United Farmers | Leslie Oke | 3 | 3 | 3 | 1 | 2 |
12,752 | 1.26% | 0.08 | |
| Labour | 4 | 1 | 1 | 1 | 10,029 | 0.99% | 0.30 | |||
| Independent Conservative | 7 | 2 | 2 | 2 | 21,950 | 2.16% | 0.49 | |||
| Independent Liberal | – | 4 | 3 | – | 4 |
Did not campaign | ||||
| Independent Progressive | – | 1 | 1 | – | 1 |
Did not campaign | ||||
| Liberal-Prohibitionist | – | 1 | 1 | – | 1 |
Did not campaign | ||||
| Prohibitionist | 8 | – | – | – | 25,807 | 2.54% | 5.91 | |||
| Communist | 5 | – | – | – | 1,542 | 0.15% | New | |||
| Independent | 2 | – | – | – | 587 | 0.06% | 0.19 | |||
| Liberal-Labour | – | – | – | – | Did not campaign | |||||
| Progressive-Liberal | – | – | – | – | Did not campaign | |||||
| Liberal-Labour-Prohibitionist | – | – | – | – | Did not campaign | |||||
| Vacant | 3 | |||||||||
| Total | 236 | 112 | 112 | 112 | 1,014,313 | 100.00% | ||||
| Blank and invalid ballots | 7,749 | |||||||||
| Registered voters / turnout | 1,804,937 | 56.63% | 7.26 | |||||||
| Party | Seats | Votes | Change (pp) | ||
|---|---|---|---|---|---|
| █ Conservative | 90 / 112 |
56.66% |
1.30 | ||
| █ Liberal | 13 / 112 |
32.23% |
14.99 | ||
| █ Progressive | 4 / 112 |
3.40% |
-2.92 | ||
| █ Liberal–Progressive | 1 / 112 |
0.54% |
-3.45 | ||
| █ United Farmers | 1 / 112 |
1.26% |
-0.08 | ||
| █ Labour | 1 / 112 |
0.99% |
-0.30 | ||
| █ Independent-Conservative | 2 / 112 |
2.16% |
0.49 | ||
| █ Prohibitionist | 0 / 112 |
2.54% |
-5.91 | ||
| █ Other | 0 / 112 |
0.22% |
-4.12 | ||
Seats that changed hands[]
| Party | 1926 | Gain from (loss to) | 1929 | ||||||||||||||||||||
|---|---|---|---|---|---|---|---|---|---|---|---|---|---|---|---|---|---|---|---|---|---|---|---|
| Con | Lib | Pro | L-Pro | UFO | Lab | I-Lib | I-Con | I-Pro | L-Prb | ||||||||||||||
| Conservative | 72 | 8 | (5) | 5 | 2 | 2 | 1 | (1) | 3 | 2 | (1) | 1 | 1 | 90 | |||||||||
| Liberal | 14 | 5 | (8) | 1 | 1 | 13 | |||||||||||||||||
| Progressive | 10 | (5) | (1) | 4 | |||||||||||||||||||
| Liberal–Progressive | 4 | (2) | (1) | 1 | |||||||||||||||||||
| United Farmers | 3 | (2) | 1 | ||||||||||||||||||||
| Labour | 1 | 1 | (1) | 1 | |||||||||||||||||||
| Independent-Liberal | 4 | (3) | (1) | – | |||||||||||||||||||
| Independent-Conservative | 2 | 1 | (2) | 1 | 2 | ||||||||||||||||||
| Independent-Progressive | 1 | (1) | – | ||||||||||||||||||||
| Liberal-Prohibitionist | 1 | (1) | – | ||||||||||||||||||||
| Total | 112 | 7 | (25) | 8 | (7) | 6 | – | 3 | – | 2 | – | 1 | (1) | 4 | – | 2 | (2) | 1 | – | 1 | – | 112 | |
There were 35 seats that changed allegiance in the election:
|
|
Notes[]
References[]
- ^ "1929 General Election". Elections Ontario. Elections Ontario. Retrieved January 3, 2021.
See also[]
- Politics of Ontario
- List of Ontario political parties
- Premier of Ontario
- Leader of the Opposition (Ontario)
Further reading[]
- The Editors, ed. (1930). The Canadian Annual Review of Public Affairs, 1929–30. Toronto: The Annual Review Company.
{{cite book}}:|editor=has generic name (help)
- 1929 elections in Canada
- General elections in Ontario
- 1929 in Ontario
- October 1929 events
