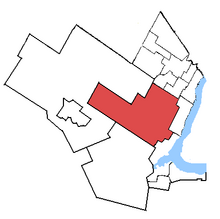
Halton electoral district Halton in relation to other Greater Toronto Area electoral districts
Legislature Legislative Assembly of Ontario District created 1867 District abolished 2018 First contested 1867 Last contested 2014 Population (2006) 151,943 Electors (2007)102,730 Area (km²) 568 Census division(s) Halton Census subdivision(s) Oakville , Burlington , Milton
Halton was a provincial electoral district in Central Ontario , Canada. It elected one member to the Legislative Assembly of Ontario .
History [ ] Until 1967, the electoral district was contiguous with the County of Halton .
Division (1967-1999) [ ] The territory comprising Halton was redistributed on several occasions between 1967 and 1999:
The Representation Act, 1966 [1]
The Representation Act, 1975 [2] Regional Municipality of Halton into Burlington South , Halton-Burlington (consisting of Halton Hills, Milton and the northern part of Burlington) and Oakville.
The Representation Act, 1986 [3] Burlington South , Halton Centre (consisting of the northern parts of Burlington and Oakville and a southern part of Milton), Halton North (consisting of Halton Hills and the northern part of Milton) and Oakville South. Alignment with federal electoral district (1999) [ ] With the passage of the Representation Act, 1996 ,[4] federal electoral district . Subsequent adjustments to boundaries have been consequential upon representation orders made under the federal Electoral Boundaries Readjustment Act [5] [6]
The new riding included all of the Regional Municipality of Halton north of a line following Dundas Street to Highway 407 to Upper Middle Road to Walkers Line to the QEW to Burlington City limits to Upper Middle Road.
In 2007, the riding lost all of the Town of Halton Hills to Wellington—Halton Hills . Also, the border following the 407 was altered so that it follows Guelph Line instead. Also, the territory east of Eighth Line and south of Dundas Street was also lost.
Abolition (2018) [ ] In 2018, the riding was divided into Milton , Oakville North—Burlington , Burlington , Mississauga—Streetsville and Mississauga—Erin Mills .
Members of Provincial Parliament [ ] Election results (1999-2014) [ ] Graph of election results in Halton (1999-2014). Omitted are minor parties consistently registering less than 2% of the vote, as well as those who campaigned intermittently.
hide 2014 Ontario general election
Party
Candidate
Votes
%
Liberal Indira Naidoo-Harris 33,724
44.79
+5.66
Progressive Conservative Ted Chudleigh 27,937
37.10
-7.37
New Democratic Nik Spohr
9,758
12.96
-0.19
Green Susan Farrant
2,618
3.48
+1.30
Libertarian Kal Ghory
916
1.22
–
Family Coalition Gerry Marsh
346
0.46
-0.04
Total valid votes
75,299 100.0
Eligible voters
149,633
Liberal gain from Progressive Conservative
Swing
+6.52
Source: Elections Ontario [9]
hide 2011 Ontario general election
Party
Candidate
Votes
%
Progressive Conservative Ted Chudleigh 26,228
44.47
+1.89
Liberal Indira Naidoo-Harris 23,080
39.13
-1.83
New Democratic Nik Spohr
7,757
13.15
+5.58
Green Karen Fraser
1,286
2.18
-5.78
Family Coalition Tony Rodrigues
296
0.50
-0.42
Freedom Gina Van Den Burg
168
0.28
Independent Phil Buck
166
0.28
Total valid votes
58,981 100.00
Total rejected, unmarked and declined ballots
181 0.31
Turnout
59,162 45.99
Eligible voters
128,643
Progressive Conservative hold
Swing
+1.86
Source: Elections Ontario [10]
hide 2007 Ontario general election
Party
Candidate
Votes
%
Progressive Conservative Ted Chudleigh 23,391
42.58
-5.62
Liberal Gary Zemlak
22,497
40.96
+0.64
Green Andrew Chlobowski
4,375
7.96
+6.10
New Democratic Pat Heroux
4,159
7.57
-0.44
Family Coalition Stan Lazarski
506
0.92
-0.69
Total valid votes
54,928 100.00
Progressive Conservative hold
Swing
-3.13
hide 2003 Ontario general election
Party
Candidate
Votes
%
Progressive Conservative Ted Chudleigh 33,610
48.20
-16.75
Liberal Barbara Sullivan
28,112
40.32
+13.31
New Democratic Jay Jackson
5,587
8.01
+2.83
Green Matthew Raymond Smith
1,295
1.86
+0.39
Family Coalition Giuseppe Gori
1,123
1.61
+0.23
Total valid votes
68,432 100.00
Progressive Conservative hold
Swing
-15.03
hide 1999 Ontario general election
Party
Candidate
Votes
%
Progressive Conservative Ted Chudleigh 35,505
64.95
Liberal Mohan Anand
14,767
27.01
New Democratic Jay Jackson
2,833
5.18
Green Bill Champ
806
1.47
Family Coalition Giuseppe Gori
755
1.38
Total valid votes
54,666 100.00
2007 electoral reform referendum [ ]
2007 Ontario electoral reform referendum
Side
Votes
%
First Past the Post
33,302
62.5
Mixed member proportional
20,019
37.5
Total valid votes
53,321
100.0
Election results (1867-1967) [ ] Graph of election results in Halton (1867-1963). Omitted are minor parties consistently registering less than 2% of the vote, as well as those who campaigned intermittently.
hide 1963 Ontario general election
Party
Candidate
Votes
%
Progressive Conservative George Kerr 19,947
51.53
+8.30
Liberal Owen Mullin
13,575
35.07
-5.14
New Democratic William Gillies
5,188
13.40
-3.16
Total valid votes
38,710 100.00
Progressive Conservative hold
Swing
+6.72
Source: Elections Ontario
hide 1959 Ontario general election
Party
Candidate
Votes
%
Progressive Conservative Stanley Hall 10,385
43.23
-4.08
Liberal Owen Mullin
9,658
40.21
+6.81
Co-operative Commonwealth Jack Henry
3,977
16.56
-2.73
Total valid votes
24,020 100.00
Progressive Conservative hold
Swing
-5.45
Source: Elections Ontario
hide 1955 Ontario general election
Party
Candidate
Votes
%
Progressive Conservative Stanley Hall 8,373
47.31
-4.30
Liberal William Anderson
5,912
33.40
-2.48
Co-operative Commonwealth Stanley Allen
3,414
19.29
+6.78
Total valid votes
17,699 100.00
Progressive Conservative hold
Swing
-0.91
Source: Elections Ontario
hide 1951 Ontario general election
Party
Candidate
Votes
%
Progressive Conservative Stanley Hall 9,063
51.61
+12.16
Liberal F. Murray Deans
6,301
35.88
-2.87
Co-operative Commonwealth Angus Langille
2,197
12.51
-9.29
Total valid votes
17,561 100.00
Progressive Conservative hold
Swing
+7.52
Source: The Georgetown Herald
hide 1948 Ontario general election
Party
Candidate
Votes
%
Progressive Conservative Stanley Hall 6,377
39.45
-5.31
Liberal F. Murray Deans
6,264
38.75
+1.68
Co-operative Commonwealth W. Adamson
3,524
21.80
+3.63
Total valid votes
16,165 100.00
Progressive Conservative hold
Swing
-3.50
Source: Elections Ontario
hide 1945 Ontario general election
Party
Candidate
Votes
%
Progressive Conservative Stanley Hall 6,914
44.76
+6.25
Liberal Mary Pettit
5,725
37.07
+5.72
Co-operative Commonwealth William Millward
2,806
18.17
-11.02
Total valid votes
15,445 100.00
Progressive Conservative hold
Swing
+0.27
Source: Elections Ontario
hide 1943 Ontario general election
Party
Candidate
Votes
%
Progressive Conservative Stanley Hall 4,474
38.51
-3.71
Liberal Thomas Blakelock 3,642
31.35
-24.15
Co-operative Commonwealth Wilfred Tate
3,391
29.19
+27.50
Independent John Foster
111
0.96
+0.96
Total valid votes
11,618 100.00
Progressive Conservative gain
Swing
Source: Elections Ontario
hide 1879 Ontario general election
Party
Candidate
Votes
%
Liberal D. Robertson
1,776
50.60
Conservative W. C. Beatty
1,734
49.40
Total valid votes
3,510 100.00
Source: The Acton Free Press [12]
Sources [ ]
^ The Representation Act, 1966 ^ The Representation Act, 1975 ^ Representation Act, 1986 ^ Representation Act, 1996 ^ Electoral Boundaries Readjustment Act R.S.C. 1985, c. E-3
^ Election Statute Law Amendment Act, 2005 Electoral Boundaries Act, 2015 ^ "Halton Election" . The Georgetown Herald ^ "Blakelock again unanimous choice" . The Georgetown Herald ^ Elections Ontario (2014). "Summary of valid votes cast for each candidate" (PDF) . p. 4. Archived from the original (PDF) on December 12, 2017. Retrieved December 28, 2017 .^ Elections Ontario (2011). "Summary of valid votes cast for each candidate" (PDF) . p. 6. Retrieved December 28, 2017 .^ Gemmill, J.A., ed. (1885). The Canadian parliamentary companion ^ "Ontario Elections" . The Acton Free Press . June 12, 1879.^ C.H. Mackintosh, ed. (1878). The Canadian parliamentary companion and annual register, 1878 ^ Henry J. Morgan, ed. (1875). The Canadian parliamentary companion ^ Henry J. Morgan, ed. (1874). The Canadian parliamentary companion ^ son of William Johnson Kerr and grandson of Joseph Brant
^ Henry J. Morgan, ed. (1869). The Canadian parliamentary companion
show Provincial ridings in Ontario
Northern Eastern Central Midwestern Southwestern Peel Hamilton, Halton, Ottawa Durham and York Toronto
Authority control
Coordinates : 43°30′N 79°48′W / 43.5°N 79.8°W / 43.5; -79.8