For the provincial electoral district, see Halton (provincial electoral district) .
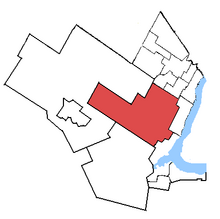
Halton electoral district Halton, 2003–2015, in relation to other Ontario electoral districts
Legislature House of Commons District created 1996 District abolished 2013 First contested 1997 Last contested 2011 District webpage profile , map Population (2011 )[1] 203,437 Electors (2011)115,255 Area (km²)[2] 537.47 Census division(s) Halton Census subdivision(s) Burlington , Milton , Oakville
Halton was a federal electoral district in Ontario , Canada, represented in the House of Commons of Canada from 1867 to 1988 before being abolished in an electoral district redistribution, and again from 1997 to 2015, when it was again abolished in another electoral district redistribution. When it was last contested in 2011, its population was 203,437, of whom 115,255 were eligible electors.
Electoral district [ ] 1867–1966 [ ] Halton riding was created by the British North America Act, 1867 , and defined as Halton County .
1966–1976 [ ] In 1966, the riding was redefined to consist of the Towns of Milton and Oakville and the Township of Esquesing in the County of Halton, and the Township of Erin in the County of Wellington.
1976–1987 [ ] In 1976, it was redefined to consist of the Towns of Milton and Oakville, and the southern part of the Town of Halton Hills.
The electoral district was abolished in 1987 when it was redistributed between Halton—Peel and Oakville—Milton ridings.
1996–2015 [ ] In 1996, the riding was re-created to include the Town of Milton and the northern parts of the Town of Oakville and the City of Burlington , defined as:
the Town of Milton,
the part of the Town of Oakville lying northwest of a line drawn from northeast to southwest along Dundas Street West, southeaster along Eighth Line, and southwest along Upper Middle Road, and
the part of the City of Burlington lying northwest of a line drawn from northeast to southwest along the Queen Elizabeth Way, northwest along Walkers Line, southwest along Upper Middle Road, northwest along Guelph Line, and southwest along Dundas Street. In 2015, the riding of Halton was abolished and redistributed between Milton , Oakville North—Burlington , Burlington , Mississauga—Streetsville and Mississauga—Erin Mills .
Members of Parliament [ ] This riding elected the following Members of Parliament :
Parliament
Years
Member
Party
Halton
1st
1867–1872 John White Liberal 2nd
1872–1874 3rd
1874–1875 Daniel Black Chisholm Liberal–Conservative
1875–1878 William McCraney Liberal
4th
1878–1882 William McDougall Liberal–Conservative 5th
1882–1887 William McCraney Liberal 6th
1887–1888 John Waldie
1888–1888 David Henderson Conservative
1888–1891 John Waldie Liberal
7th
1891–1896 David Henderson Conservative 8th
1896–1900 9th
1900–1904 10th
1904–1908 11th
1908–1911 12th
1911–1917 13th
1917–1921 Robert King Anderson 14th
1921–1925 15th
1925–1926 16th
1926–1930 17th
1930–1935 18th
1935–1940 Hughes Cleaver Liberal–Progressive 19th
1940–1945 Liberal 20th
1945–1949 21st
1949–1953 22nd
1953–1957 Sybil Bennett Progressive Conservative 23rd
1957–1958 Charles Alexander Best 24th
1958–1962 25th
1962–1963 Harry Harley Liberal 26th
1963–1965 27th
1965–1968 28th
1968–1972 Rutherford Lester Whiting 29th
1972–1974 Terry O'Connor Progressive Conservative 30th
1974–1979 Frank Philbrook Liberal 31st
1979–1980 Otto Jelinek Progressive Conservative 32nd
1980–1984 33rd
1984–1988
Riding dissolved into Halton—Peel and Oakville—Milton
Riding re-created from Halton—Peel , Oakville—Milton , Oakville and Burlington
36th
1997–2000 Julian Reed Liberal 37th
2000–2004 38th
2004–2006 Gary Carr 39th
2006–2006 Garth Turner Conservative
2006–2007 Independent
2007–2008 Liberal
40th
2008–2011 Lisa Raitt Conservative 41st
2011–2015
Riding dissolved into Milton , Oakville North—Burlington , Burlington ,Mississauga—Streetsville and Mississauga—Erin Mills
Election results [ ] 1997–2015 [ ] Graph of election results in Halton (1997-2015). Omitted are minor parties consistently registering less than 2% of the vote, as well as those who campaigned intermittently.
2011 Canadian federal election
Party
Candidate
Votes
%
Expenditures
Conservative Lisa Raitt 44,206
54.4
+6.9
Liberal Connie Laurin-Bowie
20,903
25.8
-10.4
New Democratic Patricia Heroux
12,960
16.0
+7.2
Green Judi Remigio
2,778
3.4
-3.6
Christian Heritage Tony Rodrigues
249
0.3
-0.2
Total valid votes
81,096 100.0
Total rejected ballots
290 0.4 +0.1
Turnout
81,394 62.4 +1.9
Eligible voters
130,026 – –
2008 Canadian federal election
Party
Candidate
Votes
%
Expenditures
Conservative Lisa Raitt 32,986
47.5
+3.5
$106,182
Liberal Garth Turner 25,136
36.2
-5.2
$51,972
New Democratic Robert Wagner
6,118
8.8
0.0
$3,421
Green Amy Collard
4,872
7.0
+1.4
$4,509
Christian Heritage Tony Rodrigues
337
0.5
–
$2,108
Total valid votes/Expense limit
69,449 100.0 $107,026
Total rejected ballots
225 0.3
Turnout
69,674 60.5
2006 Canadian federal election
Party
Candidate
Votes
%
Conservative Garth Turner 30,578
44.2
+5.3
Liberal Gary Carr 28,498
41.4
-6.9
New Democratic Anwar Naqvi
6,110
8.8
+0.6
Green Kyle Grice
4,026
5.6
+0.5
Total valid votes
69,212 100.0
Conservative gain from Liberal
Swing
-6.1
2004 Canadian federal election
Party
Candidate
Votes
%
Liberal Gary Carr 27,362
48.3
+1.1
Conservative Dean Martin
21,704
38.8
-8.3
New Democratic Anwar Naqvi
4,642
8.2
+3.8
Green Frank Marchetti
2,889
5.1
+3.4
Total valid votes
56,597 100.0
Note: Conservative vote is compared to the total of the Canadian Alliance vote and Progressive Conservative vote in 2000 election.
2000 Canadian federal election
Party
Candidate
Votes
%
Liberal Julian Reed 28,168
47.3
0.0
Alliance Tim Dobson
15,656
26.3
+4.1
Progressive Conservative Tom Kilmer
12,114
20.3
-4.7
New Democratic Brenda Dolling
2,633
4.4
0.0
Green Tom Adams
1,018
1.7
+0.6
Total valid votes
59,589 100.0
Note: Canadian Alliance vote is compared to the Reform vote in 1997 election.
1997 Canadian federal election
Party
Candidate
Votes
%
Liberal Julian Reed 26,017
47.2
Progressive Conservative Ralph Scholtens
13,778
25.0
Reform Richard Malboeuf
12,221
22.2
New Democratic Jay Jackson
2,452
4.5
Green Bill Champ
600
1.1
Total valid votes
55,068 100.0
1867–1988 [ ] Graph of election results in Halton (1867-1984). Omitted are minor parties consistently registering less than 2% of the vote, as well as those who campaigned intermittently.
1984 Canadian federal election
Party
Candidate
Votes
%
Progressive Conservative Otto Jelinek 38,076
60.6
+13.8
Liberal Oriena R.M. Currie
14,125
22.5
-14.2
New Democratic Kevin Flynn 9,164
14.6
-1.4
Green Chris Kowalchuk
1,494
2.4
Total valid votes
62,859 100.0
1980 Canadian federal election
Party
Candidate
Votes
%
Progressive Conservative Otto Jelinek 24,752
46.8
-6.5
Liberal Bill Perras
19,380
36.6
+4.9
New Democratic Doug Black
8,455
16.0
+1.5
Libertarian Karen Selick
170
0.3
+0.1
Independent Robert J. Ritchie
142
0.3
0.0
Marxist–Leninist Charles Shrybman
18
0.0
0.0
Total valid votes
52,917 100.0
1979 Canadian federal election
Party
Candidate
Votes
%
Progressive Conservative Otto Jelinek 28,850
53.3
+11.7
Liberal Frank A. Philbrook
17,169
31.7
-13.5
New Democratic Doug Black
7,838
14.5
+1.2
Libertarian Karen Selick
144
0.3
Independent Robert J. Ritchie
130
0.2
Marxist–Leninist Charles Shrybman
23
0.0
Total valid votes
54,154 100.0
1974 Canadian federal election
Party
Candidate
Votes
%
Liberal Frank Philbrook 23,520
45.2
+5.8
Progressive Conservative Terry O'Connor
21,609
41.5
-2.2
New Democratic Archibald Brown
6,887
13.2
-3.6
Total valid votes
52,016 100.0
1972 Canadian federal election
Party
Candidate
Votes
%
Progressive Conservative Terry O'Connor 22,640
43.7
+9.7
Liberal Rud L. Whiting 20,419
39.4
-8.7
New Democratic Carolyn Holstein
8,725
16.8
-1.0
Total valid votes
51,784 100.0
1968 Canadian federal election
Party
Candidate
Votes
%
Liberal Rud L. Whiting 17,837
48.1
+0.3
Progressive Conservative Peter McWilliams
12,614
34.0
+2.9
New Democratic Murray Kernighan
6,606
17.8
-2.6
Total valid votes
37,057 100.0
1965 Canadian federal election
Party
Candidate
Votes
%
Liberal Harry C. Harley 25,213
47.8
-4.2
Progressive Conservative Allan M. Masson
16,412
31.1
-1.4
New Democratic Murray S. Kernighan
10,751
20.4
+6.5
Independent Conservative
Henry Timmins
373
0.7
-0.3
Total valid votes
52,749 100.0
1963 Canadian federal election
Party
Candidate
Votes
%
Liberal Harry C. Harley 25,482
52.0
+11.2
Progressive Conservative Sandy Best
15,949
32.5
-8.0
New Democratic Ellis Fullerton
6,790
13.8
-3.7
Independent Conservative
Henry Timmins
481
1.0
Social Credit Irv Wilson
330
0.7
-0.5
Total valid votes
49,032 100.0
1962 Canadian federal election
Party
Candidate
Votes
%
Liberal Harry C. Harley 18,556
40.7
+11.8
Progressive Conservative Sandy Best
18,458
40.5
-20.5
New Democratic Carl Rouleau
8,001
17.6
+7.5
Social Credit Irving R. Wilson
547
1.2
Total valid votes
45,562 100.0
Note: NDP vote is compared to CCF vote in 1958 election.
1958 Canadian federal election
Party
Candidate
Votes
%
Progressive Conservative Charles Alexander Best 21,056
61.0
+2.2
Liberal Ken Dick
9,978
28.9
-1.3
Co-operative Commonwealth Jack Henry
3,481
10.1
-1.0
Total valid votes
34,515 100.0
1957 Canadian federal election
Party
Candidate
Votes
%
Progressive Conservative Charles Alexander Best
17,795
58.8
+10.3
Liberal Kenneth Y. Dick
9,145
30.2
-12.5
Co-operative Commonwealth Jack Henry
3,344
11.0
+2.2
Total valid votes
30,284 100.0
1953 Canadian federal election
Party
Candidate
Votes
%
Progressive Conservative Sybil Bennett 9,914
48.4
+6.9
Liberal Murray Hunter McPhail
8,732
42.7
-6.4
Co-operative Commonwealth Stan Allen
1,819
8.9
-0.5
Total valid votes
20,465 100.0
1949 Canadian federal election
Party
Candidate
Votes
%
Liberal Hughes Cleaver 9,546
49.0
+2.8
Progressive Conservative M. Sybil Bennett
8,099
41.6
-1.0
Co-operative Commonwealth William Albert Shane
1,829
9.4
-1.8
Total valid votes
19,474 100.0
1945 Canadian federal election
Party
Candidate
Votes
%
Liberal Hughes Cleaver 7,344
46.3
-9.5
Progressive Conservative Allan Stanley Nicholson
6,763
42.6
-1.7
Co-operative Commonwealth Carlyle C. Browne
1,770
11.1
Total valid votes
15,877 100.0
Note: Progressive Conservative vote is compared to "National Government" vote in 1940 election.
1940 Canadian federal election
Party
Candidate
Votes
%
Liberal Hughes Cleaver 7,788
55.7
+8.9
National Government George C. Atkins
6,184
44.3
+5.3
Total valid votes
13,972 100.0
Note: "National Government" vote is compared to Conservative vote in 1935 election.
1935 Canadian federal election
Party
Candidate
Votes
%
Liberal Hughes Cleaver 6,177
46.8
Conservative George Currie
5,146
39.0
-15.6
Reconstruction Melville Marks Robinson 1,876
14.2
Total valid votes
13,199 100.0
1930 Canadian federal election
Party
Candidate
Votes
%
Conservative Robert King Anderson 6,976
54.6
-4.5
Progressive James Waldbrook
5,806
45.4
Total valid votes
12,782 100.0
1926 Canadian federal election
Party
Candidate
Votes
%
Conservative Robert King Anderson 6,222
59.1
+3.6
Liberal William James Laird Hampshire
4,308
40.9
-3.6
Total valid votes
10,530 100.0
1925 Canadian federal election
Party
Candidate
Votes
%
Conservative Robert King Anderson 6,775
55.5
+12.2
Liberal Duncan Campbell
5,424
44.5
+14.4
Total valid votes
12,199 100.0
1921 Canadian federal election
Party
Candidate
Votes
%
Conservative Robert King Anderson 5,264
43.3
-26.9
Liberal William Franklin Fisher
3,649
30.0
+0.3
Progressive John Featherstone Ford
3,238
26.6
Total valid votes
12,151 100.0
Note: Conservative vote is compared to Government vote in 1917 election, and Liberal vote is compared to Opposition vote.
Note: Government vote is compared to Conservative vote in 1911 election, and Opposition vote is compared to Liberal vote.
1908 Canadian federal election
Party
Candidate
Votes
%
Conservative David Henderson 2,417
52.3
+0.7
Liberal William Spencer Harrison
2,205
47.7
Total valid votes
4,622 100.0
1900 Canadian federal election
Party
Candidate
Votes
%
Conservative David Henderson 2,379
51.6
+0.7
Liberal S.F. McKinnon
2,233
48.4
-0.7
Total valid votes
4,612 100.0
Note: indicates change in popular vote from to 1891 general election.
By-election on 28 January 1892
On the election having been declared 16 November 1891
Party
Candidate
Votes
Conservative David Henderson acclaimed
Canadian federal by-election, 22 August 1888
Party
Candidate
Votes
%
On Mr. Henderson being unseated for corrupt practices by agents
Liberal John Waldie 2,042
50.3
Conservative David Henderson 2,018
49.7
-1.4
Total valid votes
4,060 100.0
Canadian federal by-election, 7 February 1888
Party
Candidate
Votes
%
On Mr. Waldie being unseated, 19 January 1888, for bribery by agents
Conservative David Henderson 2,183
51.1
+1.2
Unknown
McLeod
2,086
48.9
Total valid votes
4,269 100.0
1887 Canadian federal election
Party
Candidate
Votes
%
Liberal John Waldie 2,222
50.1
-1.1
Conservative David Henderson 2,213
49.9
Total valid votes
4,435 100.0
1882 Canadian federal election
Party
Candidate
Votes
%
Liberal William McCraney 1,822
51.2
Unknown
Geo. C. McKindsey
1,739
48.8
Total valid votes
3,561 100.0
1878 Canadian federal election
Party
Candidate
Votes
%
Liberal–Conservative William McDougall 1,708
50.3
+2.3
Liberal William McCraney 1,690
49.7
-2.3
Total valid votes
3,398 100.0
On Mr. Chisholm being unseated, on petition, 8 December 1874:
By-election on 25 January 1875
Party
Candidate
Votes
%
±%
Liberal William McCraney 1,704
52.1
+2.5
Liberal–Conservative Daniel Black Chisholm 1,569
47.9
-2.5
Total valid votes
3,273 100.0
1874 Canadian federal election
Party
Candidate
Votes
%
Liberal–Conservative Daniel Black Chisholm 1,464
50.4
Liberal J. White
1,441
49.6
-2.9
Total valid votes
2,905 100.0
1872 Canadian federal election
Party
Candidate
Votes
%
Liberal John White 1,414
52.5
+0.1
Unknown
G.C. McKindsey
1,278
47.5
Total valid votes
2,692 100.0
See also [ ] References [ ] Notes [ ]
Federal ridings in Ontario
Central Eastern S Durham
City of Toronto Suburbs & Downtown )
Cities of Brampton &
Brampton
Brampton Centre Brampton East Brampton North Brampton South Brampton West Mississauga
Southern
Southwestern Halton City of Hamilton Niagara
Niagara Centre Niagara Falls Niagara West St. Catharines
Midwestern Northern Southwestern Ottawa See also : Provincial ridings in Ontario
Until 2015 Until 2006 Until 2004 Until 2000 Until 1997 Until 1993 Until 1988 Until 1984 Until 1979 Until 1974 Until 1972 Until 1968 Until 1953 Until 1949 Until 1935 Until 1925 Until 1917 Until 1904 Until 1896 Until 1882
Coordinates : 43°29′02″N 79°53′13″W / 43.484°N 79.887°W / 43.484; -79.887