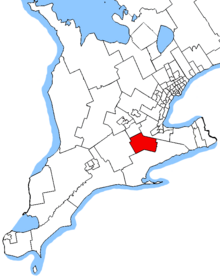
Brantford—Brant electoral district Brantford—Brant in relation to other Ontario electoral districts (2015 boundaries)
Legislature House of Commons MP Larry Brock Conservative District created 1903 First contested 1904 Last contested 2021 District webpage profile , map Population (2016 )[1] 130,296 Electors (2015)95,616 Area (km²)[2] 828.81 Pop. density (per km²) 157.2 Census division(s) Brant , Haldimand Census subdivision(s) Brantford , Brant , New Credit 40A , Six Nations 40
Brantford—Brant is a federal electoral district in Ontario , Canada, that has been represented in the House of Commons of Canada from 1904 to 1949 and since 1968.
Prior to the 2015 election , the riding was known as Brant .[3]
History [ ] The federal riding was first created in 1903 from parts of Brant South riding. It consisted of the County of Brant, excluding parts included in the Brantford riding.
In 1924, it was defined as consisting of the townships of Burford, South Dumfries, Onondaga, Tuscarora the part of the township of Brantford lying east of the Grand River, and the part of the city of Brantford not included in the electoral district of Brantford City. In 1933, it was expanded to include the town of Paris .
The federal electoral district was abolished in 1947 when it was redistributed between Brant—Wentworth and Brantford ridings.
The federal riding was recreated in 1966 from parts of Brant—Haldimand , Brantford and Haldimand—Norfolk—Brant ridings. It consisted initially of the County of Brant, and the Six Nations and New Credit Indian reserves .
In 1976, it was defined as consisting of the County of Brant. In 1987, it was defined as consisting of the City of Brantford, the Town of Paris, and the townships of Brantford and South Dumfries. In 2003, it was redefined as using the 1966 definition.
Brant was largely incorporated into the new riding of Brantford—Brant, with small territories going to Oxford and Cambridge during the 2012 electoral redistribution .
Demographics [ ] According to the Canada 2016 Census ; Ethnic groups: 78.3% European, 13.7% Indigenous, 2.6% South Asian, 1.7% Black Languages: 89.7% English, 1.3% Polish, 1.2% French, 1.0% ItalianReligions: 64.8% Christian (23.4% Catholic, 10.2% United Church, 9.0% Anglican, 5.1% Baptist, 3.3% Presbyterian, 2.5% Pentecostal, 1.1% Lutheran, 10.1% Other), 2.% Traditional Aboriginal Spirituality, 30.3% No religion Median income (2010): $28,981 Average income (2010): $37,101
Members of Parliament [ ] This riding has elected the following Members of Parliament :
Parliament
Years
Member
Party
BrantRiding created from Brant South
10th
1904–1908 William Paterson Liberal 11th
1908–1911 12th
1911–1917 John Henry Fisher Conservative 13th
1917–1921 John Harold Government (Unionist) 14th
1921–1925 William Charles Good Progressive 15th
1925–1926 Franklin Smoke Conservative 16th
1926–1930 17th
1930–1935 18th
1935–1940 George Wood Liberal 19th
1940–1945 20th
1945–1949 John A. Charlton Progressive Conservative
Riding dissolved into Brant—Wentworth and Brantford
BrantRiding re-created from Brant—Haldimand and Brantford
28th
1968–1971 James Elisha Brown Liberal
1971–1972 Derek Blackburn New Democratic
29th
1972–1974 30th
1974–1979 31st
1979–1980 32nd
1980–1984 33rd
1984–1988 34th
1988–1993 35th
1993–1997 Jane Stewart Liberal 36th
1997–2000 37th
2000–2004 38th
2004–2006 Lloyd St. Amand 39th
2006–2008 40th
2008–2011 Phil McColeman Conservative 41st
2011–2015
Brantford—Brant
42nd
2015–2019 Phil McColeman Conservative 43rd
2019–2021 44th
2021–present Larry Brock
Election results [ ] Brantford—Brant, 2015–present [ ] Graph of election results in Brantford—Brant (2011-, minor parties that never got 2% of the vote or didn't run consistently are omitted)
hide 2021 Canadian federal election
The 2021 general election will be held on September 20.
Party
Candidate
Votes
%
Independent Leslie Bory
Conservative Larry Brock
Green Karleigh Csordas
Liberal Alison Macdonald
New Democratic Adrienne Roberts
People's Cole Squire
Independent John Turmel
Total valid votes
Total rejected ballots
Turnout
Eligible voters
Source: Elections Canada [4]
hide 2019 Canadian federal election
Party
Candidate
Votes
%
Expenditures
Conservative Phil McColeman 26,849
40.27
-0.62
$85,964.44
Liberal Danielle Takacs
20,454
30.68
-0.01
$112,425.11
New Democratic Sabrina Sawyer
13,131
19.70
-5.14
$10,388.48
Green Bob Jonkman
4,257
6.39
+3.89
none listed
People's Dave Wrobel
1,320
1.98
–
none listed
Jeffrey Gallagher
394
0.59
–
none listed
Independent John Turmel 146
0.22
-0.04
$0.00
Independent Leslie Bory
115
0.17
–
$2,115.19
Total valid votes/Expense limit
66,666 99.26
Total rejected ballots
497 0.74 +0.31
Turnout
67,163 61.84 -3.39
Eligible voters
108,602
Conservative hold
Swing
-0.30
Source: Elections Canada [5] [6]
hide 2015 Canadian federal election
Party
Candidate
Votes
%
Expenditures
Conservative Phil McColeman 25,874
40.89
-7.52
$141,798.50
Liberal Danielle Takacs
19,422
30.70
+11.80
$76,160.00
New Democratic Marc Laferriere
15,715
24.84
-4.11
$65,824.80
Green Kevin Brandt
1,582
2.50
-0.70
$6,475.96
Libertarian Rob Ferguson
515
0.81
–
–
Independent John C. Turmel 164
0.26
–
–
Total valid votes/Expense limit
63,272 99.57 $241,022.79
Total rejected ballots
272 0.43 –
Turnout
63,544 65.23 –
Eligible voters
97,409
Conservative hold
Swing
-9.66
Source: Elections Canada [7] [8]
2011 federal election redistributed results[9]
Party
Vote
%
Conservative 26,668
48.41
New Democratic 15,946
28.95
Liberal 10,411
18.90
Green 1,756
3.20
Others
295
0.54
Brant, 1968–2015 [ ] Graph of election results in Brant (1968-2011, minor parties that never got 2% of the vote or didn't run consistently are omitted)
hide 2011 Canadian federal election
Party
Candidate
Votes
%
Expenditures
Conservative Phil McColeman 28,045
48.9
+7.0
–
New Democratic Marc Laferriere
16,351
28.5
+11.3
–
Liberal Lloyd St. Amand 10,780
18.8
-14.2
–
Green Nora Fueten
1,858
3.2
-3.8
–
Independent Leslie Bory
174
0.3
–
–
Independent Martin Sitko
138
0.2
–
–
Total valid votes
57,346 100.0 –
Total rejected ballots
243 0.4 –
Turnout
57,589 60.1 –
Eligible voters
94,485 – –
hide 2006 Canadian federal election
Party
Candidate
Votes
%
Liberal Lloyd St. Amand 22,077
36.9
-1.1
Conservative Phil McColeman 21,495
36.0
+2.9
New Democratic Lynn Bowering
12,713
21.3
-0.7
Green Adam King
2,729
4.6
-0.5
Christian Heritage John H. Wubs
526
0.9
-0.2
Independent John Turmel 213
0.4
-0.3
Total valid votes
59,753 100.0
hide 2006 Canadian federal election : Brant
Party
Candidate
Votes
%
Expenditures
Liberal Lloyd St. Amand 22,077
36.95
−1.10
$73,699
Conservative Phil McColeman 21,495
35.97
+2.87
$84,866
New Democratic Lynn Bowering
12,713
21.28
−0.72
$30,536
Green Adam King
2,729
4.57
−0.52
$4,293
Christian Heritage John H. Wubs
526
0.88
−0.18
Independent
John Turmel
213
0.36
−0.33
Total valid votes/Expense Limit
59,753 100.00 – $86,871
Total rejected ballots
236
Turnout
59,989 65.30 +5.02
Electors on the lists
91,872
Sources: Official Results, Elections Canada and Financial Returns, Elections Canada .
hide 2004 Canadian federal election : Brant
Party
Candidate
Votes
%
Expenditures
Liberal Lloyd St. Amand 20,455
38.05
−17.44
$70,476
Conservative Greg Martin
17,792
33.10
−2.14
$51,935
New Democratic Lynn Bowering
11,826
22.00
+14.80
$19,055
Green Helen-Anne Embry
2,738
5.09
+4.05
$1,800
Christian Heritage Barra L. Gots
570
1.06
$759
Independent John Turmel 373
0.69
none listed
Total valid votes
53,754 100.00
Total rejected ballots
303
Turnout
54,057 60.28 +4.70
Electors on the lists
89,675
Percentage change figures are factored for redistribution. Conservative Party percentages are contrasted with the combined Canadian Alliance and Progressive Conservative percentages from 2000.
Sources: Official Results, Elections Canada and Financial Returns, Elections Canada .
hide 2000 Canadian federal election : Brant
Party
Candidate
Votes
%
Expenditures
Liberal Jane Stewart 24,068
56.42
–
$46,551
Alliance Chris Cattle
10,955
25.68
$43,139
Progressive Conservative Stephen Kun
3,580
8.39
$6,405
New Democratic Dee Chisholm
3,126
7.33
$9,266
Green Graeme Dunn
484
1.13
$156
Canadian Action Mike Clancy
447
1.05
$8,881
Total valid votes/Expense Limit
42,660
100.00
Total rejected ballots
262
Turnout
42,922 56.28
Electors on the lists
76,270
Sources: Official Results, Elections Canada and Financial Returns, Elections Canada .
hide 1997 Canadian federal election
Party
Candidate
Votes
%
Liberal Jane Stewart 24,125
53.0
+1.5
Reform Dan Houssar
10,436
22.9
-1.8
Progressive Conservative Stephen W. Kun
5,781
12.7
+0.5
New Democratic Pat Franklin
5,201
11.4
+4.5
Total valid votes
45,543 100.0
hide 1993 Canadian federal election : Brant
Party
Candidate
Votes
%
Expenditures
Liberal Jane Stewart 24,686
51.46
–
$39,023
Reform Ken Edmison
11,863
24.73
$36,354
Progressive Conservative Mabel E. Dougherty
5,831
12.16
$25,624
New Democratic Michael C. Smith
3,317
6.92
$37,911
National Herman Kruis
1,227
2.56
$8,148
Green Jamie Legacey
482
1.00
$0
Libertarian Helmut Kurmis
258
0.54
$0
Natural Law Eleanor Toshiko Hyodo
192
0.40
$2,853
Social Credit Doug Stelpstra
112
0.23
$158
Total valid votes
47,968 100.00
Total rejected ballots
500
Turnout
48,468 65.27
Electors on the lists
74,260
Source: Thirty-fifth General Election, 1993: Official Voting Results, Published by the Chief Electoral Officer of Canada. Financial figures taken from official contributions and expenses provided by Elections Canada .
hide 1988 Canadian federal election : Brant
Party
Candidate
Votes
%
Expenditures
New Democratic Derek Blackburn 19,633
41.46
$41,490
Progressive Conservative Steve Bosanac
14,084
29.74
$45,061
Liberal David J. Carll
11,461
24.20
$40,772
Christian Heritage Geraldine de Vries
1,786
3.77
$10,857
Green Jamie Legacey
258
0.54
$0
Libertarian Helmut Kurmis
95
0.20
$299
Commonwealth of Canada Barnabas Simon
34
0.07
$0
Total valid votes
47,351 100.00
Total rejected ballots
287
Turnout
47,638 71.53
Electors on the lists
66,603
hide 1984 Canadian federal election : Brant
Party
Candidate
Votes
%
New Democratic Derek Blackburn 23,103
44.20
Progressive Conservative Rick Sterne
21,679
41.47
Liberal Peter Hexamer
7,286
13.94
Social Credit Charley Harris
207
0.40
Total valid votes
52,275
100.00
Total rejected ballots
266
Turnout
52,541
73.16
Electors on the lists
71,821
hide 1980 Canadian federal election
Party
Candidate
Votes
%
New Democratic Derek Blackburn 19,194
41.1
-1.1
Progressive Conservative Rick Sterne
14,614
31.3
+0.2
Liberal Jo Brennan
12,725
27.2
+0.7
Social Credit Winnifred M. Moyer
103
0.2
Marxist–Leninist Malkit Randhawa
93
0.2
0.0
Total valid votes
46,729 100.0
hide 1979 Canadian federal election
Party
Candidate
Votes
%
New Democratic Derek Blackburn 20,908
42.2
+0.1
Progressive Conservative Arthur Tobey
15,422
31.1
+11.2
Liberal Jack Bawcutt
13,154
26.5
-11.1
Marxist–Leninist Malkit Randhawa
93
0.2
Total valid votes
49,577 100.0
hide 1974 Canadian federal election
Party
Candidate
Votes
%
New Democratic Derek Blackburn 19,453
42.1
-1.0
Liberal Vern Young
17,410
37.6
+5.9
Progressive Conservative Alex Keresturi
9,228
20.0
-5.3
Communist Paul F. Jarbeau
158
0.3
Total valid votes
46,249 100.0
hide 1972 Canadian federal election
Party
Candidate
Votes
%
New Democratic Derek Blackburn 20,002
43.1
0.0
Liberal Dick Mundy
14,730
31.7
-0.5
Progressive Conservative Alex Keresturi
11,711
25.2
+1.3
Total valid votes
46,443 100.0
By-election on May 31, 1971
Party
Candidate
Votes
%
±%
New Democratic Derek Blackburn 17,147
43.1
+12.4
Liberal Bob McIntosh
12,831
32.2
-7.6
Progressive Conservative Emory Knill
9,517
23.9
-5.7
Social Credit A.J. Sid Hamelin
322
0.8
Total valid votes
39,817 100.0
hide 1968 Canadian federal election
Party
Candidate
Votes
%
Liberal James Elisha Brown 16,029
39.8
New Democratic Derek Blackburn 12,333
30.6
Progressive Conservative Geoff Styles
11,901
29.6
Total valid votes
40,263 100.0
Brant, 1904–1949 [ ] Graph of election results in Brant (1904-1949, minor parties that never got 2% of the vote or didn't run consistently are omitted)
hide 1945 Canadian federal election
Party
Candidate
Votes
%
Progressive Conservative John Alpheus Charlton 5,005
45.3
-3.9
Liberal George Ernest Wood 4,800
43.5
-7.3
Co-operative Commonwealth Charles William Ward
1,235
11.2
Total valid votes
11,040 100.0
hide 1940 Canadian federal election
Party
Candidate
Votes
%
Liberal George Wood 4,657
50.8
+6.3
National Government Syl Apps 4,519
49.2
+12.1
Total valid votes
9,176 100.0
Note: "National Government" vote is compared to Conservative vote in 1935 election.
hide 1935 Canadian federal election
Party
Candidate
Votes
%
Liberal George Ernest Wood 4,294
44.5
-1.7
Conservative Franklin Smoke 3,587
37.2
-16.7
Reconstruction Cuthbert Mainwaring Burt
1,277
13.2
Co-operative Commonwealth William James Anderson
494
5.1
Total valid votes
9,652 100.0
hide 1930 Canadian federal election
Party
Candidate
Votes
%
Conservative Franklin Smoke 5,094
53.8
+2.9
Liberal John Harold 4,372
46.2
-2.9
Total valid votes
9,466 100.0
hide 1926 Canadian federal election
Party
Candidate
Votes
%
Conservative Franklin Smoke 4,218
50.9
-5.8
Liberal–Progressive Thomas Scott Davidson
4,065
49.1
+5.8
Total valid votes
8,283 100.0
hide 1925 Canadian federal election
Party
Candidate
Votes
%
Conservative Franklin Smoke 4,151
56.7
+17.8
Progressive Edgar Howard Standing
3,173
43.3
+2.5
Total valid votes
7,324 100.0
hide 1921 Canadian federal election
Party
Candidate
Votes
%
Progressive William Charles Good 3,309
40.8
+2.0
Conservative William Harper Reid
3,150
38.9
+0.1
Liberal Robert John Atkin
1,645
20.3
-3.6
Total valid votes
8,104 100.0
Note: Conservative vote is compared to Unionist vote in 1917 election, and Liberal vote is compared to Opposition vote.
hide 1917 Canadian federal election
Party
Candidate
Votes
%
Government (Unionist) John Harold 2,106
38.8
-13.1
Independent Henry Cockshutt 2,023
37.3
Opposition (Laurier Liberals) Blackwell Lawrence Doran
1,299
23.9
-24.2
Total valid votes
5,428 100.0
Note: Unionist vote is compared to Conservative vote in 1911 election.
hide 1908 Canadian federal election
Party
Candidate
Votes
%
Liberal William Paterson 1,799
53.7
-4.8
Conservative John Patrick Noonan
1,554
46.3
Total valid votes
3,353 100.0
See also [ ] References [ ] Notes [ ] External links [ ] show Federal ridings in Midwestern Ontario
Liberal Conservative
show Federal ridings in Ontario
Central Eastern S Durham
City of Toronto Suburbs & Downtown )
Cities of Brampton &
Brampton
Brampton Centre Brampton East Brampton North Brampton South Brampton West Mississauga
Southern
Southwestern Halton City of Hamilton Niagara
Niagara Centre Niagara Falls Niagara West St. Catharines
Midwestern Northern Southwestern Ottawa See also : Provincial ridings in Ontario
show Historical federal ridings in Ontario
Until 2015 Until 2006 Until 2004 Until 2000 Until 1997 Until 1993 Until 1988 Until 1984 Until 1979 Until 1974 Until 1972 Until 1968 Until 1953 Until 1949 Until 1935 Until 1925 Until 1917 Until 1904 Until 1896 Until 1882
Coordinates : 43°07′N 80°15′W / 43.12°N 80.25°W / 43.12; -80.25