Mississauga—Lakeshore
This article includes a list of general references, but it remains largely unverified because it lacks sufficient corresponding inline citations. (January 2014) |
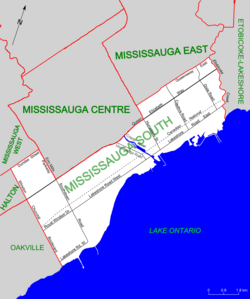
 Mississauga South in relation to the other Mississauga ridings | |||
| Federal electoral district | |||
| Legislature | House of Commons | ||
| MP |
Liberal | ||
| District created | 1976 | ||
| First contested | 1979 | ||
| Last contested | 2021 | ||
| District webpage | profile, map | ||
| Demographics | |||
| Population (2011)[1] | 118,893 | ||
| Electors (2015) | 85,379 | ||
| Area (km²)[2] | 92 | ||
| Pop. density (per km²) | 1,292.3 | ||
| Census division(s) | Peel | ||
| Census subdivision(s) | Mississauga | ||
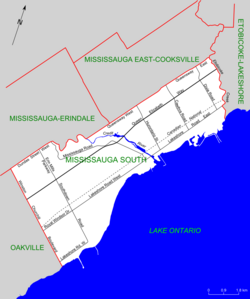
Mississauga—Lakeshore (formerly Mississauga South) is a federal electoral district in the Peel Region of Ontario, Canada. It has been represented in the House of Commons of Canada since 1979.
Geography[]
The riding includes the Mississauga neighbourhoods of Clarkson, Lakeview, Lorne Park, , Port Credit, , Sheridan Park, and parts of Erindale and Cooksville.
Political geography[]
Conservative support is centred in the interior of the riding, particularly in the upscale Lorne Park area, while the Liberals and the NDP tend to do better along the waterfront of the riding, such as Port Credit and Lakeview, and the eastern and western edges of the riding.
History[]
The federal riding was created in 1976 from parts of Mississauga and Mississauga Centre ridings.
It consisted initially of the part of the City of Mississauga lying south of a line drawn from west to east along Highway 5, south along Cawthra Road, and east along the Queen Elizabeth Way.
In 1987, it was redefined to consist of the part of the City of Mississauga lying south of a line drawn from southwest to northeast along Dundas Street West, east along the Credit River, northeast along the Queen Elizabeth Way, northwest along Cawthra Road, and northeast along the Queensway East to the eastern city limit.
In 1996, it was redefined to consist of the part of the City of Mississauga lying south of a line drawn from southwest to northeast along Dundas Street West, southeast along Erin Mills Parkway, northeast along the Queen Elizabeth Way, northwest along Hurontario Street, northeast along the Queensway East to the northeastern city limit.
In 2003, it was given its current boundaries as described above.
In 2013, the riding gained the area around , and was renamed Mississauga—Lakeshore. It was defined to consist of the part of the City of Mississauga lying southeast of a line drawn from northeast to southwest along the Queensway to Mavis Road, north along Mavis Road until Dundas Street and west along Dundas Street to the southwestern city limit.
Since the 2015 Canadian Federal election, the Liberal Party of Canada has succeeded in holding Mississauga-Lakeshore as they have done in 2015, 2019 and 2021 elections with significant margins over 45%. This trend is aligned with the continued Liberal Party of Canada's dominance of Greater Toronto Area politics and seats.
Electoral history[]
The Mississauga South riding and its precursors, while being more competitive than in provincial elections, still has a generally conservative history, and despite voting Liberal since 1993, could be described as a small "c" conservative riding. The Progressive Conservatives held the riding from creation its first election in 1979 under Don Blenkarn, (who served as MP for Peel South, one of the precursor ridings between 1972–1974), until 1993, when he was defeated by Paul Szabo. With the exception of the 1988 election, Szabo has been the Liberal candidate in all election between 1980 (an election he almost won) and 2011.
The riding voting Liberal in 1993 can in part be blamed by vote-splitting on the right, as Blenkarn was knocked into third place by the Reform Party candidate, although both were far behind Szabo, who only marginally improved on the Liberal performance from 1988, winning 37%, only 2% more than the 1988 Liberal result, and less than the combined vote total for the two right-wing parties. Szabo however greatly increased his percentage of the vote in the elections afterward, winning over 50% in every election from 1997–2004, despite facing a united right-wing vote in 2004.
In the 2006 election Szabo and the Liberals were re-elected again; however, the Liberal vote dropped sharply, with the Conservatives coming within 5% of winning the riding, getting 40% of the vote, one of the best performances for them in the Greater Toronto Area. The riding was generally assumed to be a top Tory target for the next election; however, the drawn out and somewhat acrimonious nature of the Conservative nomination process, and Szabo's increased profile as a result of his chairmanship of the House of Commons Ethics committee may have damaged Conservative attempts to capture the riding. Despite the Conservatives strengthening in the 2008 election overall, Arrison was unable to defeat Szabo, and Mississauga South was one of the few ridings outside Quebec where the Liberal Party increased the percentage of the vote received from 2006 (albeit very slightly).
From 2006 to 2015 the riding was held by the Conservatives, however, starting in 2015 as a part of the overall Liberal dominance of Greater Toronto Area seats and ridings, the riding has gone and stayed Liberal. Incumbent Sven Spengemann successfully defeated Conservative Stella Ambler in 2015 and 2019 and Conservative challenger Michael Ras in the 2021 snap election.
Riding associations[]
Riding associations are the local branches of political parties:
| Party | Association name | CEO | HQ address | |
| Conservative | Mississauga—Lakeshore Conservative Association | Brian J. Schmidt | 1801 Lakeshore Road West | |
| Liberal | Mississauga—Lakeshore Federal Liberal Association | |||
| New Democratic | Mississauga—Lakeshore Federal NDP Riding Association | Eric S. Guerbilsky | 44 Park Street East | |
Members of Parliament[]
This riding has elected the following members of the House of Commons of Canada:
| Parliament | Years | Member | Party | |
|---|---|---|---|---|
| Mississauga South Riding created from Mississauga and Mississauga Centre |
||||
| 31st | 1979–1980 | Don Blenkarn | Progressive Conservative | |
| 32nd | 1980–1984 | |||
| 33rd | 1984–1988 | |||
| 34th | 1988–1993 | |||
| 35th | 1993–1997 | Paul Szabo | Liberal | |
| 36th | 1997–2000 | |||
| 37th | 2000–2004 | |||
| 38th | 2004–2006 | |||
| 39th | 2006–2008 | |||
| 40th | 2008–2011 | |||
| 41st | 2011–2015 | Stella Ambler | Conservative | |
| Mississauga—Lakeshore | ||||
| 42nd | 2015–2019 | Sven Spengemann | Liberal | |
| 43rd | 2019–2021 | |||
| 44th | 2021–present | |||
Election results[]
| 2021 Canadian federal election | ||||||||
|---|---|---|---|---|---|---|---|---|
| Party | Candidate | Votes | % | ±% | ||||
| Liberal | Sven Spengemann | 25,284 | 44.94 | -3.14 | ||||
| Conservative | Michael Ras | 21,761 | 38.68 | +1.65 | ||||
| New Democratic | Sarah Walji | 5,488 | 9.75 | +1.44 | ||||
| People's | Vahid Seyfaie | 2,367 | 4.21 | +3.04 | ||||
| Green | Elizabeth Robertson | 1,265 | 2.25 | -2.33 | ||||
| Rhinoceros | Kayleigh Tahk | 94 | 0.17 | - | ||||
| Total valid votes | 56,259 | |||||||
| Total rejected ballots | 524 | 0.92 | ||||||
| Turnout | 56,783 | 63.82 | ||||||
| Eligible voters | 88,977 | |||||||
| Source: Elections Canada[3] | ||||||||
| 2019 Canadian federal election | ||||||||
|---|---|---|---|---|---|---|---|---|
| Party | Candidate | Votes | % | ±% | Expenditures | |||
| Liberal | Sven Spengemann | 29,526 | 48.08 | +0.37 | $104,588.59 | |||
| Conservative | Stella Ambler | 22,740 | 37.03 | -4.19 | $110,262.85 | |||
| New Democratic | Adam Laughton | 5,103 | 8.31 | +0.32 | none listed | |||
| Green | Cynthia Trentelman | 2,814 | 4.58 | +2.22 | $2,524.73 | |||
| People's | Eugen Vizitiu | 717 | 1.17 | - | none listed | |||
| United | Carlton Darby | 99 | 0.16 | - | $0.00 | |||
| Total valid votes | 61,406 | |||||||
| Total rejected ballots | 407 | 0.66 | ||||||
| Turnout | 61,813 | 68.36 | ||||||
| Eligible voters | 90,419 | |||||||
| Liberal hold | Swing | +0.37 | ||||||
| Source: Elections Canada[4][5] | ||||||||
| 2015 Canadian federal election | ||||||||
|---|---|---|---|---|---|---|---|---|
| Party | Candidate | Votes | % | ±% | Expenditures | |||
| Liberal | Sven Spengemann | 28,279 | 47.71 | +10.86 | $74,169.40 | |||
| Conservative | Stella Ambler | 24,435 | 41.22 | -5.68 | $221,638.11 | |||
| New Democratic | Eric Guerbilsky | 4,735 | 7.99 | -4.80 | $6,908.86 | |||
| Green | Ariana Burgener | 1,397 | 2.36 | -0.72 | $1,924.23 | |||
| Libertarian | Paul Wodworth | 316 | 0.53 | - | $1,166.63 | |||
| Marxist–Leninist | Dagmar Sullivan | 111 | 0.19 | - | ||||
| Total valid votes/expense limit | 59,273 | 100.00 | - | $224,818.71 | ||||
| Total rejected ballots | 271 | 0.46 | ||||||
| Turnout | 59,544 | 68.99 | ||||||
| Eligible voters | 86,308 | |||||||
| Liberal gain from Conservative | Swing | +8.27 | ||||||
| 2011 federal election redistributed results[6] | |||
|---|---|---|---|
| Party | Vote | % | |
| Conservative | 24,269 | 46.91 | |
| Liberal | 19,068 | 36.85 | |
| New Democratic | 6,616 | 12.79 | |
| Green | 1,592 | 3.08 | |
| Others | 195 | 0.38 | |
| 2011 Canadian federal election | ||||||||
|---|---|---|---|---|---|---|---|---|
| Party | Candidate | Votes | % | ±% | Expenditures | |||
| Conservative | Stella Ambler | 22,991 | 46.48 | +6.90 | ||||
| Liberal | Paul Szabo | 18,393 | 37.18 | -7.04 | ||||
| New Democratic | Farah Kalbouneh | 6,354 | 12.85 | +4.01 | ||||
| Green | Paul Simas | 1,532 | 3.10 | -4.24 | ||||
| Independent | Richard Barrett | 194 | 0.39 | – | ||||
| Total valid votes | 49,464 | 100.00 | ||||||
| Total rejected ballots | 188 | 0.38 | +0.05 | |||||
| Turnout | 49,652 | 63.89 | +3.81 | |||||
| Eligible voters | 77,716 | – | – | |||||
| 2008 Canadian federal election | ||||||||
|---|---|---|---|---|---|---|---|---|
| Party | Candidate | Votes | % | ±% | Expenditures | |||
| Liberal | Paul Szabo | 20,518 | 44.22 | +0.3 | $70,011 | |||
| Conservative | Hugh Arrison | 18,366 | 39.58 | -0.2 | $81,878 | |||
| New Democratic | Matt Turner | 4,104 | 8.84 | -2.5 | $1,722 | |||
| Green | Richard Laushway | 3,407 | 7.34 | +1.8 | $9,008 | |||
| Total valid votes/Expense limit | 46,395 | 100.00 | $84,179 | |||||
| Total rejected ballots | 155 | 0.33 | ||||||
| Turnout | 46,550 | 60.08 | ||||||
| 2006 Canadian federal election | ||||||||
|---|---|---|---|---|---|---|---|---|
| Party | Candidate | Votes | % | ±% | ||||
| Liberal | Paul Szabo | 22,975 | 43.9 | -7.8 | ||||
| Conservative | Phil Green | 20,827 | 39.8 | +6.2 | ||||
| New Democratic | Mark De Pelham | 5,898 | 11.3 | +0.8 | ||||
| Green | Brendan Tarry | 2,377 | 4.5 | +0.5 | ||||
| Canadian Action | Paul McMurray | 129 | 0.2 | |||||
| Marxist–Leninist | Dagmar Sullivan | 74 | 0.1 | |||||
| Total valid votes | 52,280 | 100.0 | ||||||
| 2004 Canadian federal election | ||||||||
|---|---|---|---|---|---|---|---|---|
| Party | Candidate | Votes | % | ±% | ||||
| Liberal | Paul Szabo | 24,628 | 51.7 | -0.1 | ||||
| Conservative | Phil Green | 16,027 | 33.6 | -9.0 | ||||
| New Democratic | Michael James Culkin | 5,004 | 10.5 | +6.4 | ||||
| Green | Neeraj Jain | 1,899 | 4.0 | +2.7 | ||||
| Marxist–Leninist | Dagmar Sullivan | 107 | 0.2 | +0.1 | ||||
| Total valid votes | 47,665 | 100.0 | ||||||
Note: Conservative vote is compared to the total of the Canadian Alliance vote and Progressive Conservative vote in 2000 election.
| 2000 Canadian federal election | ||||||||
|---|---|---|---|---|---|---|---|---|
| Party | Candidate | Votes | % | ±% | ||||
| Liberal | Paul Szabo | 20,676 | 51.8 | +1.8 | ||||
| Alliance | Brad Butt | 10,139 | 25.4 | +5.8 | ||||
| Progressive Conservative | David Brown | 6,903 | 17.3 | -6.4 | ||||
| New Democratic | Ken Cole | 1,636 | 4.1 | -1.3 | ||||
| Green | Pamela Murray | 516 | 1.3 | |||||
| Marxist–Leninist | Tim Sullivan | 67 | 0.2 | 0.0 | ||||
| Total valid votes | 39,937 | 100.0 | ||||||
Note: Canadian Alliance vote is compared to the Reform vote in 1997 election.
| 1997 Canadian federal election | ||||||||
|---|---|---|---|---|---|---|---|---|
| Party | Candidate | Votes | % | ±% | ||||
| Liberal | Paul Szabo | 21,207 | 49.9 | +3.4 | ||||
| Progressive Conservative | Dick Barr | 10,077 | 23.7 | +0.4 | ||||
| Reform | Joe Peschisolido | 8,307 | 19.6 | -5.6 | ||||
| New Democratic | Jessica Lott | 2,302 | 5.4 | +3.3 | ||||
| Natural Law | Scott Kay | 199 | 0.5 | 0.0 | ||||
| Canadian Action | Aaron Gervais | 150 | 0.4 | |||||
| Independent | Adrian Earl Crewson | 141 | 0.3 | |||||
| Marxist–Leninist | Dagmar Sullivan | 79 | 0.2 | +0.1 | ||||
| Total valid votes | 42,462 | 100.0 | ||||||
| 1993 Canadian federal election | ||||||||
|---|---|---|---|---|---|---|---|---|
| Party | Candidate | Votes | % | ±% | ||||
| Liberal | Paul Szabo | 21,480 | 46.6 | +11.9 | ||||
| Reform | John Veenstra | 11,591 | 25.1 | |||||
| Progressive Conservative | Don Blenkarn | 10,763 | 23.3 | -28.6 | ||||
| New Democratic | Lili V. Weemen | 988 | 2.1 | -9.8 | ||||
| National | Albina Burello | 452 | 1.0 | |||||
| Libertarian | Richard Barrett | 429 | 0.9 | +0.3 | ||||
| Natural Law | Jeffrey graduate Dods | 234 | 0.5 | |||||
| Independent | Michael John Charette | 124 | 0.3 | |||||
| Marxist–Leninist | Dagmar Sullivan | 49 | 0.1 | |||||
| Total valid votes | 46,110 | 100.0 | ||||||
| 1988 Canadian federal election | ||||||||
|---|---|---|---|---|---|---|---|---|
| Party | Candidate | Votes | % | ±% | ||||
| Progressive Conservative | Don Blenkarn | 24,482 | 51.9 | -4.5 | ||||
| Liberal | Gil Gillespie | 16,362 | 34.7 | +5.8 | ||||
| New Democratic | Sue Craig | 5,643 | 12.0 | -2.7 | ||||
| Rhinoceros | Marc Currie | 332 | 0.7 | |||||
| Libertarian | Vay Jonynas | 297 | 0.6 | |||||
| Commonwealth of Canada | Patrick Descoteaux | 59 | 0.1 | |||||
| Total valid votes | 47,175 | 100.0 | ||||||
| 1984 Canadian federal election | ||||||||
|---|---|---|---|---|---|---|---|---|
| Party | Candidate | Votes | % | ±% | ||||
| Progressive Conservative | Don Blenkarn | 32,946 | 56.4 | +15.0 | ||||
| Liberal | Paul Szabo | 16,874 | 28.9 | -11.6 | ||||
| New Democratic | Norm Jones | 8,584 | 14.7 | -2.1 | ||||
| Total valid votes | 58,404 | 100.0 | ||||||
| 1980 Canadian federal election | ||||||||
|---|---|---|---|---|---|---|---|---|
| Party | Candidate | Votes | % | ±% | ||||
| Progressive Conservative | Don Blenkarn | 21,480 | 41.4 | -7.5 | ||||
| Liberal | Paul Szabo | 21,007 | 40.5 | +6.4 | ||||
| New Democratic | Neil Davis | 8,711 | 16.8 | +0.6 | ||||
| Libertarian | Ian F. Darwin | 405 | 0.8 | +0.4 | ||||
| Independent | Tom Smith | 110 | 0.2 | 0.0 | ||||
| Independent | Michael John Charette | 78 | 0.2 | |||||
| Marxist–Leninist | Tim Sullivan | 31 | 0.1 | -0.1 | ||||
| Total valid votes | 51,822 | 100.0 | ||||||
| 1979 Canadian federal election | ||||||||
|---|---|---|---|---|---|---|---|---|
| Party | Candidate | Votes | % | |||||
| Progressive Conservative | Don Blenkarn | 26,802 | 48.9 | |||||
| Liberal | Peg Holloway | 18,710 | 34.1 | |||||
| New Democratic | Colin Baynes | 8,869 | 16.2 | |||||
| Libertarian | Robert Sproule | 236 | 0.4 | |||||
| Independent | Tom Smith | 104 | 0.2 | |||||
| Marxist–Leninist | Barbara Nunn | 74 | 0.1 | |||||
| Total valid votes | 54,795 | 100.0 | ||||||
See also[]
- List of Canadian federal electoral districts
- Past Canadian electoral districts
References[]
- "(Code 35050) Census Profile". 2011 census. Statistics Canada. 2012. Retrieved March 3, 2011.
- federal riding history from the Library of Parliament
- 2011 Results from Elections Canada
- Campaign expense data from Elections Canada
Notes[]
- ^ Statistics Canada: 2011
- ^ Statistics Canada: 2011
- ^ "List of confirmed candidates – September 20, 2021 Federal Election". Elections Canada. Retrieved September 2, 2021.
- ^ "List of confirmed candidates". Elections Canada. Retrieved October 4, 2019.
- ^ "Election Night Results". Elections Canada. Retrieved November 4, 2019.
- ^ Pundits' Guide to Canadian Elections
External links[]
- Tom Simpson's Campaign for the Conservative Nomination in Mississauga South
- Paul Simas, Green Party of Canada Candidate in Mississauga South
- Green Party of Canada electoral district association for Mississauga South
Coordinates: 43°33′14″N 79°36′36″W / 43.554°N 79.610°W

- Ontario federal electoral districts
- Politics of Mississauga
- 1976 establishments in Ontario