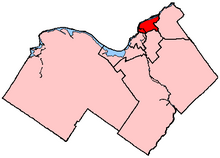
Federal electoral district in Ontario, Canada
Ottawa—Vanier (formerly known as Ottawa East ) is a federal electoral district in Ontario , Canada, that has been represented in the House of Commons of Canada since 1935 . Previous to that date, it was part of the Ottawa electoral district that returned two members.
The riding generally corresponds to the wards of Beacon Hill-Cyrville , Rideau-Rockcliffe and Rideau-Vanier .
The riding became vacant because of the death of incumbent MP Mauril Bélanger on August 16, 2016. Mona Fortier was elected in the byelection to fill the seat on April 3, 2017.[2]
The riding, with a large Franco-Ontarian population in Vanier , is one of the most solidly Liberal in the country, having elected Liberals both federally and provincially in every election since its creation. In fact, the previous electoral district which comprises most of the constituency, Russell , had been solidly Liberal since 1887. The riding is home to many civil servants .
Political geography [ ] About 15% of the riding is in the former city of Vanier, which was amalgamated into Ottawa in 2001. Vanier has long been home to much of Ottawa's francophone population, a group that has traditionally been solidly Liberal. The riding also contains the wealthiest part of Ottawa, the former village Rockcliffe Park , which has supported both the Conservatives , and the Liberals in recent elections. The anglophone middle class neighbourhoods of Sandy Hill , containing the University of Ottawa , and New Edinburgh also tend to vote Liberal, but with significant support for the New Democratic Party . In 2011, the NDP won Sandy Hill, Lower Town , Vanier and in Overbrook . The Conservatives won in the more suburban parts of the riding like in Beacon Hill and Pineview .
Geography [ ] In 2003, it was redefined as the part of the City of Ottawa east and north of a line running south along the Rideau Canal from the interprovincial boundary to Mann Avenue, northeast to Nicholas Street , southeast to Highway 417 , and east to the abandoned Canadian Pacific Railway to the hydroelectric transmission line, north to Innes Road , northeast to Blair Road , northwest to Montreal Road , east and northeast to Regional Road 174 , northeast to Green's Creek , north to the Ottawa River .
Demographics [ ] Average family income: $92,457[3] Median household income: $45,506 [4] Unemployment: 6.8%[4] Language, Mother Tongue: English 44%, French 32%, Other 24%Religion: Catholic 54%, Protestant 19%, Muslim 6%, Orthodox Christian 1%, Other Christian 1%, Non Religious Affiliation 14%, Other 5% [5] Visible Minority: Black 7%, Arab 3%, Chinese 2%, South Asian 2%, Latin American 1%, Others 5%[5] History [ ] The federal riding was created as "Ottawa East" in 1933 from parts of Ottawa and Russell ridings.
It initially consisted of, in the city of Ottawa, Rideau, Ottawa, By, St. Georges wards and the northeast part of Riverdale Ward, the town of Eastview, and the village of Rockcliffe Park.
In 1947, it was redefined to exclude the town of Eastview. In 1952, it was redefined to consist of the village of Rockcliffe Park, and the eastern parts of the city of Ottawa. In 1966, it was redefined to include the City of Eastview and exclude the village of Rockcliffe Park.
The name of the electoral district was changed in 1973 to "Ottawa—Vanier".
In 1976, it was redefined to consist of the City of Vanier, and the eastern parts of the city of Ottawa. In 1987, it was redefined to consist of the City of Vanier, the eastern part of the city of Ottawa, part of the city of Gloucester and the Village of Rockcliffe Park. In 1996, the Ottawa and Gloucester parts of the riding were redefined.
In 2003, it was given its current boundaries that are described above.
Following the Canadian federal electoral redistribution, 2012 , the riding gained the neighbourhood of from Ottawa—Orléans .
Members of Parliament [ ] This riding has elected the following Members of Parliament :
Parliament
Years
Member
Party
Ottawa EastRiding created from Ottawa and Russell
18th
1935–1936 Edgar-Rodolphe-Eugène Chevrier Liberal
1936–1940 Joseph-Albert Pinard
19th
1940–1945 20th
1945–1949 Jean-Thomas Richard 21st
1949–1953 22nd
1953–1957 23rd
1957–1958 24th
1958–1962 25th
1962–1963 26th
1963–1965 27th
1965–1968 28th
1968–1972 29th
1972–1974 Jean-Robert Gauthier
Ottawa—Vanier
30th
1974–1979 Jean-Robert Gauthier Liberal 31st
1979–1980 32nd
1980–1984 33rd
1984–1988 34th
1988–1993 35th
1993–1994
1995–1997 Mauril Bélanger
36th
1997–2000 37th
2000–2004 38th
2004–2006 39th
2006–2008 40th
2008–2011 41st
2011–2015 42nd
2015–2016
2017–2019 Mona Fortier
43rd
2019–2021 44th
2021–present
Election results [ ] Graph of election results in Ottawa—Vanier/Ottawa East (since 1940, minor parties that never got 2% of the vote or didn't run consistently are omitted)
Ottawa—Vanier [ ]
2021 Canadian federal election
The 2021 general election will be held on September 20.
Party
Candidate
Votes
%
Liberal Mona Fortier 28,462
49.0
-2.2
New Democratic Lyse-Pascale Inamuco
13,703
23.6
+2.4
Conservative Heidi Jensen
11,611
20.0
+2.6
People's Jean-Jacques Desgranges
1,855
3.2
+1.5
Green Christian Proulx
1,816
3.1
-4.4
Libertarian Daniel Elford
248
0.4
Free Crystelle Bourguignon
179
0.3
Independent Marie-Chantal TaiEl Leriche
157
0.3
Total valid votes
58,031
Total rejected ballots
576
Turnout
58,607 65.80
Eligible voters
89,069
Source: Elections Canada [6]
2019 Canadian federal election
Party
Candidate
Votes
%
Expenditures
Liberal Mona Fortier 32,679
51.2
0
$76,159.78
New Democratic Stéphanie Mercier
13,516
21.2
-7.5
none listed
Conservative Joel Bernard 11,118
17.4
+2
$18,239.00
Green Oriana Ngabirano
4,796
7.5
+4.2
$8,669.23
People's Paul Durst
1,064
1.7
$6,338.44
Rhinoceros Derek Miller
229
0.4
$0.00
Independent Joel Altman
211
0.3
$281.93
Communist Michelle Paquette
115
0.2
$496.90
Independent Daniel James McHugh
94
0.1
$0.00
Marxist–Leninist Christian Legeais
59
0.1
$0.00
Total valid votes/expense limit
63,881 100.0
Total rejected ballots
699
Turnout
64,580 71.0
Eligible voters
91,015
Liberal hold
Swing
+3.75
Source: Elections Canada [7] [8]
Mauril Bélanger
Party
Candidate
Votes
%
Liberal Mona Fortier 15,190
51.20
−6.37
New Democratic Emilie Taman
8,523
28.73
+9.48
Conservative Adrian Paul Papara
4,578
15.43
−3.68
Green Nira Dookeran
987
3.33
+0.26
Independent John Turmel 153
0.52
Libertarian Damien Wilson
137
0.46
−0.33
Independent Christina Wilson
99
0.33
Total valid votes/Expense limit
29,667 100.0 –
Total rejected ballots
-
Turnout
Eligible voters
86,998
Liberal hold
Swing
−7.91
2015 Canadian federal election
Party
Candidate
Votes
%
Expenditures
Liberal Mauril Bélanger 36,474
57.57
+19.47
$163,698.89
New Democratic Emilie Taman
12,194
19.25
-9.43
$123,293.39
Conservative David Piccini 12,109
19.11
-8.84
$74,698.91
Green Nira Dookeran
1,947
3.07
-1.99
$8,775.54
Libertarian Coreen Corcoran
503
0.79
–
$747.12
Marxist–Leninist Christian Legeais
128
0.2
-0.03
–
Total valid votes/Expense limit
63,355 100.0 $219,479.72
Total rejected ballots
418 – –
Turnout
63,773 – –
Eligible voters
83,570
Source: Elections Canada [9] [10]
2011 federal election redistributed results[11]
Party
Vote
%
Liberal 21,417
38.10
New Democratic 16,126
28.68
Conservative 15,711
27.95
Green 2,843
5.06
Marxist–Leninist 122
0.22
2011 Canadian federal election
Party
Candidate
Votes
%
Expenditures
Liberal Mauril Bélanger 20,009
38.17
-8.03
New Democratic Trevor Haché
15,391
29.36
+12.30
Conservative Rem Westland
14,184
27.06
-0.22
Green Caroline Rioux
2,716
5.18
-3.40
Marxist–Leninist Christian Legeais
122
0.23
-0.02
Total valid votes/Expense limit
52,422 100.00
Total rejected ballots
316 0.60 +0.07
Turnout
52,738 68.24 +4.20
2008 Canadian federal election
Party
Candidate
Votes
%
Expenditures
Liberal Mauril Bélanger 23,948
46.20
+3.89
$79,668
Conservative Patrick Glémaud
14,138
27.28
-1.39
$53,405
New Democratic Trevor Haché
8,845
17.06
-4.75
$30,040
Green Akbar Manoussi
4,447
8.58
+1.98
$3,842
Independent Robert Larter
227
0.44
–
Marxist–Leninist Christian Legeais
130
0.25
+0.04
Canadian Action Michel St-Onge
100
0.19
–
$149
Total valid votes/Expense limit
51,835 100.00 $85,605
Total rejected ballots
277 0.53
Turnout
52,112 64.04
Liberal hold
Swing
+2.64
2006 Canadian federal election
Party
Candidate
Votes
%
Liberal Mauril Bélanger 23,567
42.31
-6.86
Conservative Paul Benoit
15,970
28.67
+4.48
New Democratic Ric Dagenais
12,145
21.81
+3.27
Green Raphaël Thierrin
3,675
6.60
-0.27
Progressive Canadian James C. Parsons
221
0.40
Marxist–Leninist Alexandre Legeais
117
0.21
-0.28
Total valid votes
55,695 100.00
Liberal hold
Swing
-5.67
2004 Canadian federal election
Party
Candidate
Votes
%
Liberal Mauril Bélanger 25,952
49.17
-6.40
Conservative Kevin Friday
12,769
24.19
-6.95
New Democratic Ric Dagenais
9,787
18.54
+9.83
Green Raphaël Thierrin
3,628
6.87
+4.62
Marijuana Carol Taylor
558
1.06
-0.45
Marxist–Leninist Françoise Roy
85
0.49
+0.34
Total valid votes
52,779 100.00
Note: Conservative vote is compared to the total of the Canadian Alliance vote and Progressive Conservative vote in 2000 election.
2000 Canadian federal election
Party
Candidate
Votes
%
Liberal Mauril Bélanger 26,749
55.57
-6.30
Alliance Nestor Gayowsky
7,590
15.77
+5.97
Progressive Conservative Stephen Woollcombe
7,400
15.37
+1.77
New Democratic Joseph Zebrowski
4,194
8.71
-3.28
Green Adam Sommerfeld
1,083
2.25
+0.94
Marijuana Raymond Turmel
728
1.51
Natural Law Pierrette Blondin
187
0.39
-0.27
Canadian Action Raymond Samuéls
131
0.27
Marxist–Leninist Kim Roberge
74
0.15
-0.13
Total valid votes
48,136 100.00
Note: Canadian Alliance vote is compared to the Reform vote in 1997 election.
1997 Canadian federal election
Party
Candidate
Votes
%
Liberal Mauril Bélanger 30,728
61.87
+1.14
Progressive Conservative Luc Edmund Barrick
6,754
13.60
+3.92
New Democratic David Gagnon
5,952
11.99
+5.57
Reform Roy Grant
4,868
9.80
-10.76
Green Richard Guy Briggs
651
1.31
Natural Law Roger Bouchard
330
0.66
+0.10
Independent César Antonio Bello
241
0.49
Marxist–Leninist Robert Rival
138
0.28
-0.03
Total valid votes
49,662 100.00
Party
Candidate
Votes
%
Expenditures
Liberal Mauril Bélanger 11,918
60.06
−10.41
$52,001
Reform
Kevin Gaudet
4,034
20.33
+12.44
$36,995
Progressive Conservative
Françoise Guenette
1,899
9.57
−0.96
$30,933
New Democratic Party
Bob Lawson
1,259
6.34
−0.16
$5,764
Christian Heritage
Gilles Gauthier
299
1.51
$1,751
Green Frank de Jong 218
1.10
−0.24
$0
Natural Law
Ian A.G. Campbell
109
0.55
−0.35
$131
Marxist-Leninist
Serge Lafortune
61
0.31
+0.02
$136
Abolitionist
John Turmel
46
0.23
+0.17
$0
Total valid votes
19,843 100.00
Total rejected ballots
201
Turnout
20,004 30.39 −32.04
Electors on the lists
65,824
1993 Canadian federal election
Party
Candidate
Votes
%
Liberal Jean-Robert Gauthier 31,216
70.46
+11.25
Progressive Conservative Marie-Christine Lemire
4,486
10.13
-13.07
Reform Sam Dancey
3,553
8.02
New Democratic Willie Dunn 2,935
6.62
-9.36
Green Frank de Jong 606
1.37
National Raymond Samuels
497
1.12
Independent David Talbot
429
0.97
Natural Law Roger Bouchard
414
0.93
Marxist–Leninist Serge Lafortune
138
0.31
Abolitionist Steven Edward White
28
0.06
Total valid votes
44,302 100.00
1988 Canadian federal election
Party
Candidate
Votes
%
Liberal Jean-Robert Gauthier 28,581
59.21
+10.13
Progressive Conservative Gilles Guénette
11,197
23.20
-5.63
New Democratic Kathryn Barnard
7,712
15.98
-5.50
Rhinoceros Charlie le concierge McKenzie
460
0.95
Independent Jean-Claude Viens
256
0.53
Independent Louis Lang
61
0.13
Total valid votes
48,267 100.00
1984 Canadian federal election
Party
Candidate
Votes
%
Liberal Jean-Robert Gauthier 21,401
49.08
-17.42
Progressive Conservative Michel Lamoureux
12,571
28.83
+11.03
New Democratic Kathryn Barnard
9,364
21.48
+7.68
Independent Serge Girard
265
0.61
Total valid votes
43,601 100.00
1980 Canadian federal election
Party
Candidate
Votes
%
Liberal Jean-Robert Gauthier 27,564
66.50
+3.08
Progressive Conservative Moe Royer
7,379
17.80
-2.58
New Democratic Jim Stark
5,721
13.80
-2.05
Rhinoceros Graham Prickles Ashby
519
1.25
Independent Gail Dexter Lord
166
0.40
Marxist–Leninist Serge Lafortune
100
0.24
-0.12
Total valid votes
41,449 100.00
1979 Canadian federal election
Party
Candidate
Votes
%
Liberal Jean-Robert Gauthier 28,098
63.42
-4.90
Progressive Conservative Moe Royer
9,098
20.38
+2.80
New Democratic Paul H. Michaud
7,023
15.85
+5.50
Marxist–Leninist Serge Lafortune
159
0.36
Total valid votes
44,378 100.00
1974 Canadian federal election
Party
Candidate
Votes
%
Liberal Jean-Robert Gauthier 21,773
68.32
+5.38
Progressive Conservative Claude L. Choquette
5,603
17.58
-0.98
New Democratic Paul H. Michaud
3,298
10.35
-4.03
Social Credit Cyril E. Gauthier
976
3.06
-0.42
Independent Judith T. Haddad
114
0.36
Independent Edmond Irani
107
0.34
Total valid votes
31,871 100.00
Ottawa East [ ]
1972 Canadian federal election
Party
Candidate
Votes
%
Liberal Jean-Robert Gauthier 20,446
62.94
-15.70
Progressive Conservative Gerry Valiquette
6,029
18.56
+5.98
New Democratic François Beaulne
4,672
14.38
+5.60
Social Credit Cyril E. Gauthier
1,229
3.48
Independent David S. White
208
0.64
Total valid votes
32,584 100.00
1968 Canadian federal election
Party
Candidate
Votes
%
Liberal J.-T. Richard
26,170
78.64
+9.25
Progressive Conservative Rex Le Lacheur
4,186
12.58
-6.26
New Democratic Ian Macdonald
2,921
8.78
-3.00
Total valid votes
33,277 100.00
1965 Canadian federal election
Party
Candidate
Votes
%
Liberal J.-T. Richard
15,107
69.39
+21.78
Progressive Conservative Rex Le Lacheur
4,101
18.84
+3.17
New Democratic Ben Coffey
2,564
11.78
+6.11
Total valid votes
21,772 100.00
1963 Canadian federal election
Party
Candidate
Votes
%
Liberal J.-T. Richard
12,043
47.61
-17.46
Independent Yves Parisien
6,574
25.99
Progressive Conservative Rex Le Lacheur
3,964
15.67
-12.11
New Democratic Ruth Townsend
1,433
5.67
+0.70
Social Credit Roger Boulanger
930
3.68
+1.50
Independent Laurent Bordeleau
349
1.38
Total valid votes
25,293 100.00
1962 Canadian federal election
Party
Candidate
Votes
%
Liberal J.-T. Richard
15,930
65.07
+3.65
Progressive Conservative Jean-Pierre Beaulne
6,801
27.78
-7.47
New Democratic Marc Llanos
1,216
4.97
+2.92
Social Credit Wilfrid H. Rigney
534
2.18
+0.90
Total valid votes
24,481 100.00
Note: NDP vote is compared to CCF vote in 1958 election. Communist vote is compared to Labour-Progressive vote in 1958 election.
1958 Canadian federal election
Party
Candidate
Votes
%
Liberal J.-T. Richard
17,161
61.42
-9.66
Progressive Conservative R.-D. Chenier
9,850
35.25
+12.04
Co-operative Commonwealth William A. Layman
573
2.05
-0.37
Social Credit Raymond Berthiaume
357
1.28
-2.01
Total valid votes
27,941 100.00
1957 Canadian federal election
Party
Candidate
Votes
%
Liberal J.-T. Richard
18,216
71.08
-3.64
Progressive Conservative Eleanor Blackburn
5,947
23.21
+2.68
Social Credit Raymond Berthiaume
843
3.29
Co-operative Commonwealth William A. Layman
620
2.42
-2.13
Total valid votes
25,626 100.00
1953 Canadian federal election
Party
Candidate
Votes
%
Liberal J.-T. Richard
19,863
74.72
+4.72
Progressive Conservative Arthur Beauchesne
5,511
20.53
+2.11
Co-operative Commonwealth W. Victor O'Brien
1,209
4.55
-0.02
Total valid votes
26,583 100.00
1949 Canadian federal election
Party
Candidate
Votes
%
Liberal J.-T. Richard
20,895
70.00
+20.52
Progressive Conservative Lionel Choquette 5,499
18.42
-1.40
Co-operative Commonwealth Henri Robert
1,363
4.57
-2.64
Independent Joseph Albert Pinard 1,108
3.71
-17.00
Independent Edward Victor O'Meara
777
2.60
Social Credit Patrice Brunet
208
0.70
Total valid votes
29,850 100.00
1945 Canadian federal election
Party
Candidate
Votes
%
Liberal J.-T. Richard
15,014
49.48
+6.88
Independent Liberal
Joseph Albert Pinard 6,284
20.71
Progressive Conservative Henri Saint-Jacques
6,013
19.82
-1.35
Co-operative Commonwealth Armand Ducharme
2,188
7.21
Social Credit Joseph-Ubald Dupont
374
1.23
Independent James-Aimé Cronier
295
0.97
Independent Max Feller
176
0.58
Total valid votes
30,344 100.00
Note: Progressive Conservative vote is compared to "National Government" vote in 1940 election.
1940 Canadian federal election
Party
Candidate
Votes
%
Liberal Joseph Albert Pinard 12,373
42.60
+1.36
Independent Liberal
Aurèle Chartrand
10,526
36.24
National Government Armand Ducharme
6,149
21.17
Total valid votes
29,048 100.00
Canadian federal by-election, 26 October 1936
Party
Candidate
Votes
%
Chevrier appointed to the High Court of Justice of Ontario
Liberal Joseph Albert Pinard 9,726
41.24
-22.90
Independent Liberal
William Michael Unger
6,832
28.97
Independent Jean Tissot
3,449
14.63
-0.68
Independent Liberal
Cecile Gauthier-O'Regan
1,849
7.84
Independent Liberal
Rufus Henry Parent
1,726
7.32
Total valid votes
23,582 100.00
1935 Canadian federal election
Party
Candidate
Votes
%
Liberal Edgar-Rodolphe-Eugène Chevrier 16,598
64.14
Independent Jean Tissot
3,961
15.31
Conservative Lionel Choquette 3,701
14.30
Reconstruction Wilbert Spearman
1,617
6.25
Total valid votes
25,877 100.00
See also [ ] References [ ] Notes [ ] External links [ ]
Federal ridings in Ottawa
Liberal Conservative
Federal ridings in Ontario
Central Eastern S Durham
City of Toronto Suburbs & Downtown )
Cities of Brampton &
Brampton
Brampton Centre Brampton East Brampton North Brampton South Brampton West Mississauga
Southern
Southwestern Halton City of Hamilton Niagara
Niagara Centre Niagara Falls Niagara West St. Catharines
Midwestern Northern Southwestern Ottawa See also : Provincial ridings in Ontario
Until 2015 Until 2006 Until 2004 Until 2000 Until 1997 Until 1993 Until 1988 Until 1984 Until 1979 Until 1974 Until 1972 Until 1968 Until 1953 Until 1949 Until 1935 Until 1925 Until 1917 Until 1904 Until 1896 Until 1882