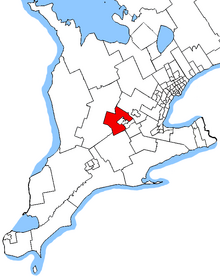
Kitchener—Conestoga electoral district Kitchener—Conestoga in relation to Southern Ontario ridings
Legislature House of Commons MP Tim Louis Liberal District created 2003 First contested 2004 Last contested 2019 District webpage profile , map Population (2011 )[1] 93,827 Electors (2015)67,890 Area (km²)[2] 949 Pop. density (per km²) 98.9 Census division(s) Waterloo Census subdivision(s) Kitchener , Wellesley , Wilmot , Woolwich
Kitchener—Conestoga (formerly known as Kitchener—Wilmot—Wellesley—Woolwich ) is a federal electoral district in Ontario , Canada, that has been represented in the House of Commons of Canada since 2004. Its population in 2006 was 114,405. The riding is currently represented by Liberal MP Tim Louis. This was one of only two ridings in the country Conservatives won in the 2015 election while Liberals won in the 2019 election (the other being Milton ).[3]
Geography [ ] The district includes the townships of Woolwich , Wellesley and Wilmot , and the southwestern part of the City of Kitchener , i.e., the part of the City of Kitchener lying west of Fischer-Hallman Road.
The electoral district was created in 2003 from Waterloo—Wellington , part of Kitchener Centre , and part of Cambridge . It was known as "Kitchener—Wilmot—Wellesley—Woolwich" from 2004 to 2005.
This riding lost almost half of its territory to Kitchener South—Hespeler but gained territory from Kitchener Centre , Kitchener—Waterloo and a fraction from Wellington—Halton Hills during the 2012 electoral redistribution .
Members of Parliament [ ]
Parliament
Years
Member
Party
Kitchener—ConestogaRiding created from Waterloo—Wellington ,Kitchener Centre and Cambridge
38th
2004–2006 Lynn Myers Liberal 39th
2006–2008 Harold Albrecht Conservative 40th
2008–2011 41st
2011–2015 42nd
2015–2019 43rd
2019–present Tim Louis Liberal
Election results [ ] Graph of election results in Kitchener—Conestoga (minor parties that never got 2% of the vote or didn't run consistently are omitted)
hide 2021 Canadian federal election
The 2021 general election will be held on September 20.
Party
Candidate
Votes
%
Green Owen Bradley
People's Kevin Dupuis
Conservative Carlene Hawley
Liberal Tim Louis
New Democratic Narine Dat Sookram
Total valid votes
Total rejected ballots
Turnout
Eligible voters
Source: Elections Canada [4]
hide 2019 Canadian federal election
Party
Candidate
Votes
%
Expenditures
Liberal Tim Louis 20,480
39.7
-3.15
$78,912.65
Conservative Harold Albrecht 20,115
39.0
-4.22
$90,924.77
New Democratic Riani De Wet
5,204
10.1
+0.4
none listed
Green Stephanie Goertz
4,946
9.6
+6.88
none listed
People's Koltyn Wallar
790
1.5
–
$0.00
Total valid votes/Expense limit
51,535 100.0
Total rejected ballots
361
Turnout
51,896 69.6 -0.24
Eligible voters
74,562
Liberal gain from Conservative
Swing
+0.54
Source: Elections Canada [5] [6]
hide 2015 Canadian federal election
Party
Candidate
Votes
%
Expenditures
Conservative Harold Albrecht 20,649
43.29
-11.12
$126,202.90
Liberal Tim Louis 20,398
42.76
+19.29
$65,863.92
New Democratic James Villeneuve
4,653
9.75
-8.50
$13,161.73
Green Bob Jonkman
1,314
2.75
-0.89
$1,743.36
Libertarian Richard Hodgson
685
1.44
–
–
Total valid votes/Expense limit
47,699 100.00 $202,562.28
Total rejected ballots
227 0.47 –
Turnout
47,926 69.84 –
Eligible voters
68,623
Conservative hold
Swing
-15.21
Source: Elections Canada [7] [8]
2011 federal election redistributed results[9]
Party
Vote
%
Conservative 21,914
54.41
Liberal 9,454
23.47
New Democratic 7,350
18.25
Green 1,469
3.65
Others
86
0.21
hide 2011 Canadian federal election
Party
Candidate
Votes
%
Expenditures
Conservative Harold Albrecht 28,902
54.12
+4.80
$87,677.43
New Democratic Lorne Bruce
11,665
21.84
+6.81
$9,277.86
Liberal Robert Rosehart 10,653
19.95
-4.94
–
Green Albert Ashley
2,184
4.09
-6.65
–
Conservative hold
Swing
+5.80
Total valid votes/Expense limit
53,404 100.00 $92,867.94
Total rejected ballots
171 0.32 0.00
Turnout
53,575 61.10 +4.58
Eligible voters
87,689 – –
hide 2008 Canadian federal election
Party
Candidate
Votes
%
Expenditures
Conservative Harold Albrecht 23,525
49.32
+8.10
$84,798
Liberal Orlando Da Silva
11,876
24.89
-13.59
$75,077
New Democratic Rod McNeil
7,173
15.03
+0.15
$6,494
Green Jamie Kropf
5,124
10.74
+5.33
$33,066
Conservative hold
Swing
+10.85
Total valid votes/Expense limit
47,698 100.00 $88,113
Total rejected ballots
153 0.32
Turnout
47,851 56.52
Conservative hold
Swing
+10.85
hide 2006 Canadian federal election
Party
Candidate
Votes
%
Conservative Harold Albrecht 20,615
41.22
+5.86
Liberal Lynn Myers 19,245
38.48
-3.80
New Democratic Len Carter
7,443
14.88
-0.83
Green Kris Stapleton
2,706
5.41
-1.22
Total valid votes
50,009 100.00
Conservative gain from Liberal
Swing
+4.83
hide 2004 Canadian federal election
Party
Candidate
Votes
%
Liberal Lynn Myers 17,819
42.29
Conservative Frank Luellau
14,903
35.37
New Democratic Len Carter
6,623
15.72
Green Kris Stapleton
2,793
6.63
Total valid votes
42,138 100.00
References [ ] Notes [ ] show Federal ridings in Midwestern Ontario
Liberal Conservative
show Federal ridings in Ontario
Central Eastern S Durham
City of Toronto Suburbs & Downtown )
Cities of Brampton &
Brampton
Brampton Centre Brampton East Brampton North Brampton South Brampton West Mississauga
Southern
Southwestern Halton City of Hamilton Niagara
Niagara Centre Niagara Falls Niagara West St. Catharines
Midwestern Northern Southwestern Ottawa See also : Provincial ridings in Ontario
show Historical federal ridings in Ontario
Until 2015 Until 2006 Until 2004 Until 2000 Until 1997 Until 1993 Until 1988 Until 1984 Until 1979 Until 1974 Until 1972 Until 1968 Until 1953 Until 1949 Until 1935 Until 1925 Until 1917 Until 1904 Until 1896 Until 1882