Federal electoral district in Ontario, Canada
For other uses, see Peterborough (disambiguation) .
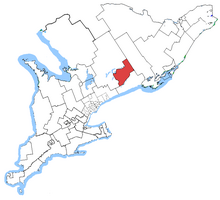
Peterborough—Kawartha electoral district Peterborough in relation to southern Ontario ridings
Legislature House of Commons MP Michelle Ferreri Conservative District created 1953 First contested 1953 Last contested 2021 District webpage profile , map Population (2011 )[1] 115,269 Electors (2015)90,352 Area (km²)[1] 3,473 Pop. density (per km²) 33.2 Census division(s) Peterborough County Census subdivision(s) Curve Lake First Nation 35 , Douro-Dummer , Trent Lakes , Havelock-Belmont-Methuen , North Kawartha , Peterborough , Selwyn
Peterborough—Kawartha is a federal electoral district in Ontario , Canada, that has been represented in the House of Commons of Canada since 1953. Prior to the 2015 election , the riding was known as Peterborough .[2]
Geography [ ] It now consists of the City of Peterborough and the municipalities of: Douro-Dummer, Trent Lakes, Havelock-Belmont-Methuen, North Kawartha and Selwyn plus the Curve Lake First Nation.
History [ ] The riding's borders have differed slightly since its creation in 1953, but has always included most or all of Peterborough County and its county seat of Peterborough, Ontario . Prior to 1952, Peterborough was split into two ridings, one of which was sometimes partly joined to neighbouring Hastings County . Since 1999, the riding boundaries and names of the provincial and federal electoral districts have been identical.
It was created in 1953 from Peterborough West and Hastings—Peterborough . It consisted initially of the city of Peterborough and the townships of Galway, Cavendish, Harvey, Ennismore, Smith, Douro, Otonabee, and North Monaghan. In 1966, the townships of Galway, Cavendish and Harvey were removed from the riding, and the townships of Belmont and Methuen, Dummer, Smith and Asphodel (excluding the Village of Hastings) were added.
In 1976, it was redefined to consist of the part of the County of Peterborough lying south of the Townships of Burleigh and Anstruther, Chandos and Harvey, but excluding the Township of Cavan and the Village of Hastings. In 1987, the Village of Millbrook was excluded, and the Village of Hastings was added to the riding.
In 2003, the Township of North Monaghan was removed from the riding.
In 2013, the riding lost the Townships of Otonabee-South Monaghan, Asphodel-Norwood, and the Hiawatha First Nation, while subsequently gaining the townships of Trent Lakes and North Kawartha.
The riding is a noted bellwether ; it has been won by a member of the governing party of the day in all but four elections since its creation. Its previous MP, Dean Del Mastro , was elected as a member of the Conservative Party of Canada , but resigned from the Conservative caucus in 2013.[3] 2008 election , failing to include $21,000 in expenses and spending more than the election spending limit.[4] [5]
Members of Parliament [ ] This riding has elected the following Members of Parliament :
Parliament
Years
Member
Party
PeterboroughRiding created from Peterborough West and Hastings—Peterborough
22nd
1953–1957 Gordon Fraser Progressive Conservative 23rd
1957–1958 24th
1958–1960
1960–1961 Walter Pitman New
1961–1962 New Democratic
25th
1962–1963 Fred Stenson Progressive Conservative 26th
1963–1965 27th
1965–1968 Hugh Faulkner Liberal 28th
1968–1972 29th
1972–1974 30th
1974–1979 31st
1979–1980 Bill Domm Progressive Conservative 32nd
1980–1984 33rd
1984–1988 34th
1988–1993 35th
1993–1997 Peter Adams Liberal 36th
1997–2000 37th
2000–2004 38th
2004–2006 39th
2006–2008 Dean Del Mastro Conservative 40th
2008–2011 41st
2011–2013
2013–2014 Independent Conservative
Peterborough—Kawartha
42nd
2015–2019 Maryam Monsef Liberal 43rd
2019–2021 44th
2021–present Michelle Ferreri Conservative
Election results [ ] Graph of election results in Peterborough—Kawartha/Peterborough (minor parties that never got 2% of the vote or didn't run consistently are omitted)
Peterborough—Kawartha [ ]
2021 Canadian federal election
Party
Candidate
Votes
%
Conservative Michelle Ferreri 27,402
39.03
+4.14
Liberal Maryam Monsef 24,664
35.13
–4.12
New Democratic Joy Lachica
13,302
18.94
+1.93
People's Paul Lawton
3,073
4.38
+3.10
Green Chanté White
1,553
2.21
–4.85
Independent Robert M. Bowers
218
0.31
+0.05
Total valid votes
70,212 99.44
Total rejected ballots
395 0.56
Turnout
70,607 70.09 +0.09
Eligible voters
100,735
Conservative gain from Liberal
Swing
+4.13
Source: Elections Canada [6]
2019 Canadian federal election
Party
Candidate
Votes
%
Expenditures
Liberal Maryam Monsef 27,400
39.25
-4.57
$99,034.55
Conservative Michael Skinner
24,357
34.89
-0.17
$97,460.55
New Democratic Candace Shaw
11,872
17.01
-1.68
none listed
Green Andrew MacGregor
4,930
7.06
+4.84
none listed
People's Alexander Murphy
890
1.28
none listed
Independent Robert M. Bowers
180
0.26
$0.00
Stop Climate Change
Ken Ranney
172
0.25
$1,666.19
Total valid votes/expense limit
69,801 99.36
Total rejected ballots
448 0.64 +0.35
Turnout
70,249 70.00 -1.61
Eligible voters
100,351
Liberal hold
Swing
-2.20
Source: Elections Canada [7]
2015 Canadian federal election
Party
Candidate
Votes
%
Expenditures
Liberal Maryam Monsef 29,159
43.82
+22.42
$153,380.94
Conservative Michael Skinner
23,335
35.07
-14.60
$158,210.30
New Democratic Dave Nickle
12,437
18.69
-6.19
$56,760.61
Green Doug Mason
1,480
2.22
-1.34
$82.52
Strength in Democracy Toban Leckie
131
0.20
–
$729.98
Total valid votes/Expense limit
66,542 99.72 – $232,452.91
Total rejected ballots
190 0.28
Turnout
66,732 73.61
Eligible voters
93,190
Source: Elections Canada [8] [9]
2011 federal election redistributed results[10]
Party
Vote
%
Conservative 28,435
49.55
New Democratic 14,341
24.99
Liberal 12,231
21.32
Green 2,106
3.67
Others
268
0.47
Peterborough [ ]
2011 Canadian federal election
Party
Candidate
Votes
%
Expenditures
Conservative Dean Del Mastro 29,393
49.67
+2.27
$89,982.35
New Democratic Dave Nickle
14,723
24.88
+10.96
$44,675.03
Liberal Betsy McGregor
12,664
21.40
-10.20
$76,896.98
Green Michael Bell
2,105
3.56
-3.35
$2,858.90
Independent Gordon Scott
189
0.32
–
$202.50
Canadian Action Michael Bates
104
0.18
–
none listed
Total valid votes/Expense limit
59,178 100.0 $95,207.51
Total rejected ballots
170 0.29 +0.01
Turnout
59,348 65.31 +1.99
Eligible voters
90,870 – –
2008 Canadian federal election : Peterborough
Party
Candidate
Votes
%
Expenditures
Conservative Dean Del Mastro 27,630
47.40
+11.50
$111,988
Liberal Betsy McGregor
18,417
31.60
−0.77
$83,805
New Democratic Steve Sharpe
8,115
13.92
−11.76
$47,973
Green Emily Berrigan
4,029
6.91
+1.86
$10,235
Marxist–Leninist Elaine Couto
98
0.17
none listed
Total valid votes/expense limit
58,289 100.00 – $92,567
Total rejected ballots
164 0.28 −0.04
Turnout
58,453 63.32 −6.34
Electors on the lists
92,317
Conservative hold
Swing
+11.6
2006 Canadian federal election : Peterborough
Party
Candidate
Votes
%
Expenditures
Conservative Dean Del Mastro 22,774
35.90
+3.98
$80,784
Liberal Diane Lloyd
20,532
32.37
−11.18
$68,799
New Democratic Linda Slavin
16,286
25.68
+6.67
$61,606
Green Brent Wood
3,205
5.05
−0.47
$7,949
Marijuana Aiden Wiechula
455
0.72
none listed
Independent Bob Bowers
179
0.28
none listed
Total valid votes/expense limit
63,431 100.00 – $86,008
Total rejected ballots
207 0.33 −0.01
Turnout
63,638 69.66 +4.47
Electors on the lists
91,361
Sources: Official Results, Elections Canada and Financial Returns, Elections Canada .
2004 Canadian federal election : Peterborough
Party
Candidate
Votes
%
Expenditures
Liberal Peter Adams 25,099
43.55
–
$82,907
Conservative James Jackson
18,393
31.92
$51,318
New Democratic Linda Slavin
10,957
19.01
$33,309
Green Brent Wood
3,182
5.52
$4,730
Total valid votes/expense limit
57,631 100.00 – $83,531
Total rejected ballots
192 0.33 0.00
Turnout
57,823 65.19 4.42
Electors on the lists
88,695
Percentage change figures are factored for redistribution. Conservative Party percentages are contrasted with the combined Canadian Alliance and Progressive Conservative percentages from 2000.
Sources: Official Results, Elections Canada and Financial Returns, Elections Canada .
Note: Conservative vote is compared to the total of the Canadian Alliance vote and Progressive Conservative vote in 2000 election.
2000 Canadian federal election : Peterborough
Party
Candidate
Votes
%
Expenditures
Liberal Peter Adams 25,310
48.41
–
$55,442
Alliance Eric John Allan Mann
14,924
28.54
$61,961
Progressive Conservative Darrin Langen
7,034
13.45
$22,256
New Democratic Herb Wiseman
3,967
7.59
$20,021
Green Tim Holland
903
1.73
$1,738
Independent Bob Bowers
147
0.28
$1,097
Total valid votes/expense limit
52,285
100.00
Total rejected ballots
175 0.33
Turnout
52,460 60.77
Electors on the lists
86,319
Sources: Official Results, Elections Canada and Financial Returns, Elections Canada .
Note: Canadian Alliance vote is compared to the Reform vote in 1997 election.
1997 Canadian federal election
Party
Candidate
Votes
%
Liberal Peter Adams 25,594
46.5
-1.0
Reform Nancy Branscombe
15,759
28.7
+5.4
Progressive Conservative Tom Macmillan
8,757
15.9
-4.1
New Democratic Fred Birket
4,874
8.9
+3.6
Total valid votes
54,984 100.0
1993 Canadian federal election
Party
Candidate
Votes
%
Liberal Peter Adams 27,575
47.6
+17.3
Reform Len Bangma
13,460
23.2
Progressive Conservative Bill Domm 11,628
20.1
-20.8
New Democratic Merv Richards
3,072
5.3
-22.2
National Herb Wiseman
1,858
3.2
Natural Law Sandy Callender
368
0.6
Total valid votes
57,961 100.0
1988 Canadian federal election
Party
Candidate
Votes
%
Progressive Conservative Bill Domm 22,492
40.9
-11.8
Liberal Barry MacDougall
16,693
30.3
+7.5
New Democratic Gill Sandeman
15,147
27.5
+6.8
Libertarian Mike Lantz
277
0.5
-2.4
Rhinoceros C. Fibber McGee
238
0.4
-0.2
Green George Kerr
208
0.4
0.0
Total valid votes
55,055 100.0
1984 Canadian federal election
Party
Candidate
Votes
%
Progressive Conservative Bill Domm 27,121
52.7
+12.4
Liberal Barry MacDougall
11,737
22.8
-12.9
New Democratic Linda Slavin
10,648
20.7
-1.6
Libertarian John Hayes
1,479
2.9
+1.9
Rhinoceros Washboard Fisher
309
0.6
+0.1
Green Simon Shields
175
0.3
Total valid votes
51,469 100.0
1980 Canadian federal election
Party
Candidate
Votes
%
Progressive Conservative Bill Domm 19,417
40.2
-4.2
Liberal Sylvia Sutherland
17,202
35.7
-1.0
New Democratic Paul Rexe
10,776
22.3
+5.4
Libertarian Sally Hayes
469
1.0
-0.6
Rhinoceros Mark Elson
243
0.5
+0.2
Independent Robert J. Norris
69
0.1
Marxist–Leninist Richard Anthony
67
0.1
0.0
Total valid votes
48,243 100.0
1979 Canadian federal election
Party
Candidate
Votes
%
Progressive Conservative Bill Domm 22,195
44.5
+11.5
Liberal Hugh Faulkner 18,288
36.6
-16.3
New Democratic Cyril Carter
8,451
16.9
+3.3
Libertarian John Hayes
787
1.6
Rhinoceros Brian Flynn
150
0.3
Marxist–Leninist Richard Anthony
47
0.1
Total valid votes
49,918 100.0
1974 Canadian federal election
Party
Candidate
Votes
%
Liberal Hugh Faulkner 23,865
52.9
+7.4
Progressive Conservative Duff Roblin 14,891
33.0
-7.1
New Democratic Gill Sandeman 6,171
13.7
-0.7
Independent Linda Peevers
187
0.4
Total valid votes
45,114 100.0
1972 Canadian federal election
Party
Candidate
Votes
%
Liberal Hugh Faulkner 20,282
45.5
+3.4
Progressive Conservative John Doris
17,885
40.1
+5.3
New Democratic Ray Peters
6,422
14.4
-8.7
Total valid votes
44,589 100.0
1968 Canadian federal election
Party
Candidate
Votes
%
Liberal Hugh Faulkner 15,675
42.1
+5.1
Progressive Conservative Archie McLean
12,972
34.8
-0.2
New Democratic Bruce Hodgins
8,593
23.1
-4.9
Total valid votes
37,240 100.0
1965 Canadian federal election
Party
Candidate
Votes
%
Liberal Hugh Faulkner 12,335
37.0
+7.0
Progressive Conservative Fred Stenson 11,693
35.1
-0.9
New Democratic Arthur Parker
9,327
28.0
-5.6
Total valid votes
33,355 100.0
1963 Canadian federal election
Party
Candidate
Votes
%
Progressive Conservative Fred Stenson 11,909
35.9
-2.1
New Democratic Walter Pitman 11,131
33.6
-2.7
Liberal Hugh Faulkner 9,927
29.9
+4.3
Social Credit David Hartman
180
0.5
Total valid votes
33,147 100.0
1962 Canadian federal election
Party
Candidate
Votes
%
Progressive Conservative Fred Stenson 12,185
38.1
+2.6
New Democratic Walter Pitman 11,605
36.3
-9.5
Liberal Hugh Faulkner
8,215
25.7
+7.0
Total valid votes
32,005 100.0
By-election on 1960 By-election
Party
Candidate
Votes
%
±%
New Walter Pitman 13,207
45.8
+39.2
Progressive Conservative Harold Matthews
10,246
35.5
-31.3
Liberal Donald Munro
5,394
18.7
-6.8
Total valid votes
28,847 100.0
Note: New Party vote is compared to CCF vote in 1958 election.
1958 Canadian federal election
Party
Candidate
Votes
%
Progressive Conservative Gordon Fraser 19,032
66.8
+8.9
Liberal Glenn Price
7,254
25.5
-3.5
Co-operative Commonwealth John T. Taylor
1,887
6.6
0.0
Social Credit Martin Graves
326
1.1
-5.4
Total valid votes
28,499 100.0
1957 Canadian federal election
Party
Candidate
Votes
%
Progressive Conservative Gordon Fraser 16,598
57.9
+5.4
Liberal Claire Hickman Stuart
8,301
29.0
-11.6
Co-operative Commonwealth William Binney
1,887
6.6
-0.4
Social Credit Martin Graves
1,887
6.6
Total valid votes
28,673 100.0
1953 Canadian federal election
Party
Candidate
Votes
%
Progressive Conservative Gordon Fraser 13,206
52.5
Liberal Maxwell Swanston
10,218
40.6
Co-operative Commonwealth Maurice Ketcheson
1,747
6.9
Total valid votes
25,171 100.0
See also [ ] References [ ] Notes [ ]
^ a b Statistics Canada : 2012^ "Government Bill (House of Commons) C-37 (41-2) - Third Reading - Riding Name Change Act, 2014 - Parliament of Canada" .^ Payton, Laura (September 26, 2013). "Dean Del Mastro quits Tory caucus after Election Act charges" . CBC News . ^ Laura Payton (October 31, 2014). "Dean Del Mastro found guilty in election spending case" . CBC News. Retrieved October 31, 2014 . ^ Payton, Laura and Kady O'Malley (November 5, 2014). "Dean Del Mastro, guilty of breaking election laws, resigns" . CBC News . ^ "List of confirmed candidates – September 20, 2021 Federal Election" . Elections Canada . Retrieved September 2, 2021 .^ "List of confirmed candidates" . Elections Canada . Retrieved October 3, 2019 .^ Elections Canada – Confirmed candidates for Peterborough—Kawartha, 30 September 2015 ^ Elections Canada – Preliminary Election Expenses Limits for Candidates ^ Pundits' Guide to Canadian Elections
Federal ridings in Central Ontario
Conservative Liberal
Federal ridings in Ontario
Central Eastern S Durham
City of Toronto Suburbs & Downtown )
Cities of Brampton &
Brampton
Brampton Centre Brampton East Brampton North Brampton South Brampton West Mississauga
Southern
Southwestern Halton City of Hamilton Niagara
Niagara Centre Niagara Falls Niagara West St. Catharines
Midwestern Northern Southwestern Ottawa See also : Provincial ridings in Ontario
Until 2015 Until 2006 Until 2004 Until 2000 Until 1997 Until 1993 Until 1988 Until 1984 Until 1979 Until 1974 Until 1972 Until 1968 Until 1953 Until 1949 Until 1935 Until 1925 Until 1917 Until 1904 Until 1896 Until 1882
Coordinates : 44°27′43″N 78°11′06″W / 44.462°N 78.185°W / 44.462; -78.185