Simcoe North (provincial electoral district)
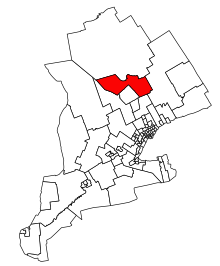 Simcoe North in relation to southern Ontario ridings | |||
| Provincial electoral district | |||
| Legislature | Legislative Assembly of Ontario | ||
| MPP |
Progressive Conservative | ||
| District created | 1996 | ||
| First contested | 1999 | ||
| Last contested | 2018 | ||
| Demographics | |||
| Population (2011) | 121,119 | ||
| Electors (2011) | 88,470 | ||
| Area (km²) | 2,381 | ||
| Pop. density (per km²) | 50.9 | ||
| Census division(s) | Simcoe County | ||
| Census subdivision(s) | Midland, Orillia, Penetanguishene, Tay, Tiny, Christian Island, Severn, Ramara, Oro-Medonte, Mnjikaning First Nation | ||
Simcoe North is a provincial electoral district in Ontario, Canada. It was established as a provincial riding in 1996. Its population was 119,401 in 2006.
Demographics[]
Ethnic groups: 88.5% White, 9.0% Aboriginal
Languages: 90.5% English, 3.8% French, 1.4% German
Religions: 71.7% Christian (28.5% Catholic, 13.0% United Church, 10.1% Anglican, 5.6% Presbyterian, 2.9% Baptist, 1.2% Lutheran, 1.0% Pentecostal, 9.4% Other Christian), 26.9% None.
Median income: $28,718 (2010)
Average income: $37,989 (2010)
Geography[]
The district includes all of the north and eastern parts of Simcoe County. The major municipalities include Midland, Orillia, Penetanguishene, Tay, Tiny, Christian Island, Severn, Ramara, Oro-Medonte and Mnjikaning First Nation The area is 2,381 km2.
Members of Provincial Parliament[]
| Simcoe North | ||||
|---|---|---|---|---|
| Assembly | Years | Member | Party | |
| Riding created | ||||
| 1st | 1867–1871 | William Lount | Liberal | |
| 2nd | 1871–1874 | William Davis Ardagh | Conservative | |
| Riding dissolved | ||||
| Riding created from Simcoe East and Muskoka–Georgian Bay | ||||
| 37th | 1999–2003 | Garfield Dunlop | Progressive Conservative | |
| 38th | 2003–2007 | |||
| 39th | 2007–2011 | |||
| 40th | 2011–2014 | |||
| 41st | 2014–2015 | |||
| 2015–2018 | Patrick Brown | |||
| 2018–2018 | Independent | |||
| 42nd | 2018–Present | Jill Dunlop | Progressive Conservative | |
| Sourced from the Ontario Legislative Assembly[3] | ||||
Election results[]
| 2018 Ontario general election | ||||||||
|---|---|---|---|---|---|---|---|---|
| Party | Candidate | Votes | % | ±% | ||||
| Progressive Conservative | Jill Dunlop | 25,236 | 46.92 | +2.98 | ||||
| New Democratic | Elizabeth Van Houtte | 15,078 | 28.03 | +12.48 | ||||
| Liberal | Gerry Marshall | 9,523 | 17.70 | -14.82 | ||||
| Green | Valerie Powell | 3,632 | 6.75 | -1.24 | ||||
| Libertarian | Cynthia Sneath | 320 | 0.59 | |||||
| Total valid votes | 53,789 | 100.0 | ||||||
| Progressive Conservative gain from Independent | Swing | -8.97 | ||||||
| Source: Elections Ontario[4] | ||||||||
| Ontario provincial by-election, September 3, 2015 Resignation of Garfield Dunlop | ||||||||
|---|---|---|---|---|---|---|---|---|
| Party | Candidate | Votes | % | ±% | Expenditures | |||
| Progressive Conservative | Patrick Brown | 21,095 | 53.68 | +9.74 | $117,157.00 | |||
| Liberal | Fred Larsen | 9,281 | 23.62 | –8.90 | $94,892.00 | |||
| New Democratic | Elizabeth Van Houtte | 6,637 | 16.89 | +1.34 | $54,795.23 | |||
| Green | Valerie Powell | 1,791 | 4.56 | –3.43 | $183.33 | |||
| New Reform | James Gault | 200 | 0.51 | – | – | |||
| People's Political Party | Kevin Clarke | 146 | 0.37 | – | – | |||
| Libertarian | Darren Roskam | 104 | 0.26 | – | – | |||
| Pauper | John Turmel | 47 | 0.12 | – | – | |||
| Total valid votes | 39,301 | 100.0 | ||||||
| Total rejected, unmarked and declined ballots | 170 | 0.43 | ||||||
| Turnout | 39,471 | 40.71 | ||||||
| Eligible voters | 96,950 | |||||||
| Progressive Conservative hold | Swing | +9.32 | ||||||
Source(s)
Elections Ontario (2015). "Official Returns from the Records, 086 Simcoe North" (PDF). Retrieved 17 November 2015. | ||||||||
| 2014 Ontario general election | ||||||||
|---|---|---|---|---|---|---|---|---|
| Party | Candidate | Votes | % | ±% | ||||
| Progressive Conservative | Garfield Dunlop | 22,179 | 43.94 | -11.22 | ||||
| Liberal | Fred Larsen | 16,412 | 32.52 | +10.11 | ||||
| New Democratic | Doris Middleton | 7,846 | 15.55 | -1.41 | ||||
| Green | Peter Stubbins | 4,013 | 7.99 | +2.52 | ||||
| Total valid votes | 50,451 | 100.00 | ||||||
| Progressive Conservative hold | Swing | -10.67 | ||||||
| Source: Elections Ontario[5] | ||||||||
| 2011 Ontario general election | ||||||||
|---|---|---|---|---|---|---|---|---|
| Party | Candidate | Votes | % | ±% | ||||
| Progressive Conservative | Garfield Dunlop | 25,081 | 55.16 | +5.34 | ||||
| Liberal | Fred Larsen | 10,191 | 22.41 | -8.13 | ||||
| New Democratic | Doris Middleton | 7,710 | 16.96 | +7.77 | ||||
| Green | Peter Stubbins | 2,488 | 5.47 | -4.74 | ||||
| Total valid votes | 45,470 | 100.00 | ||||||
| Total rejected, unmarked and declined ballots | 142 | 0.31 | ||||||
| Turnout | 45,612 | 50.98 | ||||||
| Eligible voters | 89,474 | |||||||
| Progressive Conservative hold | Swing | +6.74 | ||||||
| Source: Elections Ontario[6] | ||||||||
| 2007 Ontario general election | ||||||||
|---|---|---|---|---|---|---|---|---|
| Party | Candidate | Votes | % | ±% | ||||
| Progressive Conservative | Garfield Dunlop | 22,986 | 49.82 | +3.69 | ||||
| Liberal | Laura Domsy | 14,094 | 30.54 | -8.33 | ||||
| Green | Wayne Varcoe | 4,709 | 10.21 | +7.17 | ||||
| New Democratic | Andrew Hill | 4,240 | 9.19 | -1.68 | ||||
| Libertarian | Dane-Train Reybould | 112 | 0.24 | |||||
| Total valid votes | 46,141 | 100.00 | ||||||
| Progressive Conservative hold | Swing | +12.02 | ||||||
| 2003 Ontario general election | ||||||||
|---|---|---|---|---|---|---|---|---|
| Party | Candidate | Votes | % | ±% | ||||
| Progressive Conservative | Garfield Dunlop | 23,393 | 46.13 | -7.02 | ||||
| Liberal | Paul Sloan | 19,713 | 38.87 | -0.16 | ||||
| New Democratic | John Niddery | 5,515 | 10.87 | +4.95 | ||||
| Green | Nina Pruesse | 1,540 | 3.04 | +1.75 | ||||
| Family Coalition | Blaine Scott | 453 | 0.89 | |||||
| Independent | Karnail Singh | 101 | 0.2 | |||||
| Total valid votes | 50,715 | 100.0 | ||||||
| Progressive Conservative hold | Swing | -3.43 | ||||||
| 1999 Ontario general election | ||||||||
|---|---|---|---|---|---|---|---|---|
| Party | Candidate | Votes | % | |||||
| Progressive Conservative | Garfield Dunlop | 26,160 | 53.15 | |||||
| Liberal | George J. Macdonald | 19,209 | 39.03 | |||||
| New Democratic | Ann Billings | 2,913 | 5.92 | |||||
| Green | Harry Promm | 633 | 1.29 | |||||
| Natural Law | William Robert Ayling | 305 | 0.62 | |||||
| Total valid votes | 49,220 | 100.0 | ||||||
2007 electoral reform referendum[]
| 2007 Ontario electoral reform referendum | |||
|---|---|---|---|
| Side | Votes | % | |
| First Past the Post | 28,215 | 62.6 | |
| Mixed member proportional | 16,883 | 37.4 | |
| Total valid votes | 45,098 | 100.0 | |
Sources[]
- ^ "National Household Survey (NHS) Profile, 2011". 8 May 2013.
- ^ "National Household Survey (NHS) Profile, 2011". 8 May 2013.
- ^ For a listing of each MPP's Queen's Park curriculum vitae see below:
- For William Lount's Legislative Assembly information see "William Lount, MPP". Parliamentary History. Toronto: Legislative Assembly of Ontario. 2017.
- For William Davis Ardagh's Legislative Assembly information see "William Davis Ardagh, MPP". Parliamentary History. Toronto: Legislative Assembly of Ontario. 2017.
- For Garfield Dunlop's Legislative Assembly information see "Garfield Dunlop, MPP". Parliamentary History. Toronto: Legislative Assembly of Ontario. 2017.
- For Patrick Brown's Legislative Assembly information see "Patrick Brown, MPP". Parliamentary History. Toronto: Legislative Assembly of Ontario. 2017.
- ^ "Summary of Valid Votes Cast for each Candidate" (PDF). Elections Ontario. p. 10. Retrieved 20 January 2019.
- ^ Elections Ontario. "General Election Results by District, 086 Simcoe North". Retrieved 13 June 2014.
- ^ Elections Ontario (2011). "Official return from the records / Rapport des registres officiels - Simcoe North" (PDF). Retrieved 2 June 2014.

Categories:
- Ontario provincial electoral districts
- Midland, Ontario
- Orillia
- Penetanguishene