Federal electoral district in Ontario, Canada
For the provincial electoral district, see Simcoe North (provincial electoral district) .
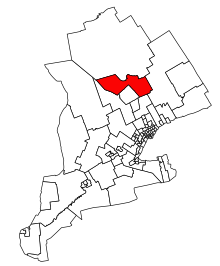
Simcoe North electoral district Simcoe North in relation to southern Ontario ridings (2003 boundaries)
Legislature House of Commons MP Adam Chambers Conservative District created 1867 First contested 1867 Last contested 2021 District webpage profile , map Population (2011 )[1] 108,672 Electors (2015)85,156 Area (km²)[1] 1,894 Pop. density (per km²) 57.4 Census division(s) Simcoe County Census subdivision(s) Midland , Orillia , Oro-Medonte , Penetanguishene , Tay , Tiny , Christian Island 30 , Christian Island 30A , Severn , Ramara , Mnjikaning First Nation
Simcoe North (French : Simcoe-Nord electoral district in central Ontario , Canada. It was established as a federal riding in 1867.
Demographics [ ] According to the Canada 2011 Census ; 2013 representation[2] [3] Ethnic groups: 87.8% White, 9.6% AboriginalLanguages: 90.2% English, 4.0% French, 1.4% German Religions: 71.6% Christian (29.4% Catholic, 12.3% United Church, 10.0% Anglican, 5.2% Presbyterian, 2.9% Baptist, 1.2% Lutheran, 1.1% Pentecostal, 9.6% Other Christian), 26.9% None. Median income: $28,203 (2010) Average income: $36,463 (2010)
Geography [ ] The district includes all of the north and eastern parts of Simcoe County . Municipalities and Indian reserves include Midland , Orillia , Penetanguishene , Tay , Tiny , Christian Island 30 , Christian Island 30A , Severn , Ramara , Oro-Medonte (part) and Mnjikaning First Nation The area is 1,984 km2 .
History [ ] The electoral district was created in 1867 by the British North America Act . In 1867, it included the townships of , , , , Oro , Medonte , , , , and the Towns of Barrie and Collingwood . In 1882, it lost Oro, Medonte, Orillia and Matchedash, Tiny and Tay, and Balaklava and Robinson. In 1903, it gained Oro, but lost Barrie. In 1947, it lost Oro and gained Barrie. In 1966, it lost Nottawasaga, Sunnidale and Flos and gained Penetanguishene, Matchedash, Medonte, Orillia, Oro, and Tay. In 1976, it gained the townships of Mara , Rama and Tiny but Lost Barrie and Vespra. In 1987, it gained Flos Township, only to lose it again in the 1996 redistribution. In the 2003 redistribution, its southern boundary was altered slightly to follow the boundary of the new municipality of Springwater in neighbouring Simcoe—Grey with the municipalities of Oro-Medonte , Tiny and Tay in Simcoe North. In 2013 , the riding lost all of Oro-Medonte west of .
Riding associations [ ] Riding associations are the local branches of the national political parties:
Party
Association Name
CEO
HQ Address
HQ City
Christian Heritage Party of Canada
Simcoe North Riding Association CHP
Adrian Kooger
201-390 Sundial Drive
Orillia
Conservative Party of Canada
Simcoe North Conservative Association
Marnie MacDougall
352 Tiny Beaches Road South
Perkinsfield
Liberal Party of Canada
Simcoe North Federal Liberal Association
Ryan Douglas Barber
520 Harvie Settlement Road
Orillia
New Democratic Party
Simcoe North Federal NDP Riding Association
Darin Kennedy
1684 Quarry Rd RR1
Coldwater
Green
Simcoe North Federal Green Party Association
Erik Schomann
309-30 Museum Drive
Orillia
People's Party of Canada
Barrie-Simcoe PPC Association
Stephen Makk
PO Box 543
Victoria Harbour
Members of Parliament [ ] Simcoe North has elected the following Members of Parliament to represent it in the House of Commons of Canada :
Election results [ ] Graph of election results in Simcoe North (since 1874 (by-election)-2019, minor parties that never got 2% of the vote or didn't run consistently are omitted)
2021 Canadian federal election
Party
Candidate
Votes
%
Conservative Adam Chambers 27,383
43.0
-0.4
Liberal Cynthia Wesley-Esquimaux
19,332
30.4
-0.4
New Democratic Janet-Lynne Durnford
9,958
15.7
+1.6
People's Stephen Makk
4,822
7.6
+5.8
Green Krystal Brooks
1,903
3.0
-6.4
Christian Heritage Russ Emo
210
0.3
Total valid votes
63,608
Total rejected ballots
294
Turnout
63,902 63.18
Eligible voters
101,144
Source: Elections Canada [4]
2019 Canadian federal election
Party
Candidate
Votes
%
Expenditures
Conservative Bruce Stanton 27,241
43.4
-0.12
$100,103.63
Liberal Gerry Hawes
19,310
30.8
-9.01
$83,974.59
New Democratic Angelique Belcourt
8,850
14.1
+3.52
$4,832.36
Green Valerie Powell
5,882
9.4
+4.94
$6,203.63
People's Stephen Makk
1,154
1.8
–
$4,480.03
Christian Heritage Chris Brown
341
0.5
-0.06
$2,923.18
Total valid votes/expense limit
62,778 100.0
Total rejected ballots
358
Turnout
63,136 65.0
Eligible voters
97,148
Conservative hold
Swing
+4.45
Source: Elections Canada [5] [6]
2015 Canadian federal election
Party
Candidate
Votes
%
Expenditures
Conservative Bruce Stanton 24,836
43.52
-10.36
$91,741.02
Liberal Liz Riley
22,718
39.81
+20.56
$74,044.17
New Democratic Richard Banigan
6,037
10.58
-9.85
$3,879.75
Green Peter Stubbins
2,543
4.46
-1.4
$11,996.03
Cooperative Interdependent
Jacob Kearey-Moreland
618
1.08
–
$2,744.47
Christian Heritage Scott Whittaker
319
0.56
-0.02
$2,753.34
Total valid votes/Expense limit
57,071 100.0 $224,845.90
Total rejected ballots
189 – –
Turnout
57,260 – –
Eligible voters
86,859
Conservative hold
Swing
-15.46
Source: Elections Canada [7] [8]
2011 federal election redistributed results[9]
Party
Vote
%
Conservative 27,796
53.88
New Democratic 10,540
20.43
Liberal 9,932
19.25
Green 3,021
5.86
Christian Heritage 301
0.58
2011 Canadian federal election
Party
Candidate
Votes
%
Expenditures
Conservative Bruce Stanton 31,581
54.5
+4.8
–
New Democratic Richard Banigan
11,515
19.9
+8.2
–
Liberal Steve Clarke
11,090
19.1
-8.6
–
Green Valerie Powell
3,489
6.0
-5.0
–
Christian Heritage Adrian Kooger
322
0.6
–
–
Total valid votes/Expense limit
57,997 100.0
Total rejected ballots
161 0.3 –
Turnout
58,158 64.9 –
Eligible voters
89,588 – –
Conservative hold
Swing
-1.7
2008 Canadian federal election
Party
Candidate
Votes
%
Expenditures
Conservative Bruce Stanton 26,328
49.7
+9.3
$84,616
Liberal Steve Clarke
14,670
27.7
-10.7
$87,766
New Democratic Richard Banigan
6,207
11.7
-2.4
$6,265
Green Valerie Powell
5,820
11.0
+5.0
$26,424
Total valid votes/Expense limit
53,025 100.0 $90,754
Note: Results are preliminary as of 18 October 2008.
2006 Canadian federal election
Party
Candidate
Votes
%
Conservative Bruce Stanton 23,266
40.4
+2.7
Liberal Karen Graham
22,078
38.4
-5.0
New Democratic Jen Hill
8,132
14.1
+2.8
Green Sandy Agnew
3,451
6.0
-0.4
Christian Heritage Adrian Kooger
617
1.1
+0.1
Total valid votes
57,544 100.0
2004 Canadian federal election
Party
Candidate
Votes
%
Liberal Paul Devillers 23,664
43.4
-7.4
Conservative Peter Stock
20,570
37.7
-6.2
New Democratic Jen Hill
6,162
11.3
+6.6
Green Mary Lou Kirby
3,486
6.4
Christian Heritage Adrian Kooger
544
1.0
+0.4
Canadian Action Ian Woods
145
0.3
Total valid votes
54,571 100.0
Note: Conservative vote is compared to the total of the Canadian Alliance vote and Progressive Conservative vote in 2000 election.
2000 Canadian federal election
Party
Candidate
Votes
%
Liberal Paul Devillers 24,510
50.8
+6.4
Alliance Peter Stock
14,283
29.6
+1.6
Progressive Conservative Lucy Stewart
6,914
14.3
-6.8
New Democratic Ann Billings
2,272
4.7
-0.1
Independent Adrian P. Kooger
305
0.6
Total valid votes
48,284 100.0
Note: Canadian Alliance vote is compared to the Reform vote in 1997 election.
1997 Canadian federal election
Party
Candidate
Votes
%
Liberal Paul Devillers 22,775
44.4
+3.9
Reform Peter Stock
14,363
28.0
-2.8
Progressive Conservative Sharon Henry
10,849
21.1
-2.0
New Democratic Ann Billings
2,488
4.8
+1.4
Green Adam Mazzara
388
0.8
Natural Law Peter Cameron
230
0.4
-0.1
Canadian Action Gloria Earl
213
0.4
Total valid votes
51,306 100.0
1993 Canadian federal election
Party
Candidate
Votes
%
Liberal Paul Devillers 23,047
40.5
+2.7
Reform Ray Lyons
17,498
30.8
Progressive Conservative Doug Lewis 13,145
23.1
-20.9
New Democratic Marsha Mitzak
1,958
3.4
-14.7
National Brian Stewart
845
1.5
Natural Law Garry Foster
300
0.5
Abolitionist Bobby-Joe Edwards
67
0.1
Total valid votes
56,860 100.0
1988 Canadian federal election
Party
Candidate
Votes
%
Progressive Conservative Doug Lewis 21,847
44.0
-10.9
Liberal Alan Martin 18,755
37.8
+11.2
New Democratic Mike McMurter
8,995
18.1
+1.0
Total valid votes
49,597 100.0
1984 Canadian federal election
Party
Candidate
Votes
%
Progressive Conservative Doug Lewis 24,887
55.0
+18.5
Liberal Alan Martin 12,062
26.6
-9.6
New Democratic Tim Tynan
7,742
17.1
-10.2
Green John Brandon Letts
362
0.8
Libertarian Ian Mcteer
229
0.5
Total valid votes
45,282 100.0
1980 Canadian federal election
Party
Candidate
Votes
%
Progressive Conservative Doug Lewis 14,874
36.4
-10.0
Liberal Alan Martin 14,808
36.3
+9.7
New Democratic Fayne Bullen
11,139
27.3
+0.3
Total valid votes
40,821 100.0
1979 Canadian federal election
Party
Candidate
Votes
%
Progressive Conservative Doug Lewis 19,388
46.4
+6.2
New Democratic Fayne Bullen
11,284
27.0
+4.7
Liberal Walter Connell
11,099
26.6
+4.3
Total valid votes
41,771 100.0
1974 Canadian federal election
Party
Candidate
Votes
%
Progressive Conservative P.B. Rynard 18,950
40.2
-7.7
Liberal Janice Laking
17,068
36.2
+3.7
New Democratic Fayne Bullen
10,502
22.3
+2.8
Independent Stephen Ridley
330
0.7
Social Credit Bruce Arnold
267
0.6
Total valid votes
47,117 100.0
1972 Canadian federal election
Party
Candidate
Votes
%
Progressive Conservative P.B. Rynard 22,145
47.9
+2.1
Liberal Bruce Owen
15,038
32.6
-8.6
New Democratic Rich Partridge
9,016
19.5
+6.5
Total valid votes
46,199 100.0
1968 Canadian federal election
Party
Candidate
Votes
%
Progressive Conservative P.B. Rynard 16,619
45.8
+0.3
Liberal Bill A. Bell
14,936
41.2
0.0
New Democratic Charles Perrie Rintoul
4,730
13.0
+5.0
Total valid votes
36,285 100.0
1965 Canadian federal election
Party
Candidate
Votes
%
Progressive Conservative Heber Smith 9,513
45.5
-0.4
Liberal Bill Bell
8,590
41.1
+3.3
New Democratic Ed Genge
1,677
8.0
-0.8
Social Credit Mel Rowat
1,109
5.3
-3.6
Total valid votes
20,889 100.0
1963 Canadian federal election
Party
Candidate
Votes
%
Progressive Conservative Heber Smith 10,157
45.9
-12.2
Liberal Ralph Snelgrove
8,374
37.8
+7.1
Social Credit Williard Kinzie
1,961
8.9
-2.4
New Democratic Russell Pogue
963
4.4
Independent Conservative
Jack Browne
678
3.1
Total valid votes
22,133 100.0
1962 Canadian federal election
Party
Candidate
Votes
%
Progressive Conservative Heber Smith 11,728
58.1
-12.1
Liberal Hank Howard
6,210
30.7
+0.9
New Democratic Russell Pogue
2,265
11.2
Total valid votes
20,203 100.0
1958 Canadian federal election
Party
Candidate
Votes
%
Progressive Conservative Heber Smith 13,855
70.2
+7.7
Liberal William S. Campbell
5,890
29.8
-7.7
Total valid votes
19,745 100.0
1957 Canadian federal election
Party
Candidate
Votes
%
Progressive Conservative Heber Smith 11,437
62.5
+10.9
Liberal William Seymour Campbell
6,860
37.5
-10.9
Total valid votes
18,297 100.0
1953 Canadian federal election
Party
Candidate
Votes
%
Progressive Conservative Julian Harcourt Ferguson 8,316
51.6
+1.6
Liberal Ralph Trapnell Snelgrove
7,796
48.4
+5.2
Total valid votes
16,112 100.0
1949 Canadian federal election
Party
Candidate
Votes
%
Progressive Conservative Julian Harcourt Ferguson 7,658
50.0
-3.0
Liberal J. Gladstone Currie
6,613
43.2
+2.7
Co-operative Commonwealth Reginald Edward Ayres
1,053
6.9
+0.3
Total valid votes
15,324 100.0
Note: Progressive Conservative vote is compared to "National Government" vote in 1940 election.
Note: "National Government" vote is compared to Conservative vote in 1935 election.
1935 Canadian federal election
Party
Candidate
Votes
%
Liberal Duncan Fletcher McCuaig 7,244
50.1
Conservative John Thomas Simpson 5,290
36.6
-16.5
Reconstruction Herbert James Crawford
1,324
9.2
Co-operative Commonwealth Seymour Cornwall Cooper
608
4.2
Total valid votes
14,466 100.0
1930 Canadian federal election
Party
Candidate
Votes
%
Conservative John Thomas Simpson 7,295
53.0
+2.3
Progressive Ernest Charles Drury 6,459
47.0
-2.3
Total valid votes
13,754 100.0
1926 Canadian federal election
Party
Candidate
Votes
%
Conservative William Alves Boys 7,058
50.7
-1.5
Progressive Ernest Charles Drury 6,865
49.3
+1.5
Total valid votes
13,923 100.0
1925 Canadian federal election
Party
Candidate
Votes
%
Conservative William Alves Boys 6,885
52.2
+8.7
Progressive Ernest Drury 6,295
47.8
-3.6
Total valid votes
13,180 100.0
1921 Canadian federal election
Party
Candidate
Votes
%
Progressive Thomas Edwin Ross 5,298
51.4
Conservative John Allister Currie
4,489
43.5
-21.4
Independent William John Holden
527
5.1
Total valid votes
10,314 100.0
Note: Conservative vote is compared to Government vote in 1917 election.
1917 Canadian federal election
Party
Candidate
Votes
%
Government (Unionist) John Allister Currie 4,240
64.9
+13.2
Opposition (Laurier Liberals) Ernest Drury 2,293
35.1
-13.2
Total valid votes
6,533 100.0
Note: Government vote is compared to Conservative vote in 1911 election, and Opposition vote is compared to Liberal vote.
1908 Canadian federal election
Party
Candidate
Votes
%
Conservative John Allister Currie 2,756
50.5
+0.9
Liberal Daniel Wilson
2,705
49.5
Total valid votes
5,461 100.0
1900 Canadian federal election
Party
Candidate
Votes
%
Independent Leighton Goldie McCarthy 2,524
56.6
Conservative Charles Cameron
1,936
43.4
+25.2
Total valid votes
4,460 100.0
Note: popular vote compared to vote in 1896 general election.
By-election on 14 December 1898
On Mr. McCarthy's death, 11 May 1898
Party
Candidate
Votes
Independent Leighton Goldie McCarthy elected
1891 Canadian federal election
Party
Candidate
Votes
%
Independent Dalton McCarthy 2,417
53.3
-0.4
Liberal Herman Henry Cook 2,121
46.7
+0.5
Total valid votes
4,538 100.0
1887 Canadian federal election
Party
Candidate
Votes
%
Conservative Dalton McCarthy 2,362
53.7
-0.1
Liberal Timothy Warren Anglin 2,033
46.3
Total valid votes
4,395 100.0
1882 Canadian federal election
Party
Candidate
Votes
%
Conservative Dalton McCarthy 1,761
53.8
+3.4
Independent Charles Drury 1,511
46.2
Total valid votes
3,272 100.0
Canadian federal by-election, 26 December 1874
Party
Candidate
Votes
%
On Mr. Cook being unseated on petition, 11 November 1874
Liberal Herman Henry Cook 2,355
50.8
-1.0
Conservative Dalton McCarthy 2,281
49.2
+1.0
Total valid votes
4,636 100.0
1872 Canadian federal election
Party
Candidate
Votes
%
Liberal Herman Henry Cook 1,908
50.7
Conservative Dalton McCarthy 1,852
49.3
Total valid votes
3,760 100.0
See also [ ] References [ ] Notes [ ]
Federal ridings in Central Ontario
Conservative Liberal
Federal ridings in Ontario
Central Eastern S Durham
City of Toronto Suburbs & Downtown )
Cities of Brampton &
Brampton
Brampton Centre Brampton East Brampton North Brampton South Brampton West Mississauga
Southern
Southwestern Halton City of Hamilton Niagara
Niagara Centre Niagara Falls Niagara West St. Catharines
Midwestern Northern Southwestern Ottawa See also : Provincial ridings in Ontario
Until 2015 Until 2006 Until 2004 Until 2000 Until 1997 Until 1993 Until 1988 Until 1984 Until 1979 Until 1974 Until 1972 Until 1968 Until 1953 Until 1949 Until 1935 Until 1925 Until 1917 Until 1904 Until 1896 Until 1882
Coordinates : 44°41′N 79°38′W / 44.68°N 79.64°W / 44.68; -79.64