For the federal electoral district, see
Ottawa South . For the neighbourhood in Ottawa, see
Old Ottawa South . For the soccer team, see
Ottawa South United .
Coordinates : 45°21′N 75°38′W / 45.350°N 75.633°W / 45.350; -75.633
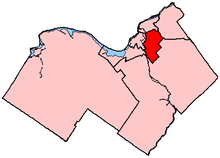
Ottawa South electoral district Ottawa South in relation to other Ottawa electoral districts
Legislature Legislative Assembly of Ontario MPP John Fraser Liberal District created 1925 First contested 1926 Last contested 2018 Population (2011) 121,921 Electors (2013)86,346 Area (km²) 76 Pop. density (per km²) 1,604.2 Census division(s) Ottawa Census subdivision(s) Ottawa
Ottawa South (French : Ottawa-Sud electoral district (riding ) in the Canadian province of Ontario , in the city of Ottawa .
History [ ] The district was created in 1925 from part of Ottawa West . Prior to the 1999 election , the provincial district did not have the same borders as the federal district.
Prior to the 1967 redistribution, the riding shared no common area with the present riding. Present day Ottawa South could be found in the riding of Russell prior to 1967.
After having been firmly conservative for the first 60 years, it has been in the hands of the Liberals without interruption since 1987. From 1987 to 2013, it was held by two generations of the McGuinty family–father Dalton Sr. from 1987 to 1990 and son Dalton Jr. from 1990 to 2013.
Members of the Provincial Parliament [ ] Election results [ ] 2018 general election [ ]
2018 Ontario general election
Party
Candidate
Votes
%
Liberal John Fraser 20,773
39.63
−10.40
Progressive Conservative Karin Howard 15,319
29.23
-2.63
New Democratic Eleanor Fast
14,250
27.19
+14.82
Green Les Schram
1,618
3.09
−1.26
Libertarian Robert Daigneault
342
0.65
+0.07
Communist Larry Wasslen
114
0.22
−0.08
Total valid votes
52,616 100.0
Liberal hold
Swing
Source: Elections Ontario [1]
2014 general election [ ]
2014 Ontario general election
Party
Candidate
Votes
%
Liberal John Fraser 23,708
49.96
+7.70
Progressive Conservative Matt Young
15,235
32.11
−6.84
New Democratic Bronwyn Funiciello
5,817
12.26
−1.93
Green Matt Lakatos-Hayward
2,034
4.29
+1.23
Libertarian Jean-Serge Brisson 273
0.58
−0.01
Special Needs John Redins
244
0.51
+0.22
Communist Espoir Manirambona
139
0.29
Total valid votes
47,450 100.0
Total rejected, unmarked and declined ballots
432 0.91
Turnout
47,882 53.71
Eligible voters
89,150
Liberal hold
Swing
+7.27
2013 by-election [ ]
Election signs for John Fraser (Liberal), Taylor Howarth (Green), Bronwyn Funiciello (NDP) and Matt Young (PC)
Dalton McGuinty resigned the Premiership of Ontario in February 2013, but decided to stay on as MPP of Ottawa South until the next election. McGuinty changed his mind however, and resigned on June 12 amid the "gas plant scandal".
Opinion polls [ ]
Polling Firm
Date of Polling
Link
Liberal PC NDP Green Other
Type of poll
Margin of error
Forum Research
July 31
PDF
36
52
9
3
0
IVR
4%
July 30
PDF [permanent dead link 35
42
12
6
5
IVR
4.5%
Forum Research
July 24
HTML
34
48
12
5
1
IVR
4%
July 15
PDF [permanent dead link 37
38
17
5
2
IVR
5.1%
Forum Research
July 3
HTML
42
38
17
4
3
IVR
5%
Forum Research
June 13
HTML
34
37
22
4
2
IVR
4%
Results [ ]
Dalton McGuinty
Party
Candidate
Votes
%
Expenditures
Liberal John Fraser 14,921
42.33
−6.53
$ 95,351.00
Progressive Conservative Matt Young
13,642
38.70
+5.27
89,316.00
New Democratic Bronwyn Funiciello
5,042
14.30
+0.91
40,274.11
Green Taylor Howarth
1,099
3.12
−0.11
2,212.50
Libertarian Jean-Serge Brisson 208
0.59
+0.03
0.00
Special Needs John Redins
102
0.29
−0.24
0.00
Independent Daniel Post
91
0.26
0.00
Freedom Dave McGruer
85
0.24
0.00
Pauper John Turmel 58
0.16
0.00
Total valid votes / Expense limit
35,248 100.00 −21.16 $ 104,501.00
Total rejected, unmarked and declined ballots
216 0.61 +0.12
Turnout
35,464 40.38 −10.81
Eligible voters
87,816 +0.06
Liberal hold
Swing
−5.90
Elections 1926-2011 [ ]
Map showing the winning party in each polling division shaded by vote percentage in the 2011 election
2011 Ontario general election
Party
Candidate
Votes
%
Expenditures
Liberal Dalton McGuinty 21,842
48.86
−1.28
$ 74,137.81
Progressive Conservative Jason MacDonald 14,945
33.43
+3.77
48,914.10
New Democratic Wali Farah
5,988
13.39
+4.07
15,509.77
Green James Mihaychuk
1,442
3.23
−4.92
3,566.26
Libertarian Jean-Serge Brisson 252
0.56
−0.24
0.00
Special Needs John Redins
238
0.53
0.00
Total valid votes
44,707 100.00 −6.67 $ 104,477.24
Total rejected, unmarked and declined ballots
222 0.49 −0.29
Turnout
44,929 51.19 −5.41
Eligible voters
87,766 +2.88
Liberal hold
Swing
−2.52
2007 Ontario general election
Party
Candidate
Votes
%
Expenditures
Liberal Dalton McGuinty 24,015
50.13
−1.30ᴿ
$ 68,501.89
Progressive Conservative Richard Raymond
14,206
29.66
−4.24ᴿ
80,475.86
New Democratic Edelweiss D'Andrea
4,467
9.33
+0.26ᴿ
19,220.39
Green John Ford
3,902
8.15
+4.49
2,069.63
Family Coalition David MacDonald
927
1.94
+0.76
2,294.17
Libertarian Jean-Serge Brisson 384
0.80
118.38
Total valid votes/Expense limit
47,901 100.0 +1.28 $ 92,129.40
Total rejected ballots
380 0.79 +0.17
Turnout
48,281 56.60 −2.17
Eligible voters
85,305 +4.52
Liberal hold
Swing
1.47ᴿ
ᴿ
2003 Ontario general election
Party
Candidate
Votes
%
Expenditures
Liberal Dalton McGuinty 24,647
51.70
+2.11
$ 70,963.18
Progressive Conservative Richard Raymond
16,413
34.43
−7.80
75,453.48
New Democratic James McLaren
4,306
9.03
+3.23
12,014.97
Green David Chernushenko 1,741
3.65
+2.07
2,884.13
Family Coalition John Pacheco
562
1.18
9,388.75
Total valid votes/Expense limit
47,669 100.0 +4.11 $ 78,349.44
Total rejected ballots
296 0.62 −0.16
Turnout
47,965 58.77 +1.03
Eligible voters
81,614 +2.12
Liberal hold
Swing
+4.96
1999 Ontario general election
Party
Candidate
Votes
%
Expenditures
Liberal Dalton McGuinty 22,707
49.59
−3.76
$ 62,090.51
Progressive Conservative Mike Nicholson
19,337
42.23
+12.41
20,397.04
New Democratic James McLaren
2,655
5.80
−8.86
14,683.16
Green George Brown 724
1.58
+0.26
0.00
Independent Meg Carson
243
0.53
8.09
Natural Law James Hea
121
0.26
−0.58
0.00
Total valid votes/Expense limit
45,787 100.0 +58.44 $ 76,725.12
Total rejected ballots
360 0.78 −0.01
Turnout
46,147 57.74 −8.77
Eligible voters
79,922 +82.50
Liberal hold
Swing
−8.09
Note: Boundaries significantly adjusted. Percentage change not adjusted to reflected redistribution.
Map of the Ottawa South provincial electoral district for the 1987, 1990 and 1995 elections.
1995 Ontario general election
Party
Candidate
Votes
%
Expenditures
Liberal Dalton McGuinty 15,418
53.35
+7.48
$ 38,581.00
Progressive Conservative Linda Thom 8,618
29.82
+5.31
28,456.94
New Democratic Margaret Armstrong
4,235
14.65
−11.27
16,082.17
Green Karen Fyson
383
1.33
−0.70
0.00
Natural Law Wayne Foster
245
0.85
0.00
Total valid votes/Expense limit
28,899 100.0 −4.26 $ 44,698.00
Total rejected ballots
229 0.79
Turnout
29,128 66.51
Eligible voters
43,793
1990 Ontario general election
Party
Candidate
Votes
%
Liberal Dalton McGuinty 13,845
45.87
−5.01
New Democratic Margaret Armstrong
7,826
25.93
+6.67
Progressive Conservative Darrel Kent 7,399
24.51
−5.36
Green Stephen Johns
612
2.03
Family Coalition David Fitzpatrick
503
1.67
Total valid votes
30,185 100.0 −3.73
1987 Ontario general election
Party
Candidate
Votes
%
Liberal Dalton McGuinty, Sr. 15,952
50.88
+15.53
Progressive Conservative Michael McSweeney
9,365
29.87
−9.54
New Democratic Penina Coopersmith
6,038
19.26
−5.99
Total valid votes
31,355 100.0 −4.74
1985 Ontario general election
Party
Candidate
Votes
%
Progressive Conservative Claude Bennett 12,971
39.41
−10.56
Liberal Andrew Caddell
11,634
35.34
+6.34
New Democratic John Smart
8,311
25.25
+5.07
Total valid votes
32,916 100.0 +8.08
1981 Ontario general election
Party
Candidate
Votes
%
Progressive Conservative Claude Bennett 15,218
49.97
+0.60
Liberal Robert Dyck
8,832
29.00
+3.05
New Democratic Chris Chilton
6,146
20.18
−2.80
Independent Ray Turmel
259
0.85
Total valid votes
30,455 100.0 −9.76
1977 Ontario general election
Party
Candidate
Votes
%
Progressive Conservative Claude Bennett 16,662
49.37
+6.22
New Democratic Eileen Scotton
8,759
25.95
−6.48
Liberal Patricia Thorpe
7,754
22.98
−1.45
Independent Michael Holton
574
1.70
Total valid votes
33,749 100.0 −1.39
Map of the Ottawa South provincial electoral district for the 1967, 1971 and 1975 elections
1975 Ontario general election
Party
Candidate
Votes
%
Progressive Conservative Claude Bennett 14,767
43.15
−8.52
New Democratic Eileen Scotton
11,099
32.43
+7.88
Liberal Patricia Thorpe
8,360
24.43
+0.64
Total valid votes
34,226 100.0 −21.02
1971 Ontario general election
Party
Candidate
Votes
%
Progressive Conservative Claude Bennett 22,392
51.67
+4.16
New Democratic Don Francis
10,638
24.55
+15.62
Liberal Ian Kimmerly
10,307
23.78
−19.78
Total valid votes
43,337 100.0 +52.84
1967 Ontario general election
Party
Candidate
Votes
%
Progressive Conservative Irwin Haskett 13,472
47.51
−6.99
Liberal Joseph McDonald
12,351
43.56
+3.40
New Democratic William Hardy
2,531
8.93
+3.59
Total valid votes
28,354 100.0 +21.95
1954-1966: Ward 5 (Old Ottawa South , the Glebe ) and that part of Wards 4 (Centretown ) and 6 (Dalhousie Ward ) south of Sparks Street and Wellington Street (West) .
1963 Ontario general election
Party
Candidate
Votes
%
Progressive Conservative Irwin Haskett 12,671
54.50
+2.84
Liberal Joseph McDonald
9,338
40.16
−4.06
New Democratic Peter Hopwood
1,241
5.34
+1.22
Total valid votes
23,250 100.0 −7.54
1959 Ontario general election
Party
Candidate
Votes
%
Progressive Conservative Irwin Haskett 12,989
51.66
−2.28
Liberal Archibald M. Laidlaw
11,119
44.22
+2.35
Co-operative Commonwealth John Fisher
1,037
4.12
+0.97
Total valid votes
25,145 100.0 −4.15
1955 Ontario general election
Party
Candidate
Votes
%
Progressive Conservative George H. Dunbar 14,151
53.94
−2.04
Liberal Kenneth Fogarty 10,984
41.87
+6.88
Co-operative Commonwealth Allen Schroeder
826
3.15
−5.88
Labor–Progressive Daniel Nerenberg
273
1.04
Total valid votes
26,234 100.0 −26.23
1933-1954: Capital Ward , Dalhousie Ward , Central Ward , Wellington Ward , that part of Riverdale Ward west of Main Street and that part of Elmdale Ward east of Parkdale Avenue .
1951 Ontario general election
Party
Candidate
Votes
%
Progressive Conservative George H. Dunbar 19,908
55.98
+0.85
Liberal Kenneth Fogarty 12,444
34.99
+6.45
Co-operative Commonwealth Melville Fleming
3,212
9.03
−5.95
Total valid votes
35,564 100.0 +3.43
1948 Ontario general election
Party
Candidate
Votes
%
Progressive Conservative George H. Dunbar 18,955
55.13
−5.79
Liberal William R. Burnett
9,813
28.54
+3.23
Co-operative Commonwealth Milton C. Anderson
5,151
14.98
+1.69
Union of Electors Terrence O'Reilly
279
0.81
Socialist Labour William Leckie
185
0.54
+0.06
Total valid votes
34,383 100.0 −11.30
1945 Ontario general election
Party
Candidate
Votes
%
Progressive Conservative George H. Dunbar 23,616
60.92
+16.87
Liberal 9,813
25.31
−9.24
Co-operative Commonwealth Eugene Forsey 5,151
13.29
−7.42
Socialist Labour E. Irving
185
0.48
−0.21
Total valid votes
38,765 100.0 +43.87
1943 Ontario general election
Party
Candidate
Votes
%
Progressive Conservative George H. Dunbar 11,870
44.05
−6.15
Liberal Leonard L. Coulter
9,311
34.56
−13.08
Co-operative Commonwealth Walter B. Mann
5,579
20.71
Socialist Labour Edward A. Irving
185
0.69
−0.11
Total valid votes
26,945 100.0 −22.45
1937 Ontario general election
Party
Candidate
Votes
%
Conservative George H. Dunbar 17,443
50.20
+2.64
Liberal John H. Putnam
16,550
47.63
+0.76
Communist Harry Binder
408
1.17
+0.64
Socialist Labour Peter Leckie
276
0.79
Independent James C. Sidey
69
0.20
Total valid votes
34,746 100.0 −2.69
1934 Ontario general election
Party
Candidate
Votes
%
Conservative Arthur Ellis 16,983
47.56
Liberal Percy O. Wilson
16,737
46.87
Co-operative Commonwealth William Henry Chapman
1,531
4.29
Communist John Lyons
192
0.54
Independent Joseph B. O'Reilly
165
0.46
Independent Duncan McNaughton
100
0.28
Total valid votes
35,708 100.0
1925-1933: Dalhousie Ward and Capital Ward
2007 electoral reform referendum [ ] Riding associations [ ] Riding associations are the local branches of the provincial political parties: [1]
Sources
References [ ]
Provincial ridings in Ontario
Northern Eastern Central Midwestern Southwestern Peel Hamilton, Halton, Ottawa Durham and York Toronto