1988 United States presidential election in North Dakota
| ||||||||||||||||||||||||||
| ||||||||||||||||||||||||||
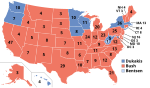
 County Results
| ||||||||||||||||||||||||||
| ||||||||||||||||||||||||||


| Elections in North Dakota |
|---|
 |
|
show |
|
show |
The 1988 United States presidential election in North Dakota took place on November 8, 1988. All 50 states and the District of Columbia were part of the 1988 United States presidential election. State voters chose three electors to the Electoral College, which selected the president and vice president.
North Dakota was won by incumbent United States Vice President George H. W. Bush of Texas, who was running against Massachusetts Governor Michael Dukakis. Bush ran with Indiana Senator Dan Quayle as Vice President, and Dukakis ran with Texas Senator Lloyd Bentsen. Bush won the election in North Dakota with a solid 13-point landslide. While North Dakota has typically voted conservative in presidential elections, the election results in North Dakota were also reflective of a nationwide political reconsolidation of base for the Republican Party, which took place through the 1980s. Through the passage of some very controversial economic programs, spearheaded by then President Ronald Reagan (called, collectively, "Reaganomics"), the mid-to-late 1980s saw a period of economic growth and stability. The hallmark for Reaganomics was, in part, the wide-scale deregulation of corporate interests, and tax cuts for the wealthy.[1]
Dukakis ran on a socially liberal platform and advocated for higher economic regulation and environmental protection. Bush, alternatively, ran on a campaign of continuing the social and economic policies of former President Ronald Reagan, which gained him much support with social conservatives and people living in rural areas. Additionally, while the economic programs passed under Reagan and furthered under Bush and Bill Clinton may have boosted the economy for a brief period, they are criticized by many analysts as "setting the stage" for economic troubles in the United States after 2007, such as the Great Recession.[2]
The election was very partisan, with nearly 99 percent of the electorate voting for either the Democratic or Republican parties.[3] All major counties in North Dakota gave pluralities for Bush, including the relatively highly populated center of Cass County, which contains the city of Fargo. As has been typical ever since the 1960s, however, Dukakis gained large majorities in the two predominantly Native American counties of Rolette in the north and Sioux in the south, and he also carried by smaller margins a number of other counties in the northern and eastern portions of the state. This is one of only two elections since 1952 where national bellwether Sargent County in the state's southeast supported a losing candidate,[4] with the anomaly most likely due to the farm crisis.
North Dakota weighed in for this election as five percent more Republican than the national average, a much smaller margin than usual due to the persistent farm crisis of the 1980s. As of the 2020 presidential election this remains relatively the least Republican the state has been since Nixon's landslide win in 1972,[5] when a "favorite son" effect with George McGovern from neighboring South Dakota was a likely influence.
Primary[]
North Dakota held the last primary of the election season on June 14th, by which time the party nominations had effectively already been secured. Libertarian candidate Ron Paul entered due to it being an open primary,[6] receiving 985 votes. For the Republicans, Bush received 37,062 votes to 2,372 for perennial candidate Mary Jane Rachner of Minnesota[7] while Dukakis garnered 2,890 votes compared to 515 for Jesse Jackson.[8]
Results[]
| 1988 United States presidential election in North Dakota | |||||
|---|---|---|---|---|---|
| Party | Candidate | Votes | Percentage | Electoral votes | |
| Republican | George H. W. Bush | 166,559 | 56.03% | 3 | |
| Democratic | Michael Dukakis | 127,739 | 42.97% | 0 | |
| Libertarian | Ron Paul | 1,315 | 0.44% | 0 | |
| National Economic Recovery | Lyndon LaRouche | 905 | 0.30% | 0 | |
| New Alliance Party | Lenora Fulani | 396 | 0.13% | 0 | |
| Socialist Workers Party | James Warren | 347 | 0.12% | 0 | |
| Totals | 297,261 | 100.0% | 3 | ||
Results by county[]
| County[9] | George Herbert Walker Bush Republican |
Michael Stanley Dukakis Democratic |
Ronald Ernest Paul Libertarian |
Lyndon Hermyle LaRouche National Economic Recovery |
Leonora Branch Fulani New Alliance |
James “Mac” Warren Socialist Workers |
Margin | Total votes cast | |||||||
|---|---|---|---|---|---|---|---|---|---|---|---|---|---|---|---|
| # | % | # | % | # | % | # | % | # | % | # | % | # | % | ||
| Adams | 1,018 | 58.61% | 708 | 40.76% | 1 | 0.06% | 4 | 0.23% | 4 | 0.23% | 2 | 0.12% | 310 | 17.85% | 1,737 |
| Barnes | 3,631 | 55.47% | 2,858 | 43.66% | 24 | 0.37% | 17 | 0.26% | 8 | 0.12% | 8 | 0.12% | 773 | 11.81% | 6,546 |
| Benson | 1,316 | 43.42% | 1,691 | 55.79% | 5 | 0.16% | 13 | 0.43% | 6 | 0.20% | 0 | 0.00% | -375 | -12.37% | 3,031 |
| Billings | 437 | 66.31% | 211 | 32.02% | 11 | 1.67% | 0 | 0.00% | 0 | 0.00% | 0 | 0.00% | 226 | 34.29% | 659 |
| Bottineau | 2,530 | 59.52% | 1,684 | 39.61% | 17 | 0.40% | 17 | 0.40% | 3 | 0.07% | 0 | 0.00% | 846 | 19.90% | 4,251 |
| Bowman | 1,111 | 59.51% | 737 | 39.48% | 8 | 0.43% | 7 | 0.37% | 3 | 0.16% | 1 | 0.05% | 374 | 20.03% | 1,867 |
| Burke | 971 | 57.46% | 693 | 41.01% | 11 | 0.65% | 11 | 0.65% | 2 | 0.12% | 2 | 0.12% | 278 | 16.45% | 1,690 |
| Burleigh | 18,000 | 61.89% | 10,760 | 37.00% | 132 | 0.45% | 101 | 0.35% | 53 | 0.18% | 38 | 0.13% | 7,240 | 24.89% | 29,084 |
| Cass | 26,699 | 54.34% | 22,107 | 44.99% | 181 | 0.37% | 75 | 0.15% | 36 | 0.07% | 39 | 0.08% | 4,592 | 9.35% | 49,137 |
| Cavalier | 2,096 | 60.63% | 1,333 | 38.56% | 8 | 0.23% | 9 | 0.26% | 6 | 0.17% | 5 | 0.14% | 763 | 22.07% | 3,457 |
| Dickey | 2,064 | 61.87% | 1,249 | 37.44% | 14 | 0.42% | 6 | 0.18% | 1 | 0.03% | 2 | 0.06% | 815 | 24.43% | 3,336 |
| Divide | 869 | 49.15% | 875 | 49.49% | 5 | 0.28% | 15 | 0.85% | 4 | 0.23% | 0 | 0.00% | -6 | -0.34% | 1,768 |
| Dunn | 1,263 | 57.99% | 892 | 40.96% | 5 | 0.23% | 10 | 0.46% | 5 | 0.23% | 3 | 0.14% | 371 | 17.03% | 2,178 |
| Eddy | 891 | 53.74% | 748 | 45.11% | 8 | 0.48% | 3 | 0.18% | 3 | 0.18% | 5 | 0.30% | 143 | 8.62% | 1,658 |
| Emmons | 1,634 | 62.94% | 925 | 35.63% | 10 | 0.39% | 16 | 0.62% | 8 | 0.31% | 3 | 0.12% | 709 | 27.31% | 2,596 |
| Foster | 1,218 | 58.84% | 837 | 40.43% | 5 | 0.24% | 7 | 0.34% | 1 | 0.05% | 2 | 0.10% | 381 | 18.41% | 2,070 |
| Golden Valley | 781 | 66.02% | 388 | 32.80% | 6 | 0.51% | 8 | 0.68% | 0 | 0.00% | 0 | 0.00% | 393 | 33.22% | 1,183 |
| Grand Forks | 14,801 | 53.76% | 12,494 | 45.38% | 133 | 0.48% | 45 | 0.16% | 26 | 0.09% | 32 | 0.12% | 2,307 | 8.38% | 27,531 |
| Grant | 1,351 | 66.13% | 654 | 32.01% | 16 | 0.78% | 15 | 0.73% | 1 | 0.05% | 6 | 0.29% | 697 | 34.12% | 2,043 |
| Griggs | 1,020 | 54.11% | 846 | 44.88% | 13 | 0.69% | 3 | 0.16% | 2 | 0.11% | 1 | 0.05% | 174 | 9.23% | 1,885 |
| Hettinger | 1,395 | 66.08% | 698 | 33.06% | 5 | 0.24% | 8 | 0.38% | 4 | 0.19% | 1 | 0.05% | 697 | 33.02% | 2,111 |
| Kidder | 1,039 | 59.00% | 678 | 38.50% | 23 | 1.31% | 13 | 0.74% | 4 | 0.23% | 4 | 0.23% | 361 | 20.50% | 1,761 |
| LaMoure | 1,642 | 56.60% | 1,223 | 42.16% | 10 | 0.34% | 10 | 0.34% | 8 | 0.28% | 8 | 0.28% | 419 | 14.44% | 2,901 |
| Logan | 1,111 | 66.49% | 540 | 32.32% | 11 | 0.66% | 4 | 0.24% | 1 | 0.06% | 4 | 0.24% | 571 | 34.17% | 1,671 |
| McHenry | 1,888 | 52.69% | 1,665 | 46.47% | 14 | 0.39% | 9 | 0.25% | 2 | 0.06% | 5 | 0.14% | 223 | 6.22% | 3,583 |
| McIntosh | 1,726 | 73.54% | 598 | 25.48% | 9 | 0.38% | 11 | 0.47% | 1 | 0.04% | 2 | 0.09% | 1,128 | 48.06% | 2,347 |
| McKenzie | 1,949 | 59.91% | 1,273 | 39.13% | 14 | 0.43% | 12 | 0.37% | 1 | 0.03% | 4 | 0.12% | 676 | 20.78% | 3,253 |
| McLean | 2,906 | 53.85% | 2,428 | 45.00% | 30 | 0.56% | 21 | 0.39% | 5 | 0.09% | 6 | 0.11% | 478 | 8.86% | 5,396 |
| Mercer | 3,013 | 61.46% | 1,843 | 37.60% | 22 | 0.45% | 17 | 0.35% | 4 | 0.08% | 3 | 0.06% | 1,170 | 23.87% | 4,902 |
| Morton | 5,588 | 53.49% | 4,708 | 45.07% | 68 | 0.65% | 50 | 0.48% | 17 | 0.16% | 16 | 0.15% | 880 | 8.42% | 10,447 |
| Mountrail | 1,443 | 41.73% | 1,977 | 57.17% | 17 | 0.49% | 12 | 0.35% | 5 | 0.14% | 4 | 0.12% | -534 | -15.44% | 3,458 |
| Nelson | 1,078 | 48.06% | 1,151 | 51.32% | 5 | 0.22% | 3 | 0.13% | 2 | 0.09% | 4 | 0.18% | -73 | -3.25% | 2,243 |
| Oliver | 696 | 56.27% | 526 | 42.52% | 4 | 0.32% | 8 | 0.65% | 2 | 0.16% | 1 | 0.08% | 170 | 13.74% | 1,237 |
| Pembina | 2,471 | 59.56% | 1,616 | 38.95% | 40 | 0.96% | 13 | 0.31% | 6 | 0.14% | 3 | 0.07% | 855 | 20.61% | 4,149 |
| Pierce | 1,422 | 57.41% | 1,008 | 40.69% | 22 | 0.89% | 16 | 0.65% | 3 | 0.12% | 6 | 0.24% | 414 | 16.71% | 2,477 |
| Ramsey | 3,103 | 53.12% | 2,665 | 45.63% | 22 | 0.38% | 31 | 0.53% | 12 | 0.21% | 8 | 0.14% | 438 | 7.50% | 5,841 |
| Ransom | 1,362 | 47.66% | 1,459 | 51.05% | 13 | 0.45% | 9 | 0.31% | 10 | 0.35% | 5 | 0.17% | -97 | -3.39% | 2,858 |
| Renville | 893 | 51.03% | 837 | 47.83% | 5 | 0.29% | 8 | 0.46% | 1 | 0.06% | 6 | 0.34% | 56 | 3.20% | 1,750 |
| Richland | 4,670 | 56.44% | 3,523 | 42.58% | 31 | 0.37% | 26 | 0.31% | 10 | 0.12% | 14 | 0.17% | 1,147 | 13.86% | 8,274 |
| Rolette | 1,126 | 31.23% | 2,426 | 67.28% | 22 | 0.61% | 18 | 0.50% | 7 | 0.19% | 7 | 0.19% | -1,300 | -36.05% | 3,606 |
| Sargent | 1,119 | 45.94% | 1,306 | 53.61% | 4 | 0.16% | 5 | 0.21% | 1 | 0.04% | 1 | 0.04% | -187 | -7.68% | 2,436 |
| Sheridan | 885 | 67.15% | 428 | 32.47% | 1 | 0.08% | 3 | 0.23% | 1 | 0.08% | 0 | 0.00% | 457 | 34.67% | 1,318 |
| Sioux | 325 | 31.19% | 701 | 67.27% | 7 | 0.67% | 5 | 0.48% | 3 | 0.29% | 1 | 0.10% | -376 | -36.08% | 1,042 |
| Slope | 315 | 59.43% | 202 | 38.11% | 7 | 1.32% | 3 | 0.57% | 2 | 0.38% | 1 | 0.19% | 113 | 21.32% | 530 |
| Stark | 6,137 | 61.35% | 3,678 | 36.77% | 59 | 0.59% | 65 | 0.65% | 47 | 0.47% | 17 | 0.17% | 2,459 | 24.58% | 10,003 |
| Steele | 690 | 43.26% | 895 | 56.11% | 5 | 0.31% | 3 | 0.19% | 1 | 0.06% | 1 | 0.06% | -205 | -12.85% | 1,595 |
| Stutsman | 5,375 | 55.59% | 4,214 | 43.58% | 29 | 0.30% | 16 | 0.17% | 19 | 0.20% | 16 | 0.17% | 1,161 | 12.01% | 9,669 |
| Towner | 946 | 48.91% | 970 | 50.16% | 7 | 0.36% | 2 | 0.10% | 5 | 0.26% | 4 | 0.21% | -24 | -1.24% | 1,934 |
| Traill | 2,562 | 56.20% | 1,940 | 42.55% | 26 | 0.57% | 18 | 0.39% | 5 | 0.11% | 8 | 0.18% | 622 | 13.64% | 4,559 |
| Walsh | 3,250 | 54.48% | 2,646 | 44.35% | 42 | 0.70% | 14 | 0.23% | 9 | 0.15% | 5 | 0.08% | 604 | 10.12% | 5,966 |
| Ward | 13,179 | 56.74% | 9,906 | 42.65% | 71 | 0.31% | 46 | 0.20% | 11 | 0.05% | 15 | 0.06% | 3,273 | 14.09% | 23,228 |
| Wells | 1,901 | 58.65% | 1,317 | 40.64% | 8 | 0.25% | 9 | 0.28% | 2 | 0.06% | 4 | 0.12% | 584 | 18.02% | 3,241 |
| Williams | 5,653 | 57.87% | 4,004 | 40.99% | 49 | 0.50% | 35 | 0.36% | 14 | 0.14% | 13 | 0.13% | 1,649 | 16.88% | 9,768 |
| Totals | 166,559 | 56.03% | 127,739 | 42.97% | 1,315 | 0.44% | 905 | 0.30% | 396 | 0.13% | 347 | 0.12% | 38,820 | 13.06% | 297,261 |
See also[]
- Presidency of George H. W. Bush
References[]
- ^ "Since 1980s, the Kindest of Tax Cuts for the Rich". The New York Times. 2012-01-18. Retrieved 2013-07-21.
- ^ Jerry Lanson (2008-11-06). "A historic victory. A changed nation. Now, can Obama deliver?". Christian Science Monitor. Retrieved 2013-07-21.
- ^ "1988 Presidential General Election Results – North Dakota". Dave Leip's Atlas of U.S. Presidential Elections. Retrieved 2013-07-21.
- ^ Political Graveyard; Sargent County, North Dakota
- ^ Counting the Votes; North Dakota
- ^ http://www.ballot-access.org/1988/BAN.1988.06-15-88.pdf
- ^ https://www.minnpost.com/politics-policy/2009/01/st-pauls-colorful-and-longtime-political-candidate-maryjane-reagan-dies-87/
- ^ https://vip.sos.nd.gov/pdfs/Abstracts%20by%20Year/1980%20throguh%201989%20Statewide%20Election%20Results/1988/Primary%20Election%2006-14-1988.pdf
- ^ "ND US President Race, November 08, 1988". Our Campaigns.
| show State and district results of the 1988 U.S. presidential election |
|---|
- 1988 United States presidential election by state
- United States presidential elections in North Dakota
- 1988 North Dakota elections