Election in Illinois
Main article: 1992 United States presidential election
1992 United States presidential election in Illinois Turnout 76.51%
Nominee
Bill Clinton George H. W. Bush
Ross Perot
Party
Democratic
Republican
Independent
Home state
Arkansas
Texas
Texas
Running mate
Al Gore Dan Quayle
James Stockdale
Electoral vote
22
0
0
Popular vote
2,453,350
1,734,096
840,515
Percentage
48.58%
34.34%
16.64%
County Results
Clinton
30–40%
40–50%
50–60%
60–70%
Bush
30–40%
40–50%
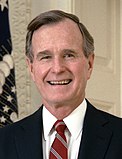
President before election George H. W. Bush Republican
Elected President Bill Clinton Democratic
The 1992 United States presidential election in Illinois took place on November 3, 1992, as part of the 1992 United States presidential election . Voters chose 22 representatives, or electors to the Electoral College , who voted for president and vice president .
Illinois was won by Governor Bill Clinton (D -Arkansas ) with 48.58% of the popular vote over incumbent President George H. W. Bush (R -Texas ) with 34.34%. Businessman Ross Perot (I -Texas) finished in third, with 16.64% of the popular vote.[1] 1988 , Dukakis also received 48.6% of the vote.
Clinton ultimately won the national vote, defeating incumbent President Bush.[2] Democrat to win Illinois on a presidential level since 1964 and notably won seven of 21 Illinois counties that had backed Barry Goldwater in that election.[3] Johnson County and Pope County [note 1] Yankee in culture but converted to Unionism by war[4] Stephen A. Douglas in 1860 .[5] Whiteside County which had voted in Presidential elections since 1840 ,[5] DeKalb County since Franklin Pierce in 1852 , and the first to win Bureau , McDonough and Warren Counties since Franklin D. Roosevelt in 1932 .[3]
This represented a realigning election for Illinois in regards to presidential politics. The first time that Illinois voted for the Democratic ticket in a presidential election since 1964, this ended a streak of six consecutive elections in which the state had voted for the Republican ticket. It also began a streak that, as of the 2020 election , continues, in which the state has voted by double digits for the Democratic ticket in eight consecutive presidential elections.
As of the 2020 presidential election , this is also the last election in which the following counties voted for a Democratic presidential candidate: Brown , Clark , Crawford , Cumberland , Douglas , Edgar , Jasper , Monroe , Richland , and Tazewell .[6]
Election information [ ] The primaries and general elections coincided with those for other federal elections (Senate and House ), as well as those for state offices .[7] [8]
Turnout [ ] For the state-run primaries (Democratic and Republican), turnout was 39.82%, with 2,335,270 votes cast.[7] [8]
Primaries [ ] State-run primaries were held for the Democratic, Republican, parties on March 17.[7]
Democratic [ ] 1992 Illinois Democratic presidential primary
Candidate
Bill Clinton Paul Tsongas Jerry Brown
Home state
Arkansas
Massachusetts
California
Popular vote
776,829
387,891
220,346
Percentage
51.65%
25.79%
14.65%
The 1992 Illinois Democratic presidential primary was held on March 17, 1992 in the U.S. state of Illinois as one of the Democratic Party's statewide nomination contests ahead of the 1992 presidential election.
Republican [ ] 1992 Illinois Republican presidential primary
Candidate
George H. W. Bush Pat Buchanan
Home state
Texas
Virginia
Popular vote
634,588
186,915
Percentage
76.35%
22.49%
The 1992 Illinois Republican presidential primary was held on March 17, 1992 in the U.S. state of Illinois as one of the Republican Party's statewide nomination contests ahead of the 1992 presidential election.
Incumbent president George H. W. Bush won the primary by a large margin.
General election [ ]
1992 United States presidential election in Illinois[1] [8]
Party
Candidate
Votes
Percentage
Electoral votes
Democratic Bill Clinton 2,453,350
48.58%
22
Republican
George H. W. Bush
1,734,096
34.34%
0
Independent
Ross Perot
840,515
16.64%
0
Libertarian
Andre Marrou
9,218
0.18%
0
New Alliance
Lenora Fulani
5,267
0.10%
0
America First
James "Bo" Gritz
3,577
0.07%
0
Natural Law
Dr. John Hagelin
2,751
0.05%
0
Socialist Workers Party
James Warren
1,361
0.03%
0
Write-ins
22
0.00%
0
Totals
5,050,157
100.0%
22
Results by county [ ]
County
William Jefferson Clinton
George Herbert Walker Bush
Henry Ross Perot
Various candidates
Margin
Total votes cast
#
%
#
%
#
%
#
%
#
%
Adams
11,748
37.20%
13,529
42.84%
6,157
19.50%
145
0.46%
-1,781
-5.64%
31,579
Alexander
2,566
58.83%
1,301
29.83%
474
10.87%
21
0.48%
1,265
29.00%
4,362
Bond
3,428
45.42%
2,715
35.97%
1,373
18.19%
32
0.42%
713
9.45%
7,548
Boone
5,114
37.53%
5,589
41.01%
2,880
21.13%
44
0.32%
-475
-3.49%
13,627
Brown
1,146
42.62%
1,029
38.27%
504
18.74%
10
0.37%
117
4.35%
2,689
Bureau
7,551
42.17%
6,836
38.18%
3,465
19.35%
55
0.31%
715
3.99%
17,907
Calhoun
1,519
54.19%
745
26.58%
532
18.98%
7
0.25%
774
27.61%
2,803
Carroll
2,854
37.17%
3,297
42.94%
1,502
19.56%
26
0.34%
-443
-5.77%
7,679
Cass
3,200
49.64%
2,162
33.53%
1,072
16.63%
13
0.20%
1,038
16.10%
6,447
Champaign
35,003
46.00%
27,096
35.61%
13,571
17.83%
422
0.55%
7,907
10.39%
76,092
Christian
9,042
51.40%
5,087
28.92%
3,401
19.33%
60
0.34%
3,955
22.48%
17,590
Clark
3,338
41.83%
3,175
39.79%
1,450
18.17%
16
0.20%
163
2.04%
7,979
Clay
2,962
44.53%
2,471
37.15%
1,193
17.93%
26
0.39%
491
7.38%
6,652
Clinton
6,686
42.26%
5,771
36.47%
3,315
20.95%
50
0.32%
915
5.78%
15,822
Coles
9,402
42.16%
8,098
36.31%
4,707
21.11%
93
0.42%
1,304
5.85%
22,300
Cook
1,249,533
58.21%
605,300
28.20%
281,999
13.14%
9,823
0.46%
644,233
30.01%
2,146,655
Crawford
3,964
40.99%
3,606
37.29%
2,062
21.32%
39
0.40%
358
3.70%
9,671
Cumberland
2,111
40.58%
1,860
35.76%
1,209
23.24%
22
0.42%
251
4.83%
5,202
DeKalb
13,744
40.15%
12,655
36.97%
7,680
22.44%
153
0.45%
1,089
3.18%
34,232
DeWitt
3,009
38.78%
3,164
40.78%
1,543
19.89%
43
0.55%
-155
-2.00%
7,759
Douglas
3,341
40.37%
3,309
39.98%
1,600
19.33%
26
0.31%
32
0.39%
8,276
DuPage
114,564
30.88%
178,271
48.05%
76,839
20.71%
1,313
0.35%
-63,707
-17.17%
370,987
Edgar
4,014
41.06%
3,790
38.77%
1,930
19.74%
42
0.43%
224
2.29%
9,776
Edwards
1,299
36.57%
1,601
45.07%
634
17.85%
18
0.51%
-302
-8.50%
3,552
Effingham
5,221
34.85%
6,329
42.25%
3,354
22.39%
77
0.51%
-1,108
-7.40%
14,981
Fayette
4,833
47.77%
3,508
34.67%
1,730
17.10%
47
0.46%
1,325
13.10%
10,118
Ford
2,175
33.56%
3,046
47.00%
1,222
18.86%
38
0.59%
-871
-13.44%
6,481
Franklin
12,744
59.33%
5,504
25.62%
3,180
14.80%
53
0.25%
7,240
33.70%
21,481
Fulton
9,725
54.94%
5,062
28.60%
2,874
16.24%
40
0.23%
4,663
26.34%
17,701
Gallatin
2,371
60.12%
990
25.10%
568
14.40%
15
0.38%
1,381
35.02%
3,944
Greene
3,164
44.99%
2,391
34.00%
1,461
20.78%
16
0.23%
773
10.99%
7,032
Grundy
6,122
37.64%
6,346
39.02%
3,724
22.90%
73
0.45%
-224
-1.38%
16,265
Hamilton
2,582
51.91%
1,521
30.58%
862
17.33%
9
0.18%
1,061
21.33%
4,974
Hancock
4,213
41.84%
3,714
36.89%
2,091
20.77%
51
0.51%
499
4.96%
10,069
Hardin
1,665
52.47%
985
31.04%
515
16.23%
8
0.25%
680
21.43%
3,173
Henderson
2,013
49.73%
1,310
32.36%
715
17.66%
10
0.25%
703
17.37%
4,048
Henry
11,077
45.45%
8,989
36.88%
4,231
17.36%
74
0.30%
2,088
8.57%
24,371
Iroquois
4,440
30.56%
6,948
47.82%
3,073
21.15%
69
0.47%
-2,508
-17.26%
14,530
Jackson
13,373
54.73%
6,899
28.24%
3,995
16.35%
167
0.68%
6,474
26.50%
24,434
Jasper
2,284
41.68%
1,996
36.42%
1,160
21.17%
40
0.73%
288
5.26%
5,480
Jefferson
8,665
49.24%
5,497
31.24%
3,403
19.34%
32
0.18%
3,168
18.00%
17,597
Jersey
4,749
47.05%
2,933
29.06%
2,363
23.41%
48
0.48%
1,816
17.99%
10,093
Jo Daviess
4,044
38.68%
4,249
40.64%
2,102
20.11%
59
0.56%
-205
-1.96%
10,454
Johnson
2,299
42.65%
2,124
39.40%
944
17.51%
24
0.45%
175
3.25%
5,391
Kane
44,568
34.84%
55,684
43.52%
27,179
21.24%
507
0.40%
-11,116
-8.69%
127,938
Kankakee
17,229
43.00%
15,411
38.46%
7,264
18.13%
167
0.42%
1,818
4.54%
40,071
Kendall
5,423
29.46%
8,521
46.29%
4,394
23.87%
68
0.37%
-3,098
-16.83%
18,406
Knox
12,524
49.51%
8,331
32.93%
4,357
17.22%
84
0.33%
4,193
16.58%
25,296
Lake
81,693
36.47%
99,000
44.20%
42,384
18.92%
910
0.41%
-17,307
-7.73%
223,987
LaSalle
23,276
46.62%
16,078
32.20%
10,434
20.90%
143
0.29%
7,198
14.42%
49,931
Lawrence
3,270
43.67%
2,681
35.80%
1,498
20.01%
39
0.52%
589
7.87%
7,488
Lee
5,530
35.87%
6,652
43.15%
3,191
20.70%
44
0.29%
-1,122
-7.28%
15,417
Livingston
6,007
35.13%
8,004
46.81%
3,029
17.72%
58
0.34%
-1,997
-11.68%
17,098
Logan
5,169
36.41%
6,567
46.26%
2,420
17.05%
39
0.27%
-1,398
-9.85%
14,195
Macon
27,449
49.39%
18,684
33.62%
9,236
16.62%
211
0.38%
8,765
15.77%
55,580
Macoupin
12,050
50.93%
6,518
27.55%
5,018
21.21%
75
0.32%
5,532
23.38%
23,661
Madison
58,484
51.26%
32,167
28.19%
23,110
20.26%
334
0.29%
26,317
23.07%
114,095
Marion
9,669
51.20%
5,764
30.52%
3,407
18.04%
43
0.23%
3,905
20.68%
18,883
Marshall
2,819
43.40%
2,491
38.35%
1,169
18.00%
17
0.26%
328
5.05%
6,496
Mason
3,969
51.53%
2,473
32.11%
1,245
16.16%
15
0.19%
1,496
19.42%
7,702
Massac
3,347
47.43%
2,754
39.03%
892
12.64%
63
0.89%
593
8.40%
7,056
McDonough
5,814
41.76%
5,297
38.05%
2,770
19.90%
41
0.29%
517
3.71%
13,922
McHenry
24,783
28.07%
41,356
46.84%
21,817
24.71%
338
0.38%
-16,573
-18.77%
88,294
McLean
23,090
38.95%
25,726
43.39%
10,282
17.34%
187
0.32%
-2,636
-4.45%
59,285
Menard
2,264
35.94%
2,834
44.99%
1,179
18.72%
22
0.35%
-570
-9.05%
6,299
Mercer
3,990
46.72%
2,983
34.93%
1,535
17.97%
32
0.37%
1,007
11.79%
8,540
Monroe
4,894
39.02%
4,807
38.33%
2,813
22.43%
28
0.22%
87
0.69%
12,542
Montgomery
7,424
50.04%
4,407
29.70%
2,956
19.92%
50
0.34%
3,017
20.33%
14,837
Morgan
6,351
38.97%
6,566
40.29%
3,317
20.35%
63
0.39%
-215
-1.32%
16,297
Moultrie
3,056
47.27%
2,065
31.94%
1,322
20.45%
22
0.34%
991
15.33%
6,465
Ogle
6,512
32.38%
9,008
44.80%
4,455
22.15%
134
0.67%
-2,496
-12.41%
20,109
Peoria
38,099
46.85%
30,718
37.77%
12,195
14.99%
316
0.39%
7,381
9.08%
81,328
Perry
6,009
54.20%
3,105
28.01%
1,955
17.63%
17
0.15%
2,904
26.20%
11,086
Piatt
3,520
41.67%
3,076
36.42%
1,822
21.57%
29
0.34%
444
5.26%
8,447
Pike
4,016
44.44%
3,342
36.98%
1,643
18.18%
36
0.40%
674
7.46%
9,037
Pope
1,063
44.09%
951
39.44%
391
16.22%
6
0.25%
112
4.65%
2,411
Pulaski
1,987
55.99%
1,169
32.94%
379
10.68%
14
0.39%
818
23.05%
3,549
Putnam
1,574
47.58%
969
29.29%
752
22.73%
13
0.39%
605
18.29%
3,308
Randolph
8,529
51.49%
4,899
29.57%
3,092
18.67%
45
0.27%
3,630
21.91%
16,565
Richland
3,286
40.76%
3,053
37.87%
1,689
20.95%
33
0.41%
233
2.89%
8,061
Rock Island
37,412
51.93%
23,212
32.22%
10,416
14.46%
999
1.39%
14,200
19.71%
72,039
Saline
7,258
54.76%
3,667
27.67%
2,302
17.37%
27
0.20%
3,591
27.09%
13,254
Sangamon
40,052
41.35%
39,641
40.93%
16,861
17.41%
306
0.32%
411
0.42%
96,860
Schuyler
1,650
41.30%
1,512
37.85%
815
20.40%
18
0.45%
138
3.45%
3,995
Scott
1,057
37.98%
1,132
40.68%
588
21.13%
6
0.22%
-75
-2.69%
2,783
Shelby
5,101
45.65%
3,631
32.49%
2,401
21.49%
42
0.38%
1,470
13.15%
11,175
St. Clair
57,625
53.58%
31,951
29.71%
17,592
16.36%
373
0.35%
25,674
23.87%
107,541
Stark
1,336
39.87%
1,384
41.30%
625
18.65%
6
0.18%
-48
-1.43%
3,351
Stephenson
7,899
36.47%
9,005
41.58%
4,677
21.60%
75
0.35%
-1,106
-5.11%
21,656
Tazewell
26,428
44.05%
23,469
39.12%
9,927
16.55%
170
0.28%
2,959
4.93%
59,994
Union
4,681
51.54%
3,003
33.06%
1,373
15.12%
26
0.29%
1,678
18.47%
9,083
Vermilion
18,383
47.80%
11,703
30.43%
8,162
21.22%
213
0.55%
6,680
17.37%
38,461
Wabash
2,436
39.04%
2,485
39.82%
1,302
20.87%
17
0.27%
-49
-0.79%
6,240
Warren
3,661
43.35%
3,325
39.37%
1,436
17.00%
24
0.28%
336
3.98%
8,446
Washington
2,986
39.52%
3,003
39.75%
1,542
20.41%
24
0.32%
-17
-0.23%
7,555
Wayne
3,332
37.56%
3,809
42.93%
1,702
19.18%
29
0.33%
-477
-5.38%
8,872
White
4,308
48.89%
3,057
34.70%
1,428
16.21%
18
0.20%
1,251
14.20%
8,811
Whiteside
12,329
45.41%
10,146
37.37%
4,589
16.90%
89
0.33%
2,183
8.04%
27,153
Will
59,633
39.20%
58,337
38.35%
32,788
21.55%
1,365
0.90%
1,296
0.85%
152,123
Williamson
14,361
49.93%
9,462
32.90%
4,779
16.62%
158
0.55%
4,899
17.03%
28,760
Winnebago
48,298
43.04%
42,221
37.63%
21,227
18.92%
469
0.42%
6,077
5.42%
112,215
Woodford
5,490
33.67%
8,032
49.26%
2,733
16.76%
50
0.31%
-2,542
-15.59%
16,305
Totals
2,453,350
48.58%
1,734,096
34.34%
840,515
16.64%
22,196
0.44%
719,254
14.24%
5,050,157
By congressional district [ ]
District
Clinton
Bush
Representative
1st 81%
12%
Bobby Rush
2nd 80%
13%
Mel Reynolds
3rd 41%
39%
William Lipinski
4th 65%
23%
Luis Gutierrez
5th 51%
33%
Dan Rostenkowski
6th 23%
47%
Henry Hyde
7th 78%
15%
Cardiss Collins
8th 31%
47%
Phil Crane
See also [ ] Notes [ ]
^ Clinton would win Pope County again in 1996 but lose Johnson County to Bob Dole .
References [ ]
State and district results of the 1992 U.S. presidential election
Alabama Alaska Arizona Arkansas California Colorado Connecticut Delaware District of Columbia Florida Georgia Hawaii Idaho Illinois Indiana Iowa Kansas Kentucky Louisiana Maine Maryland Massachusetts Michigan Minnesota Mississippi Missouri Montana Nebraska Nevada New Hampshire New Jersey New Mexico New York North Carolina North Dakota Ohio Oklahoma Oregon Pennsylvania Rhode Island South Carolina South Dakota Tennessee Texas Utah Vermont Virginia Washington West Virginia Wisconsin Wyoming