Illinois's 3rd congressional district
| Illinois's 3rd congressional district | |||
|---|---|---|---|
 Illinois's 3rd congressional district - since January 3, 2013. | |||
| Representative |
| ||
| Area | 125 sq mi (320 km2) | ||
| Distribution |
| ||
| Population (2019) | 702,503 | ||
| Median household income | $75,411[1] | ||
| Ethnicity |
| ||
| Cook PVI | D+6[2][3] | ||
Illinois's 3rd congressional district includes part of Cook County, and has been represented by Democrat Marie Newman since January 3, 2021. The district was previously represented by Dan Lipinski from 2005 to 2021, and by Lipinski's father Bill from 1983 to 2005.
The district includes west and southwest suburbs of Chicago as far as the DuPage County border, as well as portions of the Southwest Side of the city of Chicago itself, and covers 124.5 square miles (322 km2), making it one of the 50 smallest districts in the U.S., although there are five smaller districts in Illinois. It is adjacent to the 1st District to the east and south, the 4th District to the north, and the 11th District to the west, and also borders the 6th and 7th Districts at its northwest and northeast corners respectively. The district was created following the 1830 Census and came into being in 1833, five months before Chicago was organized as a town; it initially included northern and western Illinois[4] before representing areas of east central and northwestern Illinois from 1843 to 1873.[5][6][7] The district has included part of Chicago since 1873, and part of the city's southwest side since 1895; the district has been primarily suburban since 1973.
2011 redistricting[]
The district covers parts of Cook, Du Page and Will counties, as of the 2011 redistricting which followed the 2010 census. All or parts of Chicago, Bridgeview, Burbank, Crest Hill, Hickory Hills, Homer Glen, Justice, La Grange, Lemont, Lockport, Oak Lawn, Palos Heights, Palos Hills, Romeoville, Summit, Western Springs and Worth are included.[8] The representatives for these districts were elected in the 2012 primary and general elections, and the boundaries became effective on January 3, 2013.
Geography[]
The District includes the municipalities of Bedford Park, Bridgeview, Burbank, Chicago Ridge, Countryside, Forest View, Hickory Hills, Hodgkins, Hometown, Indian Head Park, Justice, La Grange, La Grange Park, Lyons, McCook, Merrionette Park, Oak Lawn, Palos Hills, Riverside, Stickney and Summit, nearly all of Berwyn, Brookfield, Western Springs and Willow Springs, and parts of Alsip, Burr Ridge, Cicero, Darien, Hillside, North Riverside, Orland Hills, Palos Heights, Palos Park, Westchester and Worth.
In the City of Chicago, it includes the communities of Bridgeport (home of mayor Richard M. Daley until he relocated in the late 1990s to the Near South Side's Central Station development), Clearing, Garfield Ridge, Mount Greenwood and West Lawn; almost all of Beverly; those portions of Archer Heights and West Elsdon west of Pulaski Road; the western portions of Ashburn, Chicago Lawn and Morgan Park; the portion of McKinley Park south of Archer Avenue; parts of Gage Park and New City; and a small section (1/16 mi2) of Armour Square.
Demographics[]
The District, situated between the Hispanic-majority 4th District to the north and the black-majority 1st and 7th Districts to the east, is the home of numerous sizable and historic ethnic groups including Irish, Polish, Arab, German, Italian and Czech immigrants and their descendants. At 14.2%, the Irish make up the largest white ethnic group in the district,[9][10] most prominently in the Bridgeport area (the ancestral neighborhood of the Daley family and other Chicago Irish politicians) and the Mount Greenwood-Beverly area; it is the largest Irish population in any district west of Philadelphia's suburbs.[11] The Polish form the next largest white ethnic group at 13.5%,[9] tying the northwest side's 5th District for the second highest percentage of any district, behind only New York's 27th congressional district.[11] The next largest white ethnic groups are Germans (11.0%) and Italians (6.9%).[9] Of the suburbs primarily south of 87th Street (in Palos and Worth Townships), 9 of 10 have larger Irish than Polish populations, usually by large margins; but north of 87th Street, in those areas in Lyons Township south of Interstate 55 or in the townships to the east of Harlem Avenue, 9 of 10 suburbs have greater Polish populations than Irish, again by large margins. In Oak Lawn, the district's largest suburb, Irish outnumber Polish 30%-19%; in neighboring Burbank, the district's third largest suburb, Polish outnumber Irish by an identical margin.[citation needed]
More recently a large Mexican community has moved to the district, notably in Berwyn, Cicero, Hodgkins and Summit where they represent over 30% of the population, and along Archer Avenue, a major Chicago artery that runs through the district's northern section.[10] There is also a sizable Greek community in Oak Lawn and Palos Hills. In the last two decades, there has been notable Arab settlement in the vicinity of Bridgeview, and by the 2000 Census, Arabs represented one of the five largest non-Hispanic ethnic groups in Bridgeview and three adjacent suburbs. Approximately 41% of the district's residents live in Chicago. Roughly 21% of the district's population are Hispanic, 68% are Caucasian, 6% are African American and 3% are Asian; redistricting following the 2000 Census and the continued influx of Hispanics tripled the minority population from a decade earlier, as the district in its previous configuration had a population that was 7% Hispanic, 2% African American and 1% Asian.[12] The more affluent areas of the district are generally located in its northwestern portion.
Economy[]
The district is a historic U.S. transportation and shipping hub; not only does it include Chicago Midway International Airport, but it is also traversed by the Chicago Sanitary and Ship Canal, the Calumet Sag Channel, and the Des Plaines River, earning national designations for the Chicago Portage National Historic Site in Forest View and the Illinois and Michigan Canal National Heritage Corridor. The path of historic Route 66 runs southwest through the district from its eastern end in Chicago. Interstate 55 intersects with both the Tri-State Tollway (Interstate 294) and the Dan Ryan Expressway (Interstate 90/94) in the district, and in 2001 – since which time the district has shifted slightly to the northwest – it was noted as likely having more freight yards and railroad crossings than any other district.[10]
The district includes SeatGeek Stadium, home of the Chicago Red Stars team in Women's Professional Soccer, as well as Hawthorne Race Course; the area also benefits from Chicago White Sox home games at U.S. Cellular Field, which is less than 1,000 feet (300 m) beyond the district's border. Portions of the Cook County Forest Preserves cover several square miles in the district's southwest corner. Cultural attractions include Brookfield Zoo and the Balzekas Museum of Lithuanian Culture in West Lawn; educational institutions include St. Xavier University in Mount Greenwood, Moraine Valley Community College in Palos Hills, Morton College in Cicero, and Richard J. Daley College, a Chicago city college, in West Lawn; and medical facilities include Advocate Christ Medical Center in Oak Lawn, in La Grange and MacNeal Hospital in Berwyn. A Ronald McDonald House adjacent to Advocate Christ opened in December 2008.[13][14] Industrial and business presences in the district include: Tootsie Roll Industries; Electro-Motive Diesel; a Nabisco bakery which is the largest biscuit bakery in the world;[15] the Chicago Area Consolidation Hub of United Parcel Service and adjacent BNSF Railway yard;[16] an ACH Food manufacturing plant (formerly part of Corn Products Company) in Summit;[17] an Owens Corning roofing and asphalt plant in Summit; and a Nalco Chemical plant in Bedford Park. The former site of the International Amphitheatre, now an Aramark plant, is within the district. Organizations based in the district include the American Nuclear Society in La Grange Park. Among the federal facilities in the district is the Great Lakes Regional Headquarters of the National Archives and Records Administration[18] in West Lawn.
Other district sites on the National Register of Historic Places include:
- American State Bank, Berwyn
- Berwyn Health Center
- Berwyn Municipal Building
- Avery Coonley House, Riverside
- Cornell Square, New City, Chicago
- Arthur J. Dunham House, Berwyn
- First Congregational Church of Western Springs
- Grossdale Station, Brookfield
- Haymarket Martyrs' Monument National Historic Landmark, Forest Park
- Hofmann Tower, Lyons
- La Grange Village Historic District
- Lyons Township Hall, La Grange
- , Oak Lawn
- Old Stone Gate of Chicago Union Stockyards National Historic Landmark, New City, Chicago
- George E. Purple House, La Grange
- Ridge Historic District, Beverly/Morgan Park, Chicago
- Riverside Landscape Architecture District, Riverside
- Robert Silhan House, Berwyn
- F.F. Tomek House, Riverside
- Western Springs Water Tower
Politics[]
The District has been described as "ancestrally Democratic, culturally conservative, multiethnic and viscerally patriotic."[19] It earned a reputation as being home to Reagan Democrats when in the 1980 presidential election it was one of only two Chicago districts (out of nine) to be won by Republican Ronald Reagan, along with the 6th District (an almost entirely suburban district which also included Chicago's O'Hare Airport); the district simultaneously reelected Democratic congressman Marty Russo with nearly 69% of the vote.[20] The Reagan Democrat description became even more appropriate when Reagan received 65% of the vote here in 1984, as Russo again won with 64%.[21] Redistricting for the 1990s shifted the district into more reliably Democratic territory, but Bill Clinton won the district in 1992 by just a 41%-39% margin despite receiving at least 65% of the vote in four other south side districts; he won the district with 53% in 1996 although his totals in the other south side districts were all between 80 and 85%. George W. Bush received 41% of the vote here in both 2000 and 2004 despite not exceeding 21% in any of the other four south side districts; it was his best performance in any district located primarily within Cook County. Much of the district's current suburban territory was in the 4th District from the 1950s to the 1970s, when that was a solidly Republican suburban district represented by Ed Derwinski; more recently, Lyons, Palos and Riverside Townships, which together approximately correspond with the district's western half, all voted for Bush in 2000.[22] Over the last eight presidential elections, the Democratic nominee for Congress has run an average of 20 points ahead of the party's nominee for president in the district.[23]
Redistricting which took effect for the 1992 elections kept only 40% of the district's previous area, and pitted nine-term incumbent Russo – who changed his residence rather than run in the 2nd District, which now included his previous home – against five-term incumbent Bill Lipinski, who had previously represented the neighboring 5th District, in the Democratic primary. Lipinski ran close to Russo in the suburbs but easily won the Chicago areas, and won the primary 58%-37%.[24] Lipinski was decidedly the most conservative Democrat in the Illinois delegation,[19] opposing abortion and gays in the military, supporting school prayer, tuition vouchers, the Defense of Marriage Act and the death penalty, and helping to write a proposed constitutional amendment in 1997 prohibiting flag desecration.[25][26] A member of the Blue Dog Democrats,[26] he was one of just 30 Democrats to vote for the Republican welfare reform plan.[10] He clashed often with the Clinton administration, opposing the president's position over half the time in the 1997-98 Congress.[27] He was one of 31 Democrats to vote in favor of a Judiciary Committee inquiry during the leadup to Clinton's impeachment; he eventually voted against impeachment, but simultaneously called on Clinton to resign.[28] In 1999, Lipinski stated that Clinton "doesn't have credibility on military issues," adding that "the American people feel Clinton is unsure."[26] He was a consistent opponent of U.S. free trade agreements, arguing that they were disastrous for American manufacturing.[10][26] Lipinski received higher approval ratings from the American Conservative Union than from the ACLU in 12 of his last 13 years in office, though his highest ratings generally came from labor and consumer groups[25][27] and the Christian Coalition.[29] He received a 0 rating from the ACLU for the 1997–98 term,[27] and also compiled an overall 0 rating from the National Abortion Rights Action League.[29] His policies enabled him to work easily with Republicans; he was a candidate to become Transportation Secretary in the Bush administration, and collaborated with House Speaker Dennis Hastert of the 14th District to design the state's redistricting plan following the 2000 Census.[28] and after surviving with a 54%-46% win amid the Republican gains of 1994 he was reelected by increasing margins in each succeeding election; in 2002 he became the first unopposed candidate in the history of the District.[30]
In the 2018 Republican primary, the only option was Arthur Jones, a self-proclaimed member of the Nazi party and holocaust denier. Although Jones received over 20,000 votes in the primary, many district GOP organizations took the unprecedented step of endorsing Rep. Dan Lipinski in the general election.[citation needed]
Recent electoral history[]
Congress[]
2004 election[]

The district's seat changed hands under somewhat controversial circumstances in 2004. Lipinski was renominated in the primary election, but in August announced his intention to withdraw from the race, just two weeks before the deadline for replacing a candidate on the ballot. Four days later, the district's ward and township committeemen – including Lipinski himself as well as Mayor Daley's brother John and Illinois House Speaker Michael Madigan – met to choose a replacement; Lipinski nominated his son Dan, an assistant professor at the University of Tennessee, and he was approved without opposition despite not having lived in Illinois since 1989. In his initial campaign, the younger Lipinski stated that his policies made him "not really that different from" his father, and indicated that he would oppose same-sex marriage as well as abortion except when the mother's life was at stake. True to the district's heritage, he identified Reagan as his political hero.[31]
2012 election[]
| Party | Candidate | Votes | % | |
|---|---|---|---|---|
| Democratic | Dan Lipinski (incumbent) | 44,532 | 87.33 | |
| Democratic | Farah Baqai | 6,463 | 12.67 | |
| Total votes | 50,995 | 100.00 | ||
| Party | Candidate | Votes | % | |
|---|---|---|---|---|
| Republican | 20,895 | 59.35 | ||
| Republican | Jim Falvey | 10,449 | 29.68 | |
| Republican | Arthur Jones | 3,861 | 10.97 | |
| Total votes | 35,205 | 100.00 | ||
| Party | Candidate | Votes | % | |
|---|---|---|---|---|
| Democratic | Dan Lipinski (incumbent) | 168,738 | 68.48 | |
| Republican | 77,653 | 31.52 | ||
| Independent (Write-in) | Laura Anderson | 7 | 0.002 | |
| Total votes | 246,398 | 100.00 | ||
| Democratic hold | ||||
2018 election[]
| Party | Candidate | Votes | % | |
|---|---|---|---|---|
| Democratic | Dan Lipinski (incumbent) | 48,675 | 51.13 | |
| Democratic | Marie Newman | 46,530 | 48.87 | |
| Total votes | 95,205 | 100.00 | ||
| Party | Candidate | Votes | % | |
|---|---|---|---|---|
| Democratic | Dan Lipinski (incumbent) | 163,053 | 73.01 | |
| Republican | Arthur J. Jones | 57,885 | 25.92 | |
| Independent (Write-in) | Justin Hanson | 1,353 | 0.61 | |
| Independent (Write-in) | Kenneth Yerkes | 1,039 | 0.47 | |
| Independent (Write-in) | Richard Meyers | 4 | 0.002 | |
| Total votes | 223,334 | 100.00 | ||
| Democratic hold | ||||
2020 election[]
Marie Newman won the 2020 Democratic primary against incumbent Dan Lipinski by 48.2% to 45.8%.[36]
| Party | Candidate | Votes | % | ±% | |
|---|---|---|---|---|---|
| Democratic | Marie Newman | 172,997 | 56.4 | -17.6 | |
| Republican | Mike Fricilone | 133,851 | 43.6 | +18.7 | |
| Democratic hold | Swing | +17.7 | |||
Presidential elections[]
How the district has voted in U.S. presidential elections.
Election results reflect voting in the district as it was configured at the time of the election, not as it is configured today.
| Election | District | Illinois winner | National winner | ||||||||||||||||||||||||||||||||||||||||||||||||||||||||||||||||||||||||||||||||||||||||||||
|---|---|---|---|---|---|---|---|---|---|---|---|---|---|---|---|---|---|---|---|---|---|---|---|---|---|---|---|---|---|---|---|---|---|---|---|---|---|---|---|---|---|---|---|---|---|---|---|---|---|---|---|---|---|---|---|---|---|---|---|---|---|---|---|---|---|---|---|---|---|---|---|---|---|---|---|---|---|---|---|---|---|---|---|---|---|---|---|---|---|---|---|---|---|---|---|
| Winner | Runner-up | Other candidates | |||||||||||||||||||||||||||||||||||||||||||||||||||||||||||||||||||||||||||||||||||||||||||||
| 1852[38] | Pierce (D) 8,446 (46%) | Scott (W) 7,889 (43%) | Hale (FS) 2,028 (11%) | Pierce (D) | Pierce (D) | ||||||||||||||||||||||||||||||||||||||||||||||||||||||||||||||||||||||||||||||||||||||||||
| 1856[38] | Frémont (R) 19,313 (58%) | Buchanan (D) 11,788 (36%) | Fillmore (KN) 1,921 (6%) | Buchanan (D) | Buchanan (D) | ||||||||||||||||||||||||||||||||||||||||||||||||||||||||||||||||||||||||||||||||||||||||||
| 1860[38] | Lincoln (R) 30,121 (60%) | Douglas (D) 19,241 (38%) | Breckinridge (D) 395 (1%) Bell (CU) 236 (0.5%) |
Lincoln (R) | Lincoln (R) | ||||||||||||||||||||||||||||||||||||||||||||||||||||||||||||||||||||||||||||||||||||||||||
| 1864[38] | Lincoln (R) 15,724 (68%) | McClellan (D) 7,441 (32%) | Lincoln (R) | Lincoln (R) | |||||||||||||||||||||||||||||||||||||||||||||||||||||||||||||||||||||||||||||||||||||||||||
| 1868[38] | Grant (R) | Seymour (D) | Grant (R) | Grant (R) | |||||||||||||||||||||||||||||||||||||||||||||||||||||||||||||||||||||||||||||||||||||||||||
| [data unknown/missing] | |||||||||||||||||||||||||||||||||||||||||||||||||||||||||||||||||||||||||||||||||||||||||||||||
| 1952[39] | Eisenhower (R) 105,513 (55%) | Stevenson (D) 86,220 (45%) | Eisenhower (R) | Eisenhower (R) | |||||||||||||||||||||||||||||||||||||||||||||||||||||||||||||||||||||||||||||||||||||||||||
| 1956[39] | Eisenhower (R) 114,807 (61%) | Stevenson (D) 72,862 (39%) | Eisenhower (R) | Eisenhower (R) | |||||||||||||||||||||||||||||||||||||||||||||||||||||||||||||||||||||||||||||||||||||||||||
| 1968[40] | Humphrey (D) 111,357 (56%) | Nixon (R) 69,344 (35%) | Wallace (AIP) 16,665 (8%) | Nixon (R) | Nixon (R) | ||||||||||||||||||||||||||||||||||||||||||||||||||||||||||||||||||||||||||||||||||||||||||
| 1972[41] | Nixon (R) 155,092 (70%) | McGovern (D) 65,226 (30%) | Nixon (R) | Nixon (R) | |||||||||||||||||||||||||||||||||||||||||||||||||||||||||||||||||||||||||||||||||||||||||||
| 1976[42] | Ford (R) 121,448 (58%) | Carter (D) 88,240 (42%) | Ford (R) | Carter (D) | |||||||||||||||||||||||||||||||||||||||||||||||||||||||||||||||||||||||||||||||||||||||||||
| 1980[43] | Reagan (R) 109,179 (52%) | Carter (D) 87,091 (41%) | Anderson (I) 12,594 (6%) | Reagan (R) | Reagan (R) | ||||||||||||||||||||||||||||||||||||||||||||||||||||||||||||||||||||||||||||||||||||||||||
| 1984[44] | Reagan (R) 158,281 (65%) | Mondale (D) 84,752 (35%) | Reagan (R) | Reagan (R) | |||||||||||||||||||||||||||||||||||||||||||||||||||||||||||||||||||||||||||||||||||||||||||
| 1988[45] | G.H.W. Bush (R) 130,606 (58%) | Dukakis (D) 92,108 (41%) | G.H.W. Bush (R) | G.H.W. Bush (R) | |||||||||||||||||||||||||||||||||||||||||||||||||||||||||||||||||||||||||||||||||||||||||||
| 1992[46] | B. Clinton (D) 108,342 (41%) | G.H.W. Bush (R) 102,632 (39%) | Perot (Indep.) 52,905 (20%) | B. Clinton (D) | B. Clinton (D) | ||||||||||||||||||||||||||||||||||||||||||||||||||||||||||||||||||||||||||||||||||||||||||
| 1996[12] | B. Clinton (D) 114,089 (53%) | Dole (R) 78,853 (37%) | Perot (Reform) 19,441 (9%) | B. Clinton (D) | B. Clinton (D) | ||||||||||||||||||||||||||||||||||||||||||||||||||||||||||||||||||||||||||||||||||||||||||
| 2000[28] | Gore (D) 118,342 (55%) | G.W. Bush (R) 88,458 (41%) | Nader (G) 5,537 (3%) | Gore (D) | G.W. Bush (R) | ||||||||||||||||||||||||||||||||||||||||||||||||||||||||||||||||||||||||||||||||||||||||||
| 2004[47] | Kerry (D) 144,657 (59%) | G.W. Bush (R) 100,257 (41%) | Kerry (D) | G.W. Bush (R) | |||||||||||||||||||||||||||||||||||||||||||||||||||||||||||||||||||||||||||||||||||||||||||
| 2008[citation needed] | Obama (D) 154,999 (64%) | McCain (R) 85,502 (35%) | Obama (D) | Obama (D) | |||||||||||||||||||||||||||||||||||||||||||||||||||||||||||||||||||||||||||||||||||||||||||
| 2012[48] | Obama (D) 143,694 (56%) | Romney (R) 109,339 (43%) | Obama (D) | Obama (D) | |||||||||||||||||||||||||||||||||||||||||||||||||||||||||||||||||||||||||||||||||||||||||||
| 2016[48] | H. Clinton (D) 157,383 (55%) | Trump (R) 113,779 (40%) | H. Clinton (D) | Trump (R) | |||||||||||||||||||||||||||||||||||||||||||||||||||||||||||||||||||||||||||||||||||||||||||
| 2020[48] | Biden (D) 175,983 (56%) | Trump (R) 135,826 (43%) | Biden (D) | Biden (D) | |||||||||||||||||||||||||||||||||||||||||||||||||||||||||||||||||||||||||||||||||||||||||||
List of members representing the district[]
| Member | Party | Years | Cong ress |
Electoral history | District location |
|---|---|---|---|---|---|
| District created March 4, 1833 | |||||
 Joseph Duncan |
Jacksonian | March 4, 1833 – September 21, 1834 |
23rd | Redistricted from the at-large district and re-elected in 1832. Re-elected in 1834. Resigned to become Governor of Illinois |
1833–1843 Bulk of northern and western Illinois: Adams, Calhoun, Cook, Fulton, Greene, Hancock, Henry, Jo Daviess, Knox, LaSalle, Macon, McDonough, McLean, Mercer, Morgan, Peoria, Pike, Putnam, Sangamon, Schuyler, Tazewell and Warren counties (numerous additional counties were later created within this area).[4] During this period, Abraham Lincoln was a district resident, beginning his political career as a state legislator; the district's representative from 1839 to 1843 was Lincoln's law partner, John T. Stuart. |
| Vacant | September 21, 1834 – December 1, 1834 | ||||
| William L. May | Jacksonian | December 1, 1834 – March 3, 1837 |
23rd 24th 25th |
. Re-elected in 1836. Retired. | |
| Democratic | March 4, 1837 – March 3, 1839 | ||||
 John T. Stuart |
Whig | March 4, 1839 – March 3, 1843 |
26th 27th |
Elected in 1838. Re-elected in 1840. Retired. | |
 Orlando B. Ficklin |
Democratic | March 4, 1843 – March 3, 1849 |
28th 29th 30th |
Elected in 1842. Re-elected in 1844. Re-elected in 1846. [data unknown/missing] |
1843–1853 Shifted to the east central part of the state, taking in Christian, Clark, Clay, Coles, Crawford, Cumberland, DeWitt, Edgar, Effingham, Fayette, Jasper, Lawrence, Macon, Moultrie, Piatt, Richland and Shelby counties.[5] |
| Timothy R. Young | Democratic | March 4, 1849 – March 3, 1851 |
31st | Elected in 1848. [data unknown/missing] | |
 Orlando B. Ficklin |
Democratic | March 4, 1851 – March 3, 1853 |
32nd | Elected in 1850. [data unknown/missing] | |
 Jesse O. Norton |
Whig | March 4, 1853 – March 3, 1855 |
33rd 34th |
Elected in 1852. Re-elected in 1854. Retired. |
1853–1863 Shifted north to cover the twelve counties to the south and southwest of Cook County: Bureau, Champaign, DeWitt, Grundy, Iroquois, Kendall, LaSalle, Livingston, McLean, Putnam, Vermilion and Will counties.[6] |
| Opposition | March 4, 1855 – March 3, 1857 | ||||
 Owen Lovejoy |
Republican | March 4, 1857 – March 3, 1863 |
35th 36th 37th |
Elected in 1856. Re-elected in 1858. Re-elected in 1860. Redistricted to the 5th district. | |
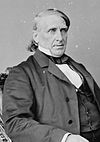 Elihu B. Washburne |
Republican | March 4, 1863 – March 6, 1869 |
38th 39th 40th 41st |
Redistricted from the 1st district and re-elected in 1862. Re-elected in 1864. Re-elected in 1866. Re-elected in 1868. Resigned to become U.S. Secretary of State. |
1863–1873 Relocated to include the six counties in the northwestern corner of the state: Carroll, Jo Daviess, Lee, Ogle, Stephenson and Whiteside counties.[7] |
| Vacant | March 6, 1869 – December 6, 1869 |
41st | |||
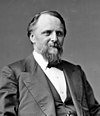 Horatio C. Burchard |
Republican | December 6, 1869 – March 3, 1873 |
41st 42nd |
Elected to finish Washburne's term. Re-elected in 1870. Redistricted to the 5th district. | |
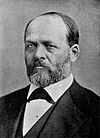 Charles B. Farwell |
Republican | March 4, 1873 – May 6, 1876 |
43rd 44th |
Redistricted from the 1st district and re-elected in 1872. Lost election contest. |
1873–1883 Relocated to include Lake County, the sixteen townships comprising the northern half of Cook County (Barrington, Cicero, Elk Grove, Evanston, Hanover, Jefferson, Lake View, Leyden, Maine, New Trier, Niles, Northfield, Palatine, Proviso, Schaumburg, Wheeling), and the north side of Chicago (the city's northern boundary east of the river was then Fullerton Avenue).[49] During this period, the Near North Side was recovering from the devastation of the Great Chicago Fire of October 1871. |
 John V. Le Moyne |
Democratic | May 6, 1876 – March 3, 1877 |
44th | Won election contest. Lost re-election. | |
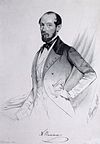 Lorenzo Brentano |
Republican | March 4, 1877 – March 3, 1879 |
45th | Elected in 1876. Lost renomination. | |
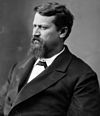 Hiram Barber Jr. |
Republican | March 4, 1879 – March 3, 1881 |
46th | Elected in 1878. Lost renomination. | |
 Charles B. Farwell |
Republican | March 4, 1881 – March 3, 1883 |
47th | Elected in 1880. Retired. | |
 George R. Davis |
Republican | March 4, 1883 – March 3, 1885 |
48th | Redistricted from the 2nd district and re-elected in 1882. Retired. |
1883–1893 Parts of the west side between 12th Street (now Roosevelt Road) and the North Branch of the Chicago River, excluding a small area north of 12th Street near the river; as the city was still expanding westward, the western boundary was Western Avenue from the river to North Avenue, and Crawford Avenue (now Pulaski Road) from North to 12th.[50] Illinois gained two additional representatives following the 1890 Census, but they were elected on an at-large basis for the 1893–1895 term before redistricting occurred, and the previous decade's districting remained in effect.[51] |
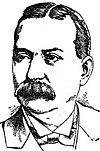 James H. Ward |
Democratic | March 4, 1885 – March 3, 1887 |
49th | Elected in 1884. Retired. | |
 William E. Mason |
Republican | March 4, 1887 – March 3, 1891 |
50th 51st |
Elected in 1886. Re-elected in 1888. Lost re-election. | |
 Allan C. Durborow Jr. |
Democratic | March 4, 1891 – March 3, 1895 |
52nd 53rd |
Elected in 1890. Re-elected in 1892. Retired. | |
| 1893–1903 From the river south to 26th Street; West of the river and south of 12th Street bordered on the west by Johnson Street (now Peoria Street) from 12th to 22nd Street (now Cermak Road) and by Halsted Street from 22nd to the river; and South of the Illinois and Michigan Canal and the river as far south as 39th Street (now Pershing Road) between Western and Wentworth Avenues.[52] In the 1896 House election, Clarence Darrow lost by 590 votes (2.5%).[53] | |||||
 Lawrence E. McGann |
Democratic | March 4, 1895 – December 27, 1895 |
54th | Elected in 1894. Lost election contest. | |
 Hugh R. Belknap |
Republican | December 27, 1895 – March 3, 1899 |
54th 55th |
Won election contest. Elected in 1896. Lost re-election. | |
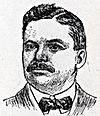 George P. Foster |
Democratic | March 4, 1899 – March 3, 1903 |
56th 57th |
Elected in 1898. Re-elected in 1900. Redistricted to the 4th district. | |
 William W. Wilson |
Republican | March 4, 1903 – March 3, 1913 |
58th 59th 60th 61st 62nd |
Elected in 1902. Re-elected in 1904. Re-elected in 1906. Re-elected in 1908. Re-elected in 1910. Lost re-election. |
1903–1933 Began to take on its modern territory, and included the nine southernmost townships of Cook County (Bloom, Bremen, Calumet, Lemont, Orland, Palos, Rich, Thornton and Worth), as well as that part of Chicago west of State Street between 51st Street and 111th Street excepting one and a quarter square miles in the southeast corner. (Note: In 1903 the city's western limit at 111th Street was Western Avenue, and at 115th Street was Ashland Avenue; but during this period, various portions of Calumet and Worth townships were annexed by Chicago.)[54] Illinois' districts were not redrawn until 1947, taking effect for the 1948 elections.[55] |
 George E. Gorman |
Democratic | March 4, 1913 – March 3, 1915 |
63rd | Elected in 1912. Retired. | |
 William W. Wilson |
Republican | March 4, 1915 – March 3, 1921 |
64th 65th 66th |
Elected in 1914. Re-elected in 1916. Re-elected in 1918. Retired. | |
 Elliott W. Sproul |
Republican | March 4, 1921 – March 3, 1931 |
67th 68th 69th 70th 71st |
Elected in 1920. Re-elected in 1922. Re-elected in 1924. Re-elected in 1926. Re-elected in 1928. Lost re-election. | |
 Edward A. Kelly |
Democratic | March 4, 1931 – January 3, 1943 |
72nd 73rd 74th 75th 76th 77th |
Elected in 1930. Re-elected in 1932. Re-elected in 1934. Re-elected in 1936. Re-elected in 1938. Re-elected in 1940. Lost re-election. | |
| 1933–1943 [data unknown/missing] | |||||
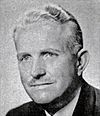 Fred E. Busbey |
Republican | January 3, 1943 – January 3, 1945 |
78th | Elected in 1942. Lost re-election. |
1943–1953 Included that part of Chicago bounded on the north by 65th Street (Cicero Avenue to Western Avenue), Marquette Road (Western to Damen), 59th Street (Damen to Wallace) and Garfield Boulevard (Wallace to the railroad between Wentworth and State Street), and bounded on the east by the railroad (Garfield to 59th), State Street (59th to 73rd Street), Indiana Avenue (73rd to 83rd Street), South Park Boulevard (later renamed King Drive, 83rd to 99th Street), Stewart Avenue (99th to 103rd Street) and Halsted (103rd to 123rd Street).[56] The same boundaries were maintained in the redistricting after 1950.[57] |
 Edward A. Kelly |
Democratic | January 3, 1945 – January 3, 1947 |
79th | Elected in 1944. Lost re-election. | |
 Fred E. Busbey |
Republican | January 3, 1947 – January 3, 1949 |
80th | Elected in 1946. Lost re-election. | |
 Neil J. Linehan |
Democratic | January 3, 1949 – January 3, 1951 |
81st | Elected in 1948. Lost re-election. | |
 Fred E. Busbey |
Republican | January 3, 1951 – January 3, 1955 |
82nd 83rd |
Elected in 1950. Re-elected in 1952. Lost re-election. | |
| 1953–1963 [data unknown/missing] | |||||
 James C. Murray |
Democratic | January 3, 1955 – January 3, 1957 |
84th | Elected in 1954. Lost re-election. | |
 Emmet F. Byrne |
Republican | January 3, 1957 – January 3, 1959 |
85th | Elected in 1956. Lost re-election. | |
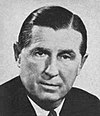 William T. Murphy |
Democratic | January 3, 1959 – January 3, 1971 |
86th 87th 88th 89th 90th 91st |
Elected in 1958. Re-elected in 1960. Re-elected in 1962. Re-elected in 1964. Re-elected in 1966. Re-elected in 1968. Retired. | |
| 1963–1973 Included the village of Evergreen Park as well as that part of Chicago bounded on the north by 66th Street (Cicero to the railroad 1/2 mile east of Kedzie), Marquette (the railroad to Damen), 59th Street (Damen to Racine) and Garfield (Racine to the railroad 1/4 mile east of Halsted), and bounded on the east by the railroad (Garfield to 59th), Halsted (59th to 63rd Street), State Street (63rd to 83rd Street), Stewart (83rd to 99th Street), State Street (99th to 111th Street), Wentworth Avenue (111th to 113th Street) and Halsted (113th to 123rd Street).[58] There was additional redistricting in Illinois which took effect for the 1967–1969 term, but the 3rd District was not altered.[59] | |||||
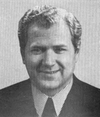 Morgan F. Murphy |
Democratic | January 3, 1971 – January 3, 1973 |
92nd | Elected in 1970. Redistricted to the 2nd district. | |
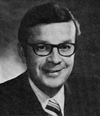 Robert P. Hanrahan |
Republican | January 3, 1973 – January 3, 1975 |
93rd | Elected in 1972. Lost re-election. |
1973–1983 Shifted primarily into suburban areas to include Thornton and Calumet Townships, most of Worth Township (excepting the municipalities of Bridgeview, Chicago Ridge, Crestwood, Palos Heights and Worth), the Chicago communities of Ashburn and Mount Greenwood, those parts of West Lawn and Chicago Lawn south of 63rd Street, and those parts of Beverly and Morgan Park west of Western Avenue.[60] |
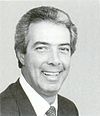 Marty Russo |
Democratic | January 3, 1975 – January 3, 1993 |
94th 95th 96th 97th 98th 99th 100th 101st 102nd |
Elected in 1974. Re-elected in 1976. Re-elected in 1978. Re-elected in 1980. Re-elected in 1982. Re-elected in 1984. Re-elected in 1986. Re-elected in 1988. Re-elected in 1990. Lost renomination. | |
| 1983–1993 Parts of the district shifted to the west, taking in part of the 4th district. The district now included: Bremen Township; Worth Township excepting that part between 111th Street and 135th Street west of Cicero Avenue as well as approximately 1/4 mi2 of Worth north of 111th; that part of Calumet Township in Blue Island and Calumet Park northwest of the railroad running from 123rd and Laflin to the western township line; that part of Thornton Township west of the Calumet Expressway having as its northern boundary 167th Street (from the Bremen Township line to the eastern edge of Hazel Crest), 171st/172nd Street (Hazel Crest to Halsted Street), 167th (Halsted to State Street, which becomes Indiana Avenue) and the Little Calumet River (Indiana Avenue to the Calumet Expressway); the part of Stickney Township south of 65th Street; the Chicago communities of Clearing, West Lawn, Ashburn, Mount Greenwood and Beverly, the western part of Morgan Park, and the additional part of Chicago between 55th Street, 75th Street, Cicero Avenue and the railroad 1/4 mile east of Western excepting that portion from the railroad to Western between 63rd Street and 69th Street.[61] | |||||
 Bill Lipinski |
Democratic | January 3, 1993 – January 3, 2005 |
103rd 104th 105th 106th 107th 108th |
Redistricted from the 5th district and re-elected in 1992. Re-elected in 1994. Re-elected in 1996. Re-elected in 1998. Re-elected in 2000. Re-elected in 2002. Retired. |
1993–2003 Shifted significantly to the northwest, and now included: all of Lyons Township; all of Stickney Township except the portion north of Pershing Road; all of Berwyn and Riverside; approximately the eastern half of Brookfield and the western half of Cicero; those portions of Forest Park and North Riverside east of the Des Plaines River and south of Harrison Street; most of Oak Park south of the Eisenhower Expressway; those parts of Worth Township having as their eastern boundary Pulaski Road from 87th Street to 101st Street, and Cicero Avenue from 101st Street to 135th Street, with minor variations in Oak Lawn; those parts of Palos Township having as their western boundary Roberts Road (80th Avenue) from 87th Street to 120th Street and then southwest along the railroad to 135th Street, plus approximately 1/8 m2 west of Roberts Road in the vicinity of Stagg High School; those parts of Bremen Township having as their eastern boundary Cicero Avenue from 135th Street to 143rd Street, the railroad and then Pulaski from 143rd Street to 159th Street, Cicero from 159th Street to 167th Street, Interstate 57 from 167th Street to 177th Street, and Central Avenue from 177th Street to 183rd Street; the Chicago communities of Garfield Ridge, Clearing, Archer Heights, West Elsdon and West Lawn, those parts of Gage Park, Chicago Lawn and Ashburn west of Kedzie Avenue, approximately those parts of Brighton Park northwest of 38th Street and St. Louis Avenue or southwest of 43rd Street and Kedzie, and nearly 1/8 m2 in the southwest corner of Austin.[62] |
2003–2013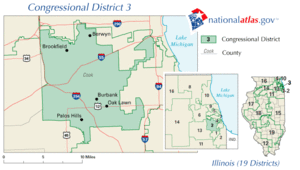
| |||||
 Dan Lipinski |
Democratic | January 3, 2005 – January 3, 2021 |
109th 110th 111th 112th 113th 114th 115th 116th |
Elected in 2004. Re-elected in 2006. Re-elected in 2008. Re-elected in 2010. Re-elected in 2012. Re-elected in 2014. Re-elected in 2016. Re-elected in 2018. Lost renomination. | |
2013–present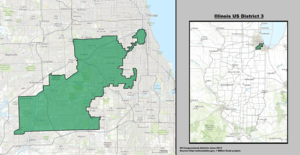 For a more detailed map, see the Census Bureau map linked below. | |||||
 Marie Newman |
Democratic | January 3, 2021 – Present |
117th | Elected in 2020. | |
See also[]
References[]
- ^ "My Congressional District".
- ^ "Partisan Voting Index – Districts of the 115th Congress" (PDF). The Cook Political Report. April 7, 2017. Retrieved April 7, 2017.
- ^ Barone, Michael; McCutcheon, Chuck (2013). The Almanac of American Politics 2014. Chicago: University of Chicago Press. p. 558. ISBN 978-0-226-10544-4. Copyright National Journal.
- ^ Jump up to: a b Parsons, Stanley B.; William W. Beach; Dan Hermann (1978). United States Congressional Districts 1788-1841. Westport, CT: Greenwood Press. pp. 302–304. ISBN 0-8371-9828-3.
- ^ Jump up to: a b Parsons, Stanley B.; William W. Beach; Michael J. Dubin (1986). United States Congressional Districts and Data, 1843-1883. Westport, CT: Greenwood Press. pp. 7–8. ISBN 0-313-22045-X.
- ^ Jump up to: a b Parsons, et al. (1986), pp. 53-54.
- ^ Jump up to: a b Parsons, et al. (1986), pp. 102-103.
- ^ Illinois Congressional District 3, Illinois Board of Elections
- ^ Jump up to: a b c Tarr, David R. (ed.) (2003). Congressional Districts in the 2000s: A Portrait of America. Washington, D.C.: CQ Press. p. 301. ISBN 1-56802-849-0.CS1 maint: extra text: authors list (link)
- ^ Jump up to: a b c d e Barone, Michael; Richard E. Cohen; Charles E. Cook Jr (2001). The Almanac of American Politics 2002. Washington, D.C.: National Journal Group. pp. 511–513. ISBN 0-89234-099-1.
- ^ Jump up to: a b Based on district ethnic demographics in Congressional Districts in the 2000s: A Portrait of America.
- ^ Jump up to: a b Barone, Michael; Grant Ujifusa; Richard E. Cohen (1997). The Almanac of American Politics 1998. Washington, D.C.: National Journal Group. p. 480. ISBN 0-89234-081-9.
- ^ "Ronald McDonald House near Hope Children's Hospital". Ronald McDonald House Charities of Chicagoland and Northwest Indiana. Archived from the original on April 10, 2008. Retrieved May 24, 2008.
- ^ [1][dead link]
- ^ [2][dead link]
- ^ TRAINS Magazine - Inside Willow Springs
- ^ ACH Food Companies, Inc
- ^ [3] Archived March 3, 2007, at the Wayback Machine
- ^ Jump up to: a b Barone, Michael; Richard E. Cohen (2005). The Almanac of American Politics 2006. Washington, D.C.: National Journal Group. p. 567. ISBN 0-89234-111-4.
- ^ Guide to U.S. Elections (5th ed.). Washington, D.C.: CQ Press. 2005. p. 1217. ISBN 1-56802-981-0.
- ^ Guide to U.S. Elections, p. 1227.
- ^ Congressional Districts in the 2000s: A Portrait of America, p. 300.
- ^ Based on results from 1976 through 2004 in the Guide to U.S. Elections.
- ^ Barone, Michael; Grant Ujifusa (1993). The Almanac of American Politics 1994. Washington, D.C.: National Journal Group. p. 395. ISBN 0-89234-057-6.
- ^ Jump up to: a b Barone, Michael; Richard E. Cohen (2003). The Almanac of American Politics 2004. Washington, D.C.: National Journal Group. p. 542. ISBN 0-89234-105-X.
- ^ Jump up to: a b c d Nutting, Brian; H. Amy Stern, eds. (2002). Congressional Quarterly's Politics in America 2002. Washington, D.C.: Congressional Quarterly. pp. 312–313. ISBN 1-56802-655-2.
- ^ Jump up to: a b c Sharp, J. Michael (2006). Directory of Congressional Voting Scores and Interest Group Ratings. Washington, D.C.: CQ Press. p. 941. ISBN 1-56802-970-5.
- ^ Jump up to: a b c Barone, et al. (2001), p. 512.
- ^ Jump up to: a b "William Lipinski on VoteMatch". Archived from the original on September 28, 2007. Retrieved March 27, 2007.
- ^ Based on results from 1832 through 2002 in the Guide to U.S. Elections.
- ^ Barone, et al. (2005), pp. 567-568.
- ^ Jump up to: a b Illinois State Board of Elections (March 20, 2012). "General Primary Official Vote Totals Book" (PDF). Downloadable Vote Totals. Illinois State Board of Elections. Archived (PDF) from the original on September 12, 2021.
- ^ Illinois State Board of Elections (November 6, 2012). "Official Vote General Election" (PDF). Downloadable Vote Totals. Illinois State Board of Elections. Archived (PDF) from the original on September 12, 2021.
- ^ https://www.elections.il.gov/electionoperations/votetotalsearch.aspx
- ^ https://www.elections.il.gov/electionoperations/votetotalsearch.aspx
- ^ O'Connell, Patrick M. "Businesswoman Marie Newman's victory in Democratic primary ends decades of Lipinski reign". Chicago Tribune. pp. March 18, 2020. Retrieved March 19, 2020.
- ^ Illinois State Board of Elections (November 3, 2020). "Official Canvass General Election" (PDF). Downloadable Vote Totals. Illinois State Board of Elections. Archived (PDF) from the original on September 10, 2021.
- ^ Jump up to: a b c d e Vote totals from 1852 to 1868 are based on cumulative county totals as listed in Illinois: Historical and Statistical (1892), , Chicago: Fergus Printing Co., pp. 1208-1209.
- ^ Jump up to: a b Congressional District Data Book: Districts of the 87th Congress. Washington, D.C.: U.S. Bureau of the Census. 1961. p. 17.
- ^ Barone, Michael; Grant Ujifusa; Douglas Matthews (1972). The Almanac of American Politics. Boston: Gambit. p. 199. ISBN 0-87645-053-2.
- ^ Barone, Michael; Grant Ujifusa; Douglas Matthews (1973). The Almanac of American Politics. Boston: Gambit. p. 267. ISBN 0-87645-077-X.
- ^ Barone, Michael; Grant Ujifusa; Douglas Matthews (1977). The Almanac of American Politics 1978. New York City: E. P. Dutton. p. 228. ISBN 0-87690-255-7.
- ^ Barone, Michael; Grant Ujifusa (1981). The Almanac of American Politics 1982. Washington, D.C.: Barone & Co. p. 299. ISBN 0-940702-00-2.
- ^ Barone, Michael; Grant Ujifusa (1985). The Almanac of American Politics 1986. Washington, D.C.: National Journal Group. p. 398. ISBN 0-89234-032-0.
- ^ Barone, Michael; Grant Ujifusa (1989). The Almanac of American Politics 1990. Washington, D.C.: National Journal Group. p. 355. ISBN 0-89234-043-6.
- ^ Barone, et al. (1993) p. 394.
- ^ Barone, et al. (2005) p. 566.
- ^ Jump up to: a b c Nir, David (November 19, 2012). "Daily Kos Elections' presidential results by congressional district for 2016, 2012, and 2008". Daily Kos.
- ^ Parsons, et al. (1986), pp. 159-160.
- ^ Parsons, Stanley B.; Michael J. Dubin; Karen Toombs Parsons (1990). United States Congressional Districts, 1883-1913. Westport, CT: Greenwood Press. pp. 23–27. ISBN 0-313-26482-1.
- ^ Parsons, et al. (1990), pp. 182-186.
- ^ Parsons, et al. (1990), pp. 187-191.
- ^ Guide to U.S. Elections, p. 1005.
- ^ Parsons, et al. (1990), pp. 326-330.
- ^ Barrett, Edward A. (ed.). Blue Book of the State of Illinois, 1947-1948. Springfield, IL: State of Illinois. p. 110.CS1 maint: extra text: authors list (link)
- ^ Barrett, pp. 113-114.
- ^ Congressional District Atlas of the United States. Washington, D.C.: U.S. Bureau of the Census. 1960. pp. 18–20.
- ^ Congressional District Data Book: Districts of the 88th Congress. Washington, D.C.: U.S. Bureau of the Census. 1963. pp. 125–127.
- ^ Congressional District Data Book, Illinois supplement. Washington, D.C.: U.S. Bureau of the Census. 1966. pp. 2–4.
- ^ Congressional District Data Book: 93rd Congress. Washington, D.C.: U.S. Bureau of the Census. 1973. pp. 145, 147–148.
- ^ Gottron, Martha V. (ed.) (1983). Congressional Districts in the 1980s. Washington, D.C.: Congressional Quarterly. p. 163. ISBN 0-87187-264-1.CS1 maint: extra text: authors list (link)
- ^ Congressional District Atlas: 103rd Congress of the United States. Washington, D.C.: U.S. Bureau of the Census. 1993. pp. Illinois-1, 5, 22–26, 28–29, 31–32, 34. ISBN 0-16-041689-2.
External links[]
- Washington Post page on the 3rd District of Illinois
- "Statistical Abstract of the United States: 2003" (PDF). (163 KB) - Congressional District Profiles, U.S. Census Bureau
- "U.S. Census Bureau - 3rd District map" (PDF). (1.26 MB)
- U.S. Census Bureau - 3rd District Fact Sheet
Coordinates: 41°40′44″N 87°53′31″W / 41.67889°N 87.89194°W
- Congressional districts of Illinois
- Government of Cook County, Illinois
- Constituencies established in 1833
- 1833 establishments in Illinois
