1998–99 Australian region cyclone season
| 1998–99 Australian region cyclone season | |
|---|---|
 Season summary map | |
| Seasonal boundaries | |
| First system formed | 7 October 1998 |
| Last system dissipated | 21 April 1999 |
| Strongest storm | |
| Name | Gwenda (Most intense tropical cyclone in the Australian region on record, tied with Inigo) |
| • Maximum winds | 220 km/h (140 mph) (10-minute sustained) |
| • Lowest pressure | 900 hPa (mbar) |
| Seasonal statistics | |
| Tropical lows | 21 |
| Tropical cyclones | 14 official, 3 unofficial |
| Severe tropical cyclones | 9 |
| Total fatalities | 7 direct, 1 indirect |
| Total damage | $250 million (1999 USD) |
| Related articles | |
The 1998–99 Australian region cyclone season was an above average tropical cyclone season that featured Gwenda, the most intense tropical cyclone in the Australian Region (later tied with Inigo in 2003) . It began on 1 November 1998 and ended on 30 April 1999. The regional tropical cyclone operational plan also defines a tropical cyclone year separately from a tropical cyclone season, which runs from 1 July 1998 to 30 June 1999.
Tropical cyclones in this area are monitored by four Tropical Cyclone Warning Centres (TCWCs): the Australian Bureau of Meteorology in Perth, Darwin, and Brisbane; and TCWC Port Moresby in Papua New Guinea.[1]
Systems[]

Tropical Cyclone Zelia[]
| Category 1 tropical cyclone (Australian scale) | |
| Tropical storm (SSHWS) | |
  | |
| Duration | 7 October – 10 October |
|---|---|
| Peak intensity | 75 km/h (45 mph) (10-min) 990 hPa (mbar) |
This storm developed near Cocos Island.
Severe Tropical Cyclone Alison[]
| Category 3 severe tropical cyclone (Australian scale) | |
| Category 1 tropical cyclone (SSHWS) | |
  | |
| Duration | 7 November – 13 November (Exited basin) |
|---|---|
| Peak intensity | 155 km/h (100 mph) (10-min) 955 hPa (mbar) |
A tropical depression formed on 6 November 1998 near Cocos Island. The tropical depression rapidly strengthened into Tropical Cyclone Alison on the same day. Alison was 130 miles northeast of Cocos Island and was moving southeast.[1] Alison passed only 25 miles south of Cocos bringing gale-force winds to the island. On 11 November, Alison encountered wind shear which weakened the storm and by 13 November the storm dissipated.[2]
Severe Tropical Cyclone Billy[]
| Category 3 severe tropical cyclone (Australian scale) | |
| Category 1 tropical cyclone (SSHWS) | |
  | |
| Duration | 1 December – 6 December |
|---|---|
| Peak intensity | 130 km/h (80 mph) (10-min) 965 hPa (mbar) |
Billy formed on 1 December 1998 off the northwestern Australia coast. The storm moved nearly due south before making landfall near Onslow, Western Australia.[3] Damage estimates from Australia are unavailable.
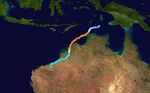
Severe Tropical Cyclone Thelma[]
| Category 5 severe tropical cyclone (Australian scale) | |
| Category 4 tropical cyclone (SSHWS) | |
  | |
| Duration | 3 December – 15 December |
|---|---|
| Peak intensity | 220 km/h (140 mph) (10-min) 920 hPa (mbar) |
On 3 December a tropical depression formed in the Arafura Sea, 250 miles east-northeast of Darwin. The system drifted southwestward, strengthening into Tropical Cyclone Thelma on 6 December. Thelma continued to intensify as it turned to the south-southwest, reaching Category 5 strengthen on the Australian cyclone scale as it brushed the Tiwi Islands.[4] Cyclone Thelma reached a peak of 140 mph with a minimum pressure of 925 mbar on the 8th, and made landfall on the western Australian coastline on the 10th. After making landfall, the storm paralleled the coastline, and rapidly weakened to a tropical storm. Favorable conditions aloft allowed it to remain a tropical storm until the 15th, when the storm dissipated near Port Hedland. Thelma was responsible for moderate rainfall and downed trees, but caused no casualties due to the sparse population of where it hit.
Tropical Low[]
| Tropical low (Australian scale) | |
 | |
| Duration | 7 December – 13 December |
|---|---|
| Peak intensity | 45 km/h (30 mph) (10-min) 1000 hPa (mbar) |
On 3 December, an area of concentrated convection developed from a monsoon trough over the Indian Ocean. The next day RSMC La Reunion issued one advisory on this system, labeling it "A3". Over the next few days the area drifted eastward into the Australian region and slowly organized. The warning center at Perth initiated bulletins on the tropical low on 7 December when the system was located 175 nm west-northwest of Cocos Island. The low remained essentially stationary for the next 48 hours while slowly weakening. Perth discontinued bulletins on the 8th, but continued to track the low for the next few days. The remnants of the low drifted eastward to a point about 150 nm north-northwest of Cocos. There is a significant possibility that this low is the same persistent one that developed into Tropical Cyclone Cathy.[2]
Tropical Cyclone Cathy[]
| Category 2 tropical cyclone (Australian scale) | |
| Tropical storm (SSHWS) | |
  | |
| Duration | 22 December – 28 December |
|---|---|
| Peak intensity | 110 km/h (70 mph) (10-min) 975 hPa (mbar) |
This storm developed near Cocos Island.
Tropical Low[]
| Tropical low (Australian scale) | |
| | |
| Duration | 26 December – 2 January |
|---|---|
| Peak intensity | 55 km/h (35 mph) (10-min) 996 hPa (mbar) |
A tropical disturbance was first noted by JTWC over the Gulf of Carpentaria on 25 December. The system deepened as it moved slowly westward over the next two days. The disturbance continued to intensify over the Northern Territory, until it stalled over the border of Queensland for a couple of days. On 30 December the system moved over water and began to develop further, prompting TCWC Brisbane to issue a Tropical Cyclone Watch for portions of the southern Gulf coast. The low turned south-southeast shortly afterwards, and warnings were canceled when it became apparent that the center moved back inland. The system weakened over northwestern Queensland and dissipated on 2 January.[2]
The low brought heavy rains to the state of Queensland, with many centers reporting 24-hour totals over 150 mm. This rainfall activity was enhanced by an upper-level trough which brought showers as far south as Sydney on 1 January. Widespread flooding caused some of river systems which feed into Lake Eyre to reach flood stage. At least one death was indirectly attributed to the storm, when heavy rain and fog caused a car to drive off a road north of Brisbane.[2]
Tropical Cyclone Olinda[]
| Category 1 tropical cyclone (Australian scale) | |
| Tropical storm (SSHWS) | |
  | |
| Duration | 20 January – 21 January (Exited basin) |
|---|---|
| Peak intensity | 85 km/h (50 mph) (10-min) 987 hPa (mbar) |
Tropical Cyclone Olinda existed from 20 to 21 January.
Severe Tropical Cyclone Damien–Birenda[]
| Category 3 severe tropical cyclone (Australian scale) | |
| Category 1 tropical cyclone (SSHWS) | |
  | |
| Duration | 21 January – 28 January (Exited basin) |
|---|---|
| Peak intensity | 155 km/h (100 mph) (10-min) 950 hPa (mbar) |
Severe Tropical Cyclone Damien–Birenda existed from 21 to 28 January.
Tropical Cyclone Pete[]
| Category 2 tropical cyclone (Australian scale) | |
| Tropical storm (SSHWS) | |
  | |
| Duration | 21 January – 23 January (Exited basin) |
|---|---|
| Peak intensity | 95 km/h (60 mph) (10-min) 985 hPa (mbar) |
Tropical Cyclone Pete existed from 21 to 23 January.
Tropical Low 16P[]
| Tropical low (Australian scale) | |
| Tropical storm (SSHWS) | |
 | |
| Duration | 24 January – 27 January |
|---|---|
| Peak intensity | 55 km/h (35 mph) (10-min) 993 hPa (mbar) |
An elongated monsoon trough spread across northern Australia in late January. On 22 January the Joint Typhoon Warning Center began mentioning a disturbance in the Gulf of Carpentaria in their daily Tropical Weather Outlooks. The disturbance drifted eastward from the north of Arnhem Land into the northern Gulf. The TCWC at Darwin begin issuing warnings on 24 January and a cyclone watch was posted for portions of the southern Gulf Coast. JTWC issued a Formation Alert early that day and began issuing warnings on the 25th.[3]
The system drifted slowly in a south-southwesterly direction over the next couple of days. According to JTWC estimates, the system strengthened into a tropical storm at 1200 UTC on 25 January.[4] Conditions deteriorated on 26 January when the system ran into some vertical wind shear and weakened. The JTWC noted that a second circulation appeared to the east of the warning position and that dry air entrainment had led to decreased organization of the depressions. When the low was about 125 nm east of Alyangula, Darwin issued the last gale warning, and ceased advices on the slow-moving system 24 hours later.[3]
Tropical Low 18S[]
| Tropical low (Australian scale) | |
| Tropical storm (SSHWS) | |
 | |
| Duration | 31 January – 14 February |
|---|---|
| Peak intensity | 75 km/h (45 mph) (10-min) 995 hPa (mbar) |
A tropical low numbered 18S existed from 31 January to 14 February.
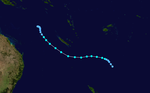
Severe Tropical Cyclone Rona[]
| Category 3 severe tropical cyclone (Australian scale) | |
| Tropical storm (SSHWS) | |
  | |
| Duration | 9 February – 12 February |
|---|---|
| Peak intensity | 140 km/h (85 mph) (10-min) 970 hPa (mbar) |
Rona formed in the Coral Sea and crossed the Queensland coast on 11 February causing major flooding between Cairns and Townsville with extensive crop damage.[5] It eventually reformed into Severe Tropical Cyclone Frank in the South Pacific.
Tropical Low (26S)[]
| Tropical low (Australian scale) | |
| Tropical storm (SSHWS) | |
 | |
| Duration | 7 March – 14 March |
|---|---|
| Peak intensity | 60 km/h (40 mph) (10-min) 1000 hPa (mbar) |
A tropical low numbered 26S existed from 7 to 14 March.
Severe Tropical Cyclone Elaine[]
| Category 4 severe tropical cyclone (Australian scale) | |
| Category 3 tropical cyclone (SSHWS) | |
  | |
| Duration | 15 March – 20 March |
|---|---|
| Peak intensity | 165 km/h (105 mph) (10-min) 945 hPa (mbar) |
Making landfall on 20 March, this cyclone devastated the small town of Moora, where houses and commercial properties in the town were inundated by the floodwaters and approximately 1000 people were evacuated.[5]
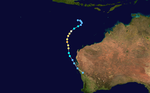
Severe Tropical Cyclone Vance[]
| Category 5 severe tropical cyclone (Australian scale) | |
| Category 4 tropical cyclone (SSHWS) | |
  | |
| Duration | 14 March – 23 March |
|---|---|
| Peak intensity | 220 km/h (140 mph) (10-min) 910 hPa (mbar) |
A tropical depression formed in the Timor Sea on 16 March 1999. The storm lingered before being upgraded to cyclone status and was named Vance. By 19 March, Cyclone Vance had reached Category 3 status as it neared the Australian coast. On 20 March, Vance became a Category 5 Australian cyclone as it made landfall near Exmouth. Moving southward, the interaction with land weakened Vance and by 24 March, the storm dissipated before reaching Victoria, Australia.
Vance caused significant flooding and property damage but there were no deaths.[6]
Severe Tropical Cyclone Vance devastated the northwest town of Exmouth. A measured wind gust of 267 km/h, recorded at 11.50 am (WST) 22 March, at Learmonth Meteorological Office, is the highest wind speed ever recorded on mainland Australia. The Bureau's Regional Director Len Broadbridge said that Vance was one of the most severe cyclones in Australia's history. "The wind speeds experienced at Exmouth are possibly the strongest experienced by an Australian town or city in recorded history." [7]
Tropical Low[]
| Tropical low (Australian scale) | |
| | |
| Duration | 20 March – 21 March |
|---|---|
| Peak intensity | ≤60 km/h (40 mph) (10-min) 996 hPa (mbar) |
Another tropical low existed from 20 to 21 March.
Severe Tropical Cyclone Frederic–Evrina[]
| Category 5 severe tropical cyclone (Australian scale) | |
| Category 5 tropical cyclone (SSHWS) | |
  | |
| Duration | 25 March – 1 April (Exited basin) |
|---|---|
| Peak intensity | 205 km/h (125 mph) (10-min) 920 hPa (mbar) |
This cyclone moved into Reunion area of responsibility on 1 April.
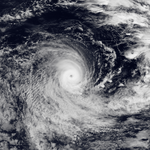
Severe Tropical Cyclone Gwenda[]
| Category 5 severe tropical cyclone (Australian scale) | |
| Category 4 tropical cyclone (SSHWS) | |
  | |
| Duration | 2 April – 8 April |
|---|---|
| Peak intensity | 220 km/h (140 mph) (10-min) 900 hPa (mbar) |
Cyclone Gwenda was another category 5 cyclone, the strongest of the season and the most powerful cyclone in this region on record. It formed on 4 April, and fortunately weakened before making landfall near Port Hedland, Australia on 7 April. Damage was minimal. [8]
Tropical Low[]
| Tropical low (Australian scale) | |
| | |
| Duration | 16 April – 19 April |
|---|---|
| Peak intensity | 80 km/h (50 mph) (gusts) 999 hPa (mbar) |
Another tropical low existed from 16 to 19 April.
Tropical Cyclone Hamish[]
| Category 2 tropical cyclone (Australian scale) | |
| Tropical storm (SSHWS) | |
  | |
| Duration | 19 April – 21 April (Exited basin) |
|---|---|
| Peak intensity | 100 km/h (65 mph) (10-min) 980 hPa (mbar) |
This cyclone moved into Reunion area of responsibility on 21 April at tropical cyclone intensity. However, it was designated F1 and not named.
Storm names[]
Tropical cyclones are assigned names by the Australian Bureau of Meteorology or Papua New Guinea. Tropical cyclones are named if they are non-frontal low pressure systems of synoptic scale developing over warm waters, or if Dvorak intensity analysis indicate the presence of gale force or stronger winds near the centre. Therefore, tropical systems with gales in one or more quadrants, but not near the centre, are not named.[6] All names assigned in the Australian region are selected sequentially. Only the names used during this cyclone season are listed below. The complete list of names for each basin are found in the World Meteorological Organization's official lists.[7]
Each Australian Tropical Cyclone Warning Centre (Perth, Darwin, and Brisbane) maintains a list of names arranged alphabetically and alternating male and female. Tropical cyclones that develop in the South-East Indian Ocean are assigned names by the Tropical Cyclone Warning Centre in Perth. This region includes the areas east of 90°E, south of the Equator, and west of 125°E. Tropical cyclones that develop south of the Equator between 125°E and 141°E are assigned names by the Tropical Cyclone Warning Centre in Darwin, Northern Territory. This area includes most of the cyclones that form in the Arafura Sea and Western Gulf of Carpentaria. Tropical cyclones in the Coral Sea and Eastern Gulf of Carpentaria between 141°E and 160°E and south of 10°S are assigned names by the Tropical Cyclone Warning Centre in Brisbane, Queensland.[7]
Perth
- Zelia – Alison – Billy – Cathy – Damien – Elaine – Frederic – Gwenda – Hamish
Darwin
- Thelma – Vance
Brisbane
- Olinda – Pete – Rona
Additionally, the Tropical Cyclone Warning Centre in Port Moresby, Papua New Guinea reserves the right to name cyclones that develop in the Solomon Sea and Gulf of Papua, north of 10°S between 141°E and 160°E. Names are selected randomly from their list and retired once they are used.[8] No cyclones were named by this warning centre during the 1998–99 season.
Season effects[]
| Name | Dates | Peak intensity | Areas affected | Damage (US$) |
Deaths | |||
|---|---|---|---|---|---|---|---|---|
| Category | Wind speed (km/h (mph)) |
Pressure (hPa) | ||||||
| Zelia | 7–10 Oct. | Category 1 tropical cyclone | 75 (45) | 990 | Cocos Island | None | 0 | |
| Alison | 7–13 Nov. | Category 3 severe tropical cyclone | 155 (100) | 955 | Cocos Island | None | 0 | |
| Billy | 1–6 Dec. | Category 3 severe tropical cyclone | 130 (80) | 965 | Cocos Island | None | 0 | |
| Thelma | 3–15 Dec. | Category 5 severe tropical cyclone | 220 (140) | 920 | Northern Territory, Western Australia | None | 0 | |
| TL | 7–13 Dec. | Tropical low | 45 (30) | 1000 | None | 0 | ||
| Cathy | 22–28 Dec. | Category 2 tropical cyclone | 110 (70) | 975 | None | 0 | ||
| TL | 26 Dec. – 2 Jan. | Tropical low | 55 (35) | 996 | None | 0 | ||
| Olinda | 20–21 Jan. | Category 1 tropical cyclone | 85 (50) | 987 | None | 0 | ||
| Season aggregates | ||||||||
| 21 systems | 7 Oct. – 21 Apr. | None | ||||||
See also[]
- List of Southern Hemisphere tropical cyclone seasons
- Atlantic hurricane seasons: 1998, 1999
- Pacific hurricane seasons: 1998, 1999
- Pacific typhoon seasons: 1998, 1999
- North Indian Ocean cyclone seasons: 1998, 1999
References[]
- ^ http://www.wmo.ch/web/www/TCP/TCP24-English2004.pdf[permanent dead link]
- ^ Jump up to: a b c Gary Padgett (1999). "Monthly Global Tropical Cyclone Summary, December 1998". Retrieved 18 July 2008.
- ^ Jump up to: a b Gary Padgett (1999). "Monthly Global Tropical Cyclone Summary, January 1999". Retrieved 18 July 2008.
- ^ Joint Typhoon Warning Center (1999). "Best Track for Cyclone 16P". Retrieved 18 July 2008.
- ^ "The Weather of 1998-99" (PDF). Bureau of Meteorology.
- ^ "Tropical Cyclones: Frequently Asked Questions". Australian Government Bureau of Meteorology. Retrieved 15 August 2008.
- ^ Jump up to: a b "Tropical Cyclone Operational Plan for the South Pacific and South-East Indian Ocean". World Meteorological Organization. 1999. Retrieved 15 August 2008.[permanent dead link]
- ^ "Tropical Cyclone Operational Plan for the South Pacific and South-East Indian Ocean" (PDF). World Meteorological Organization. 2006. Archived (PDF) from the original on 11 September 2008. Retrieved 15 August 2008.
External links[]
- Joint Typhoon Warning Center (JTWC).
- Australian Government Bureau of Meteorology.
- World Meteorological Organization
- RA V Tropical Cyclone Committee Final Report
- Joint Typhoon Warning Center 1999 ATCR
- Raw cyclone track data[permanent dead link]
- BoM Monthly Significant Weather Summaries
- 1998–99 Annual Summary (Western Australia)
- July 1998 to June 1999 Tropical Cyclone Summaries and Operational Track Data
- Gary Padgett's Southern Hemisphere 1998–1999 Tropical Cyclone Season Review
| show Tropical cyclones of the 1998–99 Australian region cyclone season |
|---|
- 1998–99 Australian region cyclone season
- Australian region cyclone seasons