2008 United States presidential election in Florida
| ||||||||||||||||||||||||||
| Turnout | ||||||||||||||||||||||||||
|---|---|---|---|---|---|---|---|---|---|---|---|---|---|---|---|---|---|---|---|---|---|---|---|---|---|---|
| ||||||||||||||||||||||||||
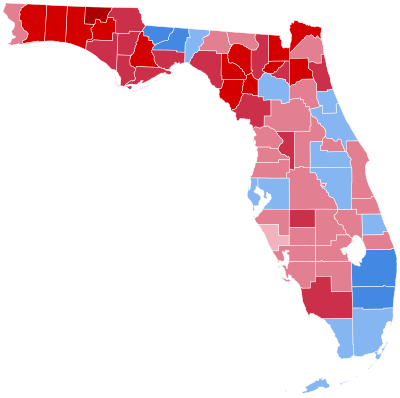 County Results
| ||||||||||||||||||||||||||
| ||||||||||||||||||||||||||


| Elections in Florida |
|---|
 |
|
|
The 2008 United States presidential election in Florida took place on November 4, 2008, and was part of the 2008 United States presidential election. Voters chose 27 representatives, or electors to the Electoral College, who voted for president and vice president.
Florida was won by Democratic nominee Barack Obama by a 2.8% margin of victory, making it the first time since 1996 the state was won by a Democrat. Prior to the election, most news organizations considered this state a toss-up, or swing state, as it was heavily targeted by both campaigns. Despite the fact that polls showed John McCain in the lead throughout much of 2008, Obama took the momentum in the two months before Election Day. Obama ended up winning the state with 51 percent of the vote, including wins in four counties that George W. Bush won in 2004.
Primary elections[]
State-run primaries were held for the Democratic and Republican parties on January 29. The Green Party held its own primary on February 1.
Democratic primary[]
| Florida Democratic Presidential Primary Results – 2008 | |||||
|---|---|---|---|---|---|
| Candidate | Votes | Percentage | Delegates* | ||
| Hillary Clinton | 870,986 | 49.77% | 52.5 | ||
| Barack Obama | 576,214 | 32.93% | 33.5 | ||
| John Edwards | 251,562 | 14.38% | 6.5** | ||
| Joe Biden | 15,704 | 0.90% | 0 | ||
| Bill Richardson | 14,999 | 0.86% | 0 | ||
| Dennis Kucinich | 9,703 | 0.55% | 0 | ||
| Christopher Dodd | 5,477 | 0.31% | 0 | ||
| Mike Gravel | 5,275 | 0.30% | 0 | ||
| Totals | 1,749,920 | 100.00% | 92.5 | ||
*As awarded by the May 31, 2008, meeting of the Rules and Bylaws Committee (RBC).
**Subsequently, some Edwards delegates switched to Obama.
Republican primary[]
McCain prevailed in Florida's Republican presidential primary.[1]
| Candidate | Votes | Percentage | Counties | Delegates |
|---|---|---|---|---|
| John McCain | 701,761 | 36% | 45 | 57 |
| Mitt Romney | 604,932 | 31.03% | 18 | 0 |
| Rudy Giuliani | 286,089 | 14.68% | 0 | 0 |
| Mike Huckabee | 262,681 | 13.47% | 4 | 0 |
| Ron Paul | 62,887 | 3.23% | 0 | 0 |
| Fred Thompson* | 22,668 | 1.16% | 0 | 0 |
| Alan Keyes | 4,060 | 0.21% | 0 | 0 |
| Duncan Hunter* | 2,847 | 0.15% | 0 | 0 |
| Tom Tancredo* | 1,573 | 0.08% | 0 | 0 |
| Totals | 1,949,498 | 100% | 67 | 57 |
* Candidate dropped out of the race prior to primary.
Green primary[]
As part of the 2008 Green Party presidential primaries, the Green Party held a mail-in primary in Florida on February 1.[2]
| Florida Green Party presidential primary (February 1, 2008)[2] | |||
|---|---|---|---|
| Candidate | Votes | Percentage | National delegates |
| Cynthia McKinney | - | - | 11 |
| Ralph Nader | - | - | 2 |
| Kent Mesplay | - | - | 1 |
| Kat Swift | - | - | 1 |
| Total | - | 100% | 16 |
Campaign[]
Republican George W. Bush of Texas carried Florida by a convincing margin of 5% in 2004 against Democrat John Kerry,[3] a much greater margin than in 2000 when Bush controversially won the state's 25 electoral votes against Democrat Al Gore of Tennessee by 537 votes.[4]
Early polls showed Barack Obama faring poorly in Florida. During the primary season, Barack Obama did not campaign there and argued against seating its delegates for the Democratic convention, unfavorable media attention. Moreover, Florida's demographics did not favor him. A haven for retirees, Florida lacked many of the younger voters who passionately supported the Democratic nominee. Thus, in early 2008, opinion polling showed Republican John McCain leading most polls, sometimes by double digits.[5]
Near the end of September, however, when the financial crisis of 2007–2008 became a more potent election issue, Obama proceeded to take the lead in most of the polls.[5] Florida was especially hard hit by the economic shock. It was a hotspot of new home building and suffered tremendously from the subprime lending collapse. In addition, the state was full of retirees depending on 401ks; these were badly hurt by the stock market's fall.
Predictions[]
16 news organizations made state-by-state predictions of the election. Here are their last predictions before election day:
| Source | Ranking |
|---|---|
| D.C. Political Report[6] | Likely R |
| Cook Political Report[7] | Toss-up |
| The Takeaway[8] | Toss-up |
| Electoral-vote.com[9] | Lean D (flip) |
| Washington Post[10] | Lean D (flip) |
| Politico[11] | Lean D (flip) |
| RealClearPolitics[12] | Toss-up |
| FiveThirtyEight[10] | Lean D (flip) |
| CQ Politics[13] | Toss-up |
| The New York Times[14] | Toss-up |
| CNN[15] | Toss-up |
| NPR[10] | Lean R |
| MSNBC[10] | Toss-up |
| Fox News[16] | Toss-up |
| Associated Press[17] | Toss-up |
| Rasmussen Reports[18] | Toss-up |
Polling[]
The 3 poll averages showed McCain leading throughout most of the presidential election season, until the last month of October. The final 3 polls had Obama leading 49% to 48% with undecided voters to decide the election.[19]
Fundraising[]
McCain raised $14,826,093. Obama raised $19,963,592.[20]
Advertising and visits[]
Obama and his interest groups spent $36,990,591 in the state. McCain and his interest groups spent $17,133,501.[21] The Democratic ticket visited the state 12 times to the Republicans' 11 times.[22]
Analysis[]
Obama won the state and its 27 electoral votes on Election Day by a margin of about 2.82%.[23] Obama held a consistent lead for most of the night as returns came in, but the networks avoided calling the state for Obama until the conservative northwestern portion, most of which is in the Central Time Zone, began reporting its returns.
According to exit polling, Obama's win in the state can be attributed to winning 96% of the African-American vote, 57% of Latino voters, and 52% among Independents.[24]
Big wins in the Orlando and Tampa Bay areas, where George W. Bush won in 2004, contributed to Obama's victory. In the former, Obama carried Orange County (which includes Orlando) by 19 points - the best margin for a Democratic candidate in 64 years.[25] Before Al Gore and John Kerry narrowly won it, Orange County hadn't supported a Democratic presidential nominee since Franklin D. Roosevelt's last run for president in 1944. Obama also carried Osceola County near Orlando by a 20-point margin (Bush won it in 2004 52%-47%).[25] His strong performance in Central Florida more than likely helped the Democrats win two U.S. House seats in that region.
In the Tampa Bay region, Obama carried Hillsborough County, home to Tampa, by a 7-point margin.[26] Obama also won Pinellas County, home to St. Petersburg, by a 53%-45% margin.[26] Bush had narrowly carried the county by about 0.1% in 2004.[27]
Like most Democratic candidates, Obama dominated South Florida, winning Miami-Dade, Broward and Palm Beach counties by comfortable margins. The vote from Miami-Dade came in very late in the evening, stopping the major networks from calling the state for Obama earlier in the evening. However, Obama maintained a lead of at least 125,000 votes from the moment polls closed in the state.
On the other hand, John McCain kept the state relatively close, losing by far less than his national average. In northern Florida, a Republican stronghold, McCain won the majority of counties by double-digit landslides. Along the panhandle, McCain routinely took over 70% of the vote.[28] Obama won only a handful of counties - most home to major colleges. Moreover, McCain improved on George Bush's performance in large parts of northern Florida - something he achieved in very few other areas of the country.[28] Obama's sole accomplishment involved Duval County (Jacksonville), where he narrowed George Bush's 61,580-vote victory to a far smaller 7,919 margin.[23][29] In 2008, Duval County had only supported a Democrat for president once since 1952, when Jimmy Carter carried it in 1976.
In addition, McCain was able to do well along the I-4 corridor in central Florida. This heavily populated, "swingy" region often determines which candidate wins in Florida's statewide elections. In 2008, the Republican candidate won most counties, including heavily populated areas such as Brevard County. However, McCain's poor showing in Orlando severely hurt his position in central Florida.
Democrats also picked up two seats from Florida in the U.S. House of Representatives. Democrat Alan Grayson defeated incumbent Republican Ric Keller for Florida's 8th Congressional District seat while Democrat Suzanne Kosmas ousted incumbent Republican Tom Feeney for Florida's 24th Congressional District seat. Republicans, however, were successful at winning back Republican Mark Foley's old congressional seat in Florida's 16th Congressional District seat when Tom Rooney defeated Democratic incumbent Tim Mahoney by a comfortable margin. At the state level, Democrats picked up two seats in the Florida House of Representatives as well.
As of the 2020 presidential election, this is the last election in which Flagler County and Volusia County voted for the Democratic candidate.
Results[]
| United States presidential election in Florida, 2008[30] | |||||
|---|---|---|---|---|---|
| Party | Candidate | Votes | Percentage | Electoral votes | |
| Democratic | Barack Obama | 4,282,367 | 50.91% | 27 | |
| Republican | John McCain | 4,046,219 | 48.1% | 0 | |
| Ecology | Ralph Nader | 28,128 | 0.33% | 0 | |
| Write-Ins | 20,414 | 0.24% | 0 | ||
| Libertarian | Bob Barr | 17,220 | 0.20% | 0 | |
| Constitution | Chuck Baldwin | 7,915 | 0.09% | 0 | |
| Green | Cynthia A. McKinney | 2,887 | 0.03% | 0 | |
| America's Independent | Alan Keyes | 2,550 | 0.03% | 0 | |
| Socialism and Liberation | Gloria LaRiva | 1,516 | 0.02% | 0 | |
| Boston Tea | Charles Jay | 797 | 0.01% | 0 | |
| Socialist Workers | Roger Calero | 533 | 0.01% | 0 | |
| Objectivist | Thomas R. Stevens | 419 | 0.00% | 0 | |
| Socialist | Brian Moore | 405 | 0.00% | 0 | |
| Prohibition | Gene Amondson | 293 | 0.00% | 0 | |
| Republican | Ron Paul | 174 | 0.00% | 0 | |
| Independent | None of these candidates | 23 | 0.00% | 0 | |
| Totals | 8,411,861 | 100.00% | 27 | ||
| Voter turnout (Voting age population) | 75.0% | ||||
Results breakdown[]
By county[]
| Barack Hussein Obama II
Democratic |
John Sidney McCain III
Republican |
Various Candides
Other Parties |
Total votes cast | ||||
|---|---|---|---|---|---|---|---|
| County | % | # | % | # | % | # | # |
| Alachua | 60.0% | 75,565 | 38.5% | 48,513 | 1.5% | 1,889 | 125,967 |
| Baker | 21.0% | 2,327 | 78.2% | 8,672 | 0.8% | 88 | 11,087 |
| Bay | 29.1% | 23,653 | 69.7% | 56,683 | 1.3% | 1,030 | 81,366 |
| Bradford | 29.3% | 3,430 | 69.5% | 8,136 | 1.2% | 137 | 11,703 |
| Brevard | 44.2% | 127,620 | 54.5% | 157,589 | 1.3% | 3,718 | 288,927 |
| Broward | 67.0% | 492,640 | 32.3% | 237,729 | 0.6% | 4,722 | 735,091 |
| Calhoun | 29.1% | 1,821 | 69.4% | 4,345 | 1.6% | 98 | 6,264 |
| Charlotte | 45.7% | 39,031 | 52.9% | 45,205 | 1.5% | 1,263 | 85,499 |
| Citrus | 41.1% | 31,460 | 57.1% | 43,706 | 1.8% | 1,343 | 76,509 |
| Clay | 28.2% | 26,697 | 70.9% | 67,203 | 0.9% | 823 | 94,723 |
| Collier | 38.3% | 54,450 | 60.8% | 86,379 | 0.8% | 1,159 | 141,988 |
| Columbia | 32.5% | 9,171 | 66.2% | 18,670 | 1.3% | 374 | 28,215 |
| DeSoto | 43.1% | 4,383 | 55.4% | 5,632 | 1.5% | 149 | 10,164 |
| Dixie | 26.4% | 1,925 | 71.2% | 5,194 | 2.4% | 174 | 7,293 |
| Duval | 48.6% | 202,618 | 50.5% | 210,537 | 0.8% | 3,538 | 416,693 |
| Escambia | 39.8% | 61,572 | 59.0% | 91,411 | 1.2% | 1,891 | 154,874 |
| Flagler | 50.2% | 24,726 | 48.7% | 23,951 | 1.1% | 540 | 49,217 |
| Franklin | 35.3% | 2,134 | 63.1% | 3,818 | 1.6% | 97 | 6,049 |
| Gadsden | 69.1% | 15,582 | 30.2% | 6,811 | 0.6% | 145 | 22,538 |
| Gilchrist | 25.5% | 1,996 | 72.3% | 5,656 | 2.1 | 167 | 7,819 |
| Glades | 41.1% | 1,381 | 57.7% | 1,938 | 1.2% | 39 | 4,261 |
| Gulf | 29.8% | 2,149 | 69.0% | 4,980 | 1.2% | 89 | 7,218 |
| Hamilton | 42.3% | 2,364 | 56.9% | 3,179 | 0.8% | 44 | 5,596 |
| Hardee | 34.5% | 2,568 | 64.0% | 4,763 | 1.5% | 111 | 7,442 |
| Hendry | 45.8% | 4,998 | 52.9% | 5,780 | 1.3% | 139 | 10,917 |
| Hernando | 47.6% | 41,886 | 51.1% | 45,021 | 1.3% | 1,179 | 88,257 |
| Highlands | 40.4% | 18,135 | 58.4% | 26,221 | 1.3% | 566 | 44,922 |
| Hillsborough | 53.1% | 272,963 | 45.9% | 236,355 | 1.0% | 5,177 | 514,501 |
| Holmes | 16.8% | 1,446 | 81.6% | 7,033 | 1.6% | 137 | 8,616 |
| Indian River | 42.0% | 29,710 | 56.7% | 40,176 | 1.3% | 916 | 70,802 |
| Jackson | 35.5% | 7,671 | 63.5% | 13,717 | 1.0% | 225 | 21,613 |
| Jefferson | 51.2% | 4,088 | 47.6% | 3,797 | 1.2% | 93 | 7,978 |
| Lafayette | 19.0% | 642 | 79.3% | 2,679 | 1.7% | 56 | 3,377 |
| Lake | 42.8% | 62,948 | 56.4% | 82,802 | 0.8% | 1,176 | 147,371 |
| Lee | 44.3% | 119,701 | 54.7% | 147,608 | 1.0% | 2,688 | 269,977 |
| Leon | 61.6% | 91,747 | 37.4% | 55,705 | 1.0% | 1,483 | 148,935 |
| Levy | 35.7% | 6,711 | 62.6% | 11,754 | 1.7% | 324 | 18,789 |
| Liberty | 27.2% | 895 | 71.2% | 2,339 | 1.6% | 52 | 3,286 |
| Madison | 47.9% | 4,270 | 51.0% | 4,544 | 1.0% | 93 | 8,907 |
| Manatee | 45.9% | 70,034 | 52.9% | 80,721 | 1.1% | 1,712 | 152,467 |
| Marion | 43.6% | 70,839 | 55.1% | 89,628 | 1.3% | 2,075 | 162,542 |
| Martin | 42.7% | 33,508 | 56.2% | 44,143 | 1.1% | 871 | 78,522 |
| Miami-Dade | 57.8% | 499,831 | 41.7% | 360,551 | 0.5% | 4,254 | 864,636 |
| Monroe | 51.7% | 20,907 | 46.9% | 18,933 | 1.4% | 562 | 40,403 |
| Nassau | 27.7% | 10,618 | 71.4% | 27,403 | 1.0% | 371 | 38,392 |
| Okaloosa | 27.0% | 25,872 | 71.8% | 68,789 | 1.2% | 1,120 | 95,781 |
| Okeechobee | 39.8% | 5,108 | 58.9% | 7,561 | 1.3% | 170 | 12,839 |
| Orange | 59.0% | 273,009 | 40.4% | 186,832 | 0.6% | 2,870 | 463,039 |
| Osceola | 59.4% | 59,962 | 39.7% | 40,086 | 0.9% | 877 | 100,925 |
| Palm Beach | 61.1% | 361,271 | 38.2% | 226,037 | 0.7% | 4,128 | 591,436 |
| Pasco | 47.5% | 102,417 | 51.1% | 110,104 | 1.4% | 3,068 | 215,589 |
| Pinellas | 53.4% | 248,299 | 45.2% | 210,066 | 1.5% | 6,787 | 465,152 |
| Polk | 46.3% | 113,865 | 52.5% | 128,878 | 1.2% | 2,961 | 245,704 |
| Putnam | 39.8% | 13,236 | 59.0% | 19,637 | 1.2% | 406 | 33,279 |
| Saint Johns | 33.7% | 35,791 | 65.3% | 69,222 | 1.0% | 1,067 | 106,081 |
| Saint Lucie | 55.5% | 67,125 | 43.4% | 52,512 | 1.1% | 1,334 | 120,974 |
| Santa Rosa | 25.5% | 19,470 | 73.3% | 55,972 | 1.2% | 935 | 76,377 |
| Sarasota | 49.4% | 102,686 | 49.5% | 102,897 | 1.2% | 2,426 | 208,005 |
| Seminole | 48.1% | 99,335 | 50.9% | 105,070 | 1.0% | 2,021 | 206,426 |
| Sumter | 36.0% | 17,655 | 63.0% | 30,866 | 0.9% | 462 | 48,983 |
| Suwanee | 27.8% | 4,916 | 71.0% | 12,534 | 1.2% | 212 | 17,711 |
| Taylor | 29.9% | 2,803 | 68.8% | 6,457 | 1.4% | 127 | 9,387 |
| Union | 24.6% | 1,300 | 74.4% | 3,940 | 1.0% | 53 | 5,310 |
| Volusia | 52.2% | 127,795 | 46.5% | 113,938 | 1.3% | 3,122 | 244,855 |
| Wakulla | 36.9% | 5,311 | 61.7% | 8,877 | 1.3% | 188 | 14,376 |
| Walton | 26.4% | 7,174 | 72.1% | 19,561 | 1.5% | 404 | 27,139 |
| Washington | 25.6% | 2,863 | 73.2% | 8,178 | 1.1% | 126 | 11,167 |
By congressional district[]
Despite the fact that Barack Obama won the popular vote and the state's 27 electoral votes, John McCain carried 15 congressional districts in Florida, including one district occupied by a Democrat. Obama carried 10 congressional districts, including three districts occupied by Republicans.
| District | McCain | Obama | Representative |
|---|---|---|---|
| 1st | 66.66% | 32.10% | Jeff Miller |
| 2nd | 54.27% | 44.58% | Allen Boyd |
| 3rd | 25.99% | 73.30% | Corrine Brown |
| 4th | 61.35% | 37.66% | Ander Crenshaw |
| 5th | 55.57% | 43.18% | Ginny Brown-Waite |
| 6th | 56.04% | 42.82% | Cliff Stearns |
| 7th | 53.20% | 45.68% | John Mica |
| 8th | 46.77% | 52.47% | Ric Keller (110th Congress) |
| Alan Grayson (111th Congress) | |||
| 9th | 52.17% | 46.57% | Gus Bilirakis |
| 10th | 47.17% | 51.30% | Bill Young |
| 11th | 33.08% | 65.93% | Kathy Castor |
| 12th | 50.23% | 48.84% | Adam Putnam |
| 13th | 52.05% | 46.76% | Vern Buchanan |
| 14th | 56.76% | 42.28% | Connie Mack IV |
| 15th | 51.15% | 47.67% | Bill Posey |
| 16th | 51.80% | 47.11% | Tim Mahoney (110th Congress) |
| Tom Rooney (111th Congress) | |||
| 17th | 12.37% | 87.25% | Kendrick Meek |
| 18th | 48.55% | 50.74% | Ileana Ros-Lehtinen |
| 19th | 33.92% | 65.42% | Robert Wexler |
| 20th | 35.99% | 63.25% | Debbie Wasserman Schultz |
| 21st | 50.83% | 48.68% | Lincoln Díaz-Balart |
| 22nd | 47.59% | 51.63% | Ron Klein |
| 23rd | 16.83% | 82.68% | Alcee Hastings |
| 24th | 50.47% | 48.52% | Tom Feeney (110th Congress) |
| Suzanne Kosmas (111th Congress) | |||
| 25th | 50.25% | 49.22% | Mario Díaz-Balart |
Electors[]
Technically the voters of Florida cast their ballots for electors: representatives to the Electoral College. Florida is allocated 27 electors because it has 25 congressional districts and 2 senators. All candidates who appear on the ballot or qualify to receive write-in votes must submit a list of 27 electors, who pledge to vote for their candidate and his or her running mate. Whoever wins the majority of votes in the state is awarded all 27 electoral votes. Their chosen electors then vote for president and vice president. Although electors are pledged to their candidate and running mate, they are not obligated to vote for them.[31] An elector who votes for someone other than his or her candidate is known as a faithless elector.
The electors of each state and the District of Columbia met on December 15, 2008, to cast their votes for president and vice president. The Electoral College itself never meets as one body. Instead the electors from each state and the District of Columbia met in their respective capitols.
The following were the members of the Electoral College from the state. All 27 were pledged to Barack Obama and Joe Biden[32]
- Wills Chip Arndt
- Wayne Bailey
- Fred Balsera
- Terrie Bradv
- Karl Flagg
- Joe Gibbons
- Janet Goen
- James Golden
- Chris Hand
- Marlon Hill
- Tony Hill
- Joan Joseph
- Allan Katz
- Gena Keebler
- Joan Lane
- Caren Lobo
- Jared Moskowitz
- Angela Rodante
- Frank Sanchez
- Juanita Scott
- Geraldine Thompson
- Karen Thurman
- Carmen Torres
- Kirk Wagar
- Enoch Williams
- Frederica Wilson
References[]
- ^ "January 29, 2008 Presidential Preference Republican Primary". Florida Department of State. Archived from the original on May 22, 2008. Retrieved 2008-05-24.
- ^ Jump up to: a b "Size of State / Caucus Delegations". Archived from the original on 2008-05-28. Retrieved 2018-05-13.
- ^ "CNN.com Election 2004". Retrieved 2008-12-14.
- ^ "2000 Presidential General Election Results - Florida". Retrieved 2008-12-14.
- ^ Jump up to: a b Jay Cost. "Florida: McCain vs. Obama". RealClearPolitics. Retrieved 2009-06-21.
- ^ "D.C.'s Political Report: The complete source for campaign summaries". web.archive.org. 2009-01-01. Retrieved 2021-08-23.
- ^ "Presidential". web.archive.org. 2015-05-05. Retrieved 2021-08-23.
- ^ "Vote 2008 - The Takeaway - Track the Electoral College vote predictions". web.archive.org. 2009-04-22. Retrieved 2021-08-23.
- ^ "Electoral-vote.com: President, Senate, House Updated Daily". electoral-vote.com. Retrieved 2021-08-23.
- ^ Jump up to: a b c d Based on Takeaway
- ^ "POLITICO's 2008 Swing State Map - POLITICO.com". www.politico.com. Retrieved 2016-09-22.
- ^ http://www.realclearpolitics.com/epolls/maps/obama_vs_mccain/?map=5
- ^ "CQ Presidential Election Maps, 2008". CQ Politics. Archived from the original on June 14, 2009. Retrieved December 20, 2009.
- ^ Nagourney, Adam; Zeleny, Jeff; Carter, Shan (2008-11-04). "The Electoral Map: Key States". The New York Times. Retrieved May 26, 2010.
- ^ "October – 2008 – CNN Political Ticker - CNN.com Blogs". CNN. 2008-10-31. Retrieved May 26, 2010.
- ^ "Winning The Electoral College". Fox News. April 27, 2010.
- ^ "roadto270". hosted.ap.org. Retrieved 2016-09-22.
- ^ "Election 2008: Electoral College Update - Rasmussen Reports™". www.rasmussenreports.com. Retrieved 2016-09-22.
- ^ Election 2008 Polls - Dave Leip's Atlas of U.S. Presidential Elections
- ^ "Presidential Campaign Finance". Archived from the original on 2009-03-24. Retrieved 2009-08-03.
- ^ "Map: Campaign Ad Spending - Election Center 2008 from CNN.com". CNN. Retrieved 2010-05-26.
- ^ "Map: Campaign Candidate Visits - Election Center 2008 from CNN.com". CNN. Retrieved 2010-05-26.
- ^ Jump up to: a b "Florida Department of State Division of Elections: November 4, 2008 General Election". Florida Secretary of State. Retrieved 2009-06-21.[permanent dead link]
- ^ "Local Exit Polls - Election Center 2008 - CNN". Retrieved 2008-12-14.
- ^ Jump up to: a b Dave Leip. "Presidential General Election Map Comparison - Florida". Dave Leip's Atlas of U.S Presidential Elections. Retrieved 2009-06-21.
- ^ Jump up to: a b Dave Leip. "2008 Presidential General Election Results - Florida". Dave Leip's Atlas of U.S Presidential Elections. Retrieved 2009-06-21.
- ^ Dave Leip. "2004 Presidential General Election Results - Florida". Dave Leip's Atlas of U.S Presidential Elections. Retrieved 2009-06-21.
- ^ Jump up to: a b "Election Results 2008". New York Times. Archived from the original on November 3, 2004. Retrieved 2009-06-21.
- ^ "Florida Department of State Division of Elections: November 2, 2004 General Election". Florida Secretary of State. Archived from the original on January 23, 2009. Retrieved June 21, 2009.
- ^ Dave Leip's Atlas of U.S. Presidential Elections
- ^ "Electoral College". California Secretary of State. Archived from the original on October 30, 2008. Retrieved 2008-11-01.
- ^ Florida Certificate of Ascertainment, page 3 of 7.. National Archives and Record Administration.
| show State and district results of the 2008 United States presidential election |
|---|

- 2008 United States presidential election by state
- United States presidential elections in Florida
- 2008 Florida elections