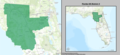
Florida's 3rd congressional district
| Florida's 3rd congressional district | |||
|---|---|---|---|
 Florida's 3rd congressional district - since January 3, 2017. | |||
| Representative |
| ||
| Area | 3,844[1] sq mi (9,960 km2) | ||
| Distribution |
| ||
| Population (2019) | 758,939[3] | ||
| Median household income | $56,005[3] | ||
| Ethnicity |
| ||
| Cook PVI | R+9[4] | ||
Florida's 3rd congressional district is an electoral district of the United States House of Representatives located in Florida. It presently comprises a large section of northern Florida, including the entire counties of Alachua, Clay, Putnam, Bradford, and Union, along with the majority of Marion County. The cities of Gainesville and Palatka are in the district as well as part of Ocala (its northern suburbs). Some Jacksonville suburbs such as Middleburg, Green Cove Springs, and Orange Park are also in the district.
Redistricting in Florida, effective for the 2012 federal elections, radically altered the nature of the 3rd district. From 1993 through 2012 the district called the 3rd district comprised an entirely different territory, roughly similar to the 5th district as of 2013. Likewise the present territory of the new 3rd district, as of the 2012 elections, is made up of parts of the former 2nd, 4th, 5th, and 6th districts, though it is geographically similar to the pre-2013 6th district. The former 3rd district was (and present 5th district is) an intentionally gerrymandered territory designed to unite disparate areas of northeastern Florida with significant African-American populations into a black-majority district, and was overwhelmingly Democratic in voting patterns.
The new 3rd district has a majority white population, largely in rural areas and small towns. The only cities of any size in the district are Gainesville and Ocala. The district has been represented by Republican Kat Cammack since 2021.
The old 3rd district was represented from 1993 through 2012 by Corrine Brown, who was elected to the similar new 5th district in the November 2012 elections.
The 1993–2012 black majority district[]
The old 3rd district was a gerrymandered congressional district. The district included portions of Alachua, Clay, Duval, Lake, Marion, Orange, Putnam, Seminole, and Volusia counties.
History[]
This section does not cite any sources. (October 2013) |
While Florida has had at least three congressional districts since the 1900 U.S. Census, the 1993–2012 3rd congressional district dates to reapportionment done by the Florida Legislature after the 1990 U.S. Census. Because Florida has a large population of African Americans, but not a large enough concentration anywhere in the state to easily configure a congressional district with a majority, there were several attempts to create a few gerrymandered districts which were certain to elect an African American candidate. This created an odd coalition of black Democrats and Republicans who supported such districts (since this not only created black-majority districts, but also made "safer" Republican districts elsewhere). This effort was opposed by many white Democrats, but eventually this idea won the support of the state legislature and this district was created as a result.[5]
The 1993–2012 3rd congressional district was geographically diverse. Starting from the southern part of the district, it included the Pine Hills area of the Orlando-Kissimmee Metropolitan Area with small pockets of African-American neighborhoods in the cities of Sanford, Gainesville, Palatka, and finally the larger African American communities of Jacksonville. Connecting these areas were regions which are sparsely populated—either expansive rural areas or narrow strips which are only a few miles wide. Barack Obama received 73% of the vote in this district in the 2008 Presidential election.
General history of the district in its varying territories[]
This section is empty. You can help by . (April 2013) |
Recent election results in statewide races[]
Current voter registration
as of October 18, 2016
| Year | Office | Results |
|---|---|---|
| 1992 | President | B. Clinton 52–34% |
| 1996 | President | B. Clinton 61–33% |
| 2000 | President | Gore 60–38% |
| 2004 | President | Kerry 65–35% |
| 2008 | President | Obama 73–26% |
| 2012 | President | Romney 56.6–41.9% |
| 2016 | President | Trump 56.2–40.2% |
| 2020 | President | Trump 56.0–42.8% |
List of members representing the district[]
| Member | Party | Years | Cong ress |
Electoral history |
|---|---|---|---|---|
| District created March 4, 1903 | ||||
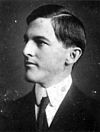
 William B. Lamar |
Democratic | March 4, 1903 – March 3, 1909 |
58th 59th 60th |
Elected in 1902. Re-elected in 1904. Re-elected in 1906. Retired to run for U.S. senator. |
 Dannite H. Mays |
Democratic | March 4, 1909 – March 3, 1913 |
61st 62nd |
Elected in 1908. Re-elected in 1910. Lost renomination. |
 Emmett Wilson |
Democratic | March 4, 1913 – March 3, 1917 |
63rd 64th |
Elected in 1912. Re-elected in 1914. Lost renomination. |
 Walter Kehoe |
Democratic | March 4, 1917 – March 3, 1919 |
65th | Elected in 1916. Lost renomination. |
 John H. Smithwick |
Democratic | March 4, 1919 – March 3, 1927 |
66th 67th 68th 69th |
Elected in 1918. Re-elected in 1920. Re-elected in 1922. Re-elected in 1924. Lost renomination. |
 Tom Yon |
Democratic | March 4, 1927 – March 3, 1933 |
70th 71st 72nd |
Elected in 1926. Re-elected in 1928. Re-elected in 1930. Lost renomination. |
 Millard Caldwell |
Democratic | March 4, 1933 – January 3, 1941 |
73rd 74th 75th 76th |
Elected in 1932. Re-elected in 1934. Re-elected in 1936. Re-elected in 1938. Retired to run for U.S. senator. |
 Bob Sikes |
Democratic | January 3, 1941 – October 19, 1944 |
77th 78th |
Elected in 1940. Re-elected in 1942. Resigned to enter the U.S. Army. |
| Vacant | October 19, 1944 – January 3, 1945 |
78th | ||
Bob Sikes |
Democratic | January 3, 1945 – January 3, 1963 |
79th 80th 81st 82nd 83rd 84th 85th 86th 87th |
Re-elected in November 1944 when the President ordered all legislators on active military duty to return to Washington. Re-elected in 1946. Re-elected in 1948. Re-elected in 1950. Re-elected in 1952. Re-elected in 1954. Re-elected in 1956. Re-elected in 1958. Re-elected in 1960. Redistricted to the 1st district. |
 Claude Pepper |
Democratic | January 3, 1963 – January 3, 1967 |
88th 89th |
Elected in 1962. Re-elected in 1964. Redistricted to the 11th district. |
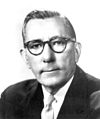
 Charles E. Bennett |
Democratic | January 3, 1967 – January 3, 1993 |
90th 91st 92nd 93rd 94th 95th 96th 97th 98th 99th 100th 101st 102nd |
Redistricted from the 2nd district and re-elected in 1966. Re-elected in 1968. Re-elected in 1970. Re-elected in 1972. Re-elected in 1974. Re-elected in 1976. Re-elected in 1978. Re-elected in 1980. Re-elected in 1982. Re-elected in 1984. Re-elected in 1986. Re-elected in 1988. Re-elected in 1990. Redistricted to the 4th district and retired. |
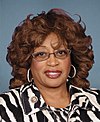 Corrine Brown |
Democratic | January 3, 1993 – January 3, 2013 |
103rd 104th 105th 106th 107th 108th 109th 110th 111th 112th |
Elected in 1992. Re-elected in 1994. Re-elected in 1996. Re-elected in 1998. Re-elected in 2000. Re-elected in 2002. Re-elected in 2004. Re-elected in 2006. Re-elected in 2008. Re-elected in 2010. Redistricted to the 5th district. |
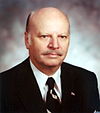
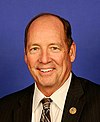 Ted Yoho |
Republican | January 3, 2013 – January 3, 2021 |
113th 114th 115th 116th |
Elected in 2012. Re-elected in 2014. Re-elected in 2016. Re-elected in 2018. Retired. |
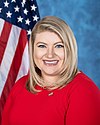 Kat Cammack |
Republican | January 3, 2021 – Present |
117th | Elected in 2020. |
Recent election results[]
2002[]
| Party | Candidate | Votes | % | |
|---|---|---|---|---|
| Democratic | Corrine Brown (Incumbent) | 88,462 | 59.29 | |
| Republican | Jennifer Carroll | 60,747 | 40.71 | |
| Total votes | 149,209 | 100.00 | ||
| Turnout | ||||
| Democratic hold | ||||
2004[]
| Party | Candidate | Votes | % | |
|---|---|---|---|---|
| Democratic | Corrine Brown (Incumbent) | 172,833 | 99.24 | |
| No party | Others | 1,323 | 0.76 | |
| Total votes | 174,156 | 100.00 | ||
| Turnout | ||||
| Democratic hold | ||||
2006[]
| Party | Candidate | Votes | % | |
|---|---|---|---|---|
| Democratic | Corrine Brown (Incumbent) | 100.00 | ||
| Total votes | 100.00 | |||
| Turnout | ||||
| Democratic hold | ||||
2008[]
| Party | Candidate | Votes | % | |
|---|---|---|---|---|
| Democratic | Corrine Brown (Incumbent) | 100.00 | ||
| Total votes | 100.00 | |||
| Turnout | ||||
| Democratic hold | ||||
2010[]
| Party | Candidate | Votes | % | |
|---|---|---|---|---|
| Democratic | Corrine Brown (Incumbent) | 94,744 | 63.04 | |
| Republican | Mike Yost | 50,932 | 33.89 | |
| Independent | Terry Martin-Back | 4,625 | 3.08 | |
| Total votes | 150,301 | 100.00 | ||
| Turnout | ||||
| Democratic hold | ||||
2012[]
| Party | Candidate | Votes | % | |||
|---|---|---|---|---|---|---|
| Republican | Ted Yoho | 204,331 | 64.7 | |||
| Democratic | Jacques Rene Gaillot Jr. | 102,468 | 32.5 | |||
| Independent | Philip Dodds | 8,870 | 2.8 | |||
| Independent | Michael Ricks | 0 | 0 | |||
| Total votes | 315,669 | 100.00 | ||||
| Turnout | ||||||
| Republican gain from Democratic | ||||||
2014[]
| Party | Candidate | Votes | % | |
|---|---|---|---|---|
| Republican | Ted Yoho (Incumbent) | 148,691 | 65.0 | |
| Democratic | Marihelen Wheeler | 73,910 | 32.3 | |
| Independent | Howard Lawson | 6,208 | 2.7 | |
| Total votes | 228,809 | 100.00 | ||
| Turnout | ||||
| Republican hold | ||||
2016[]
| Party | Candidate | Votes | % | |
|---|---|---|---|---|
| Republican | Ted Yoho (Incumbent) | 193,843 | 56.6 | |
| Democratic | Kenneth McGurn | 136,338 | 39.8 | |
| Independent | Tom Wells | 12,519 | 3.7 | |
| Total votes | 342,700 | 100.00 | ||
| Turnout | ||||
| Republican hold | ||||
2018[]
| Party | Candidate | Votes | % | |
|---|---|---|---|---|
| Republican | Ted Yoho (Incumbent) | 176,616 | 57.6 | |
| Democratic | Yvonne Hayes Hinson | 129,880 | 42.4 | |
| Total votes | 306,496 | 100.00 | ||
| Turnout | ||||
| Republican hold | ||||
2020[]
| Party | Candidate | Votes | % | ||
|---|---|---|---|---|---|
| Republican | Kat Cammack | 223,075 | 57.14% | ||
| Democratic | Adam Christensen | 167,326 | 42.86% | ||
| Total votes | 390,401 | 100.0 | |||
| Republican hold | |||||
Historical district boundaries[]
2013–2017 
2003–2013


References[]
- ^ "Congressional Plan--SC14-1905 (Ordered by The Florida Supreme Court, 2-December-2015)" (PDF). Florida Senate Committee on Reapportionment. Retrieved January 11, 2017.
- ^ Bureau, US Census. "Geography Program". The United States Census Bureau.
- ^ Jump up to: a b Center for New Media & Promotion (CNMP), US Census Bureau. "My Congressional District". www.census.gov.
- ^ "Partisan Voting Index – Districts of the 115th Congress" (PDF). The Cook Political Report. April 7, 2017. Retrieved April 7, 2017.
- ^ Leary, Alex (May 14, 2011). "Democrat U.S. Rep. Corrine Brown again aligns with GOP in Florida redistricting battle". Tampa Bay Times. Retrieved August 5, 2014.
- ^ "Florida's 3rd Congressional District elections, 2012". Ballotpedia.
- ^ "Florida's 3rd Congressional District elections, 2014". Ballotpedia.
- ^ "Florida's 3rd Congressional District election, 2016". Ballotpedia.
- ^ "Florida's 3rd Congressional District election, 2018". Ballotpedia.
- Martis, Kenneth C. (1989). The Historical Atlas of Political Parties in the United States Congress. New York: Macmillan Publishing Company.
- Martis, Kenneth C. (1982). The Historical Atlas of United States Congressional Districts. New York: Macmillan Publishing Company.
- Congressional Biographical Directory of the United States 1774–present
External links[]
Coordinates: 29°50′05″N 82°44′09″W / 29.83472°N 82.73583°W

- Congressional districts of Florida