Florida's 19th congressional district
| Florida's 19th congressional district | |||
|---|---|---|---|
 Florida's 19th congressional district since January 3, 2013 | |||
| Representative |
| ||
| Area | 1,367[1] sq mi (3,540 km2) | ||
| Distribution |
| ||
| Population (2019) | 833,013[3] | ||
| Median household income | $67,598[3] | ||
| Ethnicity |
| ||
| Cook PVI | R+12[4] | ||
Florida's 19th congressional district is a U.S. congressional district in Southwest Florida. It includes Cape Coral, Fort Myers, Naples and Marco Island. The district also includes Southwest Florida International Airport and Florida Gulf Coast University. It has been represented by Republican Byron Donalds since 2021.
Presidential election history[]
| Year | Results |
| 2008 | John McCain 56.8% – Barack Obama 42.3% |
| 2012 | Mitt Romney 60.5% – Barack Obama 38.7% |
| 2016 | Donald Trump 59.6% – Hillary Clinton 37.5% |
| 2020 | Donald Trump 59.7% – Joe Biden 39.6% |
List of members representing the district[]
| Member | Party | Years | Cong ress |
Electoral history | District location |
|---|---|---|---|---|---|
| District created January 3, 1983 | |||||
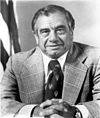 Dante Fascell |
Democratic | January 3, 1983 – January 3, 1993 |
98th 99th 100th 101st 102nd |
Redistricted from the 15th district and re-elected in 1982. Re-elected in 1984. Re-elected in 1986. Re-elected in 1988. Re-elected in 1990. Retired. |
1983–1993 [data unknown/missing] |
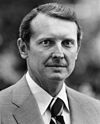 Harry Johnston |
Democratic | January 3, 1993 – January 3, 1997 |
103rd 104th |
Redistricted from the 14th district and re-elected in 1992. Re-elected in 1994. Retired. |
1993–2003 [data unknown/missing] |
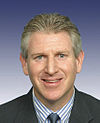 Robert Wexler |
Democratic | January 3, 1997 – January 3, 2010 |
105th 106th 107th 108th 109th 110th 111th |
Elected in 1996. Re-elected in 1998. Re-elected in 2000. Re-elected in 2002. Re-elected in 2004. Re-elected in 2006. Re-elected in 2008. Resigned to become president of the Center for Middle East Peace and Economic Cooperation. | |
| 2003–2013 Based in South Florida. Parts of Palm Beach County and Broward County, including the cities of Coral Springs, Margate and Greenacres. 
| |||||
| Vacant | January 3, 2010 – April 13, 2010 |
111th | |||
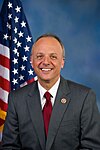 Ted Deutch |
Democratic | April 13, 2010 – January 3, 2013 |
111th 112th |
Elected to finish Wexler's term. Re-elected later in 2010. Redistricted to the 21st district. | |
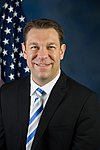 Trey Radel |
Republican | January 3, 2013 – January 27, 2014 |
113th | Elected in 2012. Resigned. |
2013–present Located in Southwest Florida. Including Cape Coral, Fort Myers, Naples and Marco Island. 
|
| Vacant | January 27, 2014 – June 24, 2014 | ||||
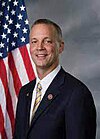 Curt Clawson |
Republican | June 24, 2014 – January 3, 2017 |
113th 114th |
Elected to finish Radel's term. Re-elected later in 2014. Retired.[5] | |
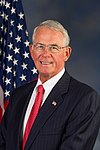 Francis Rooney |
Republican | January 3, 2017 – January 3, 2021 |
115th 116th |
Elected in 2016. Re-elected in 2018. Retired. | |
 Byron Donalds |
Republican | January 3, 2021 – Present |
117th | Elected in 2020. | |
Election results[]
2002[]
| Party | Candidate | Votes | % | |
|---|---|---|---|---|
| Democratic | Robert Wexler (Incumbent) | 156,747 | 72.16% | |
| Republican | Jack Merkle | 60,477 | 27.84% | |
| Majority | 96,720 | 44.32% | ||
| Turnout | 217,224 | |||
| Democratic hold | ||||
2004[]
| Party | Candidate | Votes | % | ±% | |
|---|---|---|---|---|---|
| Democratic | Robert Wexler (Incumbent) | 202,345 | 100% | +27.84% | |
| Majority | 202,345 | 100% | +55.68% | ||
| Turnout | 202,345 | -6.85% | |||
| Democratic hold | Swing | [?] | |||
2006[]
| Party | Candidate | Votes | % | ±% | |
|---|---|---|---|---|---|
| Democratic | Robert Wexler (Incumbent) | 178,456 | 100% | ||
| Majority | 178,456 | 100% | |||
| Turnout | 178,456 | -11.8% | |||
| Democratic hold | Swing | [?] | |||
2008[]
| Party | Candidate | Votes | % | ±% | |
|---|---|---|---|---|---|
| Democratic | Robert Wexler (Incumbent) | 202,465 | 66.16% | -33.84% | |
| Republican | Edward Lynch | 83,357 | 27.24% | +27.24% | |
| Independent | Benjamin Graber | 20,214 | 6.61% | +6.61% | |
| Majority | 119,108 | 38.92% | -61.08% | ||
| Turnout | 306,036 | +71.49% | |||
| Democratic hold | Swing | [?] | |||
2010 (Special)[]
| Party | Candidate | Votes | % | ±% | |
|---|---|---|---|---|---|
| Democratic | Ted Deutch | 43,269 | 62.06% | -4.10% | |
| Republican | Edward Lynch | 24,549 | 35.21% | +7.97% | |
| Independent | Jim McCormick | 1,905 | 2.73% | +2.73% | |
| Majority | 18,720 | 26.85% | -12.07% | ||
| Turnout | 69,723 | -77.22% | |||
| Democratic hold | Swing | [?] | |||
2010[]
| Party | Candidate | Votes | % | ±% | |
|---|---|---|---|---|---|
| Democratic | Ted Deutch (Incumbent) | 132,098 | 62.59% | +0.53% | |
| Republican | Joe Budd | 78,733 | 37.30% | +2.09% | |
| Write-In | Others | 228 | 0.11% | +0.11% | |
| Majority | 53,365 | 25.29% | -1.56% | ||
| Turnout | 211,059 | +202.71% | |||
| Democratic hold | Swing | [?] | |||
2012[]
| Party | Candidate | Votes | % | |||
|---|---|---|---|---|---|---|
| Republican | Trey Radel | 189,833 | 62.0% | |||
| Democratic | Jim Roach | 109,746 | 35.8% | |||
| No Party Affiliation | Brandon M. Smith | 6,637 | 2.2% | |||
| Total votes | 306,216 | |||||
| Turnout | ||||||
| Republican gain from Democratic | ||||||
2014 (Special)[]
| Party | Candidate | Votes | % | |
|---|---|---|---|---|
| Republican | Curt Clawson | 66,922 | 66.9% | |
| Democratic | April Freeman | 29,314 | 29.3% | |
| Libertarian | Ray Netherwood | 3,729 | 3.7% | |
| Write-In | Timothy J. Rossano | 24 | 0.0% | |
| Total votes | 99,989 | |||
| Republican hold | ||||
2014[]
| Party | Candidate | Votes | % | |
|---|---|---|---|---|
| Republican | Curt Clawson (Incumbent) | 159,354 | 64.6% | |
| Democratic | April Freeman | 80,824 | 32.7% | |
| Libertarian | Ray Netherwood | 6,671 | 2.7% | |
| Write-In | Timothy J. Rossano | 12 | 0.0% | |
| Total votes | 246,861 | |||
| Turnout | ||||
| Republican hold | ||||
2016[]
| Party | Candidate | Votes | % | |
|---|---|---|---|---|
| Republican | Francis Rooney | 239,225 | 65.9% | |
| Democratic | Robert M. Neeld | 123,812 | 34.1% | |
| Write-In | David Byron | 109 | 0% | |
| Write-In | Timothy John Rossano | 20 | 0% | |
| Total votes | 363,166 | |||
| Republican hold | ||||
2018[]
| Party | Candidate | Votes | % | |
|---|---|---|---|---|
| Republican | Francis Rooney (incumbent) | 211,465 | 62.3% | |
| Democratic | David Holden | 128,106 | 37.7% | |
| Independent | Pete Pollard (write-in) | 36 | 0.0% | |
| Total votes | 339,607 | 100.0% | ||
| Republican hold | ||||
2020[]
| Party | Candidate | Votes | % | ||
|---|---|---|---|---|---|
| Republican | Byron Donalds | 272,440 | 61.27% | ||
| Democratic | Cindy Banyai | 172,146 | 38.72% | ||
| Independent | Patrick Post (write-in) | 3 | 0.01% | ||
| Total votes | 444,589 | 100.0% | |||
| Republican hold | |||||
References[]
- ^ "Congressional Plan--SC14-1905 (Ordered by The Florida Supreme Court, 2-December-2015)" (PDF). Florida Senate Committee on Reapportionment. Retrieved January 11, 2017.
- ^ "Archived copy". Archived from the original on April 2, 2013. Retrieved February 4, 2018.
{{cite web}}: CS1 maint: archived copy as title (link) - ^ a b Center for New Media & Promotion (CNMP), US Census Bureau. "My Congressional District". www.census.gov.
- ^ "Full Cook PVI Map". datawrapper.dwcdn.net.
- ^ King, Ledyard (May 20, 2016). "U.S. Rep. Curt Clawson won't seek re-election". The News-Press. Retrieved June 16, 2016.
- ^ "Florida Department of State - Election Results: November 6, 2012 General Election". Florida Department of State Department of Elections. Retrieved March 31, 2013.
- ^ "Florida Department of State - Election Results: June 24, 2014 Special General Congressional 19". Florida Department of State Department of Elections. Retrieved June 18, 2016.
- ^ "Florida Department of State - Election Results: November 4, 2014 General Election". Florida Department of State Department of Elections. Retrieved June 18, 2016.
- ^ "Florida Election Watch - Home Page". floridaelectionwatch.gov.
- Martis, Kenneth C. (1989). The Historical Atlas of Political Parties in the United States Congress. New York: Macmillan Publishing Company.
- Congressional Biographical Directory of the United States 1774–present
Coordinates: 26°25′54″N 81°54′24″W / 26.43167°N 81.90667°W
Categories:
- Congressional districts of Florida
