2012 United States presidential election in Arkansas
| ||||||||||||||||||||||||||
| Turnout | 66.65% | |||||||||||||||||||||||||
|---|---|---|---|---|---|---|---|---|---|---|---|---|---|---|---|---|---|---|---|---|---|---|---|---|---|---|
| ||||||||||||||||||||||||||
 County Results
| ||||||||||||||||||||||||||
| ||||||||||||||||||||||||||


| Elections in Arkansas |
|---|
 |
|
show |
|
show |
|
show |
|
show |
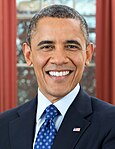
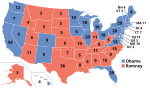
The 2012 United States presidential election in Arkansas took place on November 6, 2012, as part of the 2012 General Election in which all 50 states plus the District of Columbia participated. Arkansas voters chose six electors to represent them in the Electoral College via a popular vote pitting incumbent Democratic President Barack Obama and his running mate, Vice President Joe Biden, against Republican challenger and former Massachusetts Governor Mitt Romney and his running mate, Congressman Paul Ryan.
Romney and Ryan carried Arkansas with 60.57% of the popular vote to Obama's and Biden's 36.88%, winning the state's six electoral votes.[1] While Arkansas had been won by the Democrats as recently as 1996 by native son Bill Clinton, Obama proved a poor fit for the state, and his 23.69% margin of loss was the worst defeat for a Democratic presidential candidate in Arkansas since 1972's margin of 38.1%. Obama also was defeated by a larger margin in Arkansas than Walter Mondale in 1984.
As of 2020, this is the most recent election in which Woodruff County voted for the Democratic candidate. This is also the most recent election Arkansas voted to the left of Utah and the first election since 1984 where either nominee received 60% of the vote.
Democratic primary[]
| |||||||||||||||||||
| |||||||||||||||||||
 Arkansas results by county
Barack Obama
John Wolfe Jr. | |||||||||||||||||||

The Democratic primary had 47 delegates at stake. All 47 delegates were allocated to, and pledged to vote for Barack Obama at the 2012 Democratic National Convention.[2] While John Wolfe Jr. qualified for 19 delegates[3] to the convention by virtue of his performances in Arkansas, State party officials said Wolfe missed two paperwork filing deadlines related to the delegate process, therefore he was not eligible for any delegates.[4][5] Wolfe has commenced legal proceedings to have delegates in his name seated.[6] Eight other unpledged delegates, known as superdelegates, also attended the convention and cast their votes as well.
| Arkansas Democratic primary, 2012[7] | |||
|---|---|---|---|
| Candidate | Votes | Percentage | Delegates |
| 94,936 | 58.37% | 47 | |
| John Wolfe Jr. | 67,711 | 41.63% | 0 |
| Unpledged delegates: | 8 | ||
| Total: | 162,647 | 100.0% | 55 |
| Results by county (actual votes in parentheses):[8] | |||||||||||||||
|---|---|---|---|---|---|---|---|---|---|---|---|---|---|---|---|
| County | Barack Obama | John Wolfe Jr. | County | Barack Obama | John Wolfe Jr. | County | Barack Obama | John Wolfe Jr. | |||||||
| Arkansas | 54.11% (599) | 45.89% (508) | Garland | 70.46% (2647) | 29.54% (1110) | Newton | 74.60% (94) | 25.40% (32) | |||||||
| Ashley | 34.01% (973) | 65.99% (1888) | Grant | 31.43% (644) | 68.57% (1405) | Ouachita | 59.60% (984) | 40.40% (667) | |||||||
| Baxter | 28.32% (190) | 71.68% (481) | Greene | 40.39% (1523) | 59.61% (2248) | Perry | 39.67% (388) | 60.33% (590) | |||||||
| Benton | 84.07% (2402) | 15.93% (455) | Hempstead | 54.60% (421) | 45.40% (350) | Phillips | 63.56% (1997) | 36.44% (1145) | |||||||
| Boone | 69.71% (290) | 30.29% (126) | Hot Spring | 40.16% (1370) | 59.84% (2041) | Pike | 27.90% (560) | 72.10% (1447) | |||||||
| Bradley | 42.54% (505) | 57.46% (682) | Howard | 36.69% (397) | 63.31% (685) | Poinsett | 33.04% (793) | 66.96% (1607) | |||||||
| Calhoun | 33.36% (396) | 66.64% (791) | Independence | 43.32% (665) | 56.68% (870) | Polk | 55.80% (303) | 44.20% (240) | |||||||
| Carroll | 74.47% (388) | 25.53% (133) | Izard | 38.24% (465) | 61.76% (751) | Pope | 60.50% (674) | 39.50% (440) | |||||||
| Chicot | 72.32% (601) | 27.68% (230) | Jackson | 43.18% (687) | 56.82% (904) | Prairie | 32.40% (324) | 67.60% (676) | |||||||
| Clark | 71.38% (1292) | 28.62% (518) | Jefferson | 75.54% (6554) | 24.46% (2122) | Pulaski | 86.19% (19916) | 13.81% (3190) | |||||||
| Clay | 42.22% (953) | 57.78% (1304) | Johnson | 43.90% (1210) | 56.10% (1546) | Randolph | 45.65% (802) | 54.35% (955) | |||||||
| Cleburne | 46.66% (831) | 53.34% (950) | Lafayette | 62.57% (239) | 37.43% (143) | Saline | 65.25% (1930) | 34.75% (1028) | |||||||
| Cleveland | 32.45% (378) | 67.55% (787) | Lawrence | 48.35% (661) | 51.65% (706) | Scott | 36.60% (355) | 63.40% (615) | |||||||
| Columbia | 59.92% (846) | 40.08% (566) | Lee | 64.03% (737) | 35.97% (414) | Searcy | 71.76% (94) | 28.24% (37) | |||||||
| Conway | 54.51% (954) | 45.49% (796) | Lincoln | 33.97% (639) | 66.03% (1242) | Sebastian | 72.13% (1799) | 27.87% (695) | |||||||
| Craighead | 46.61% (3067) | 53.39% (3513) | Little River | 30.07% (756) | 69.93% (1758) | Sevier | 24.64% (499) | 75.36% (1526) | |||||||
| Crawford | 65.66% (631) | 34.34% (330) | Logan | 48.77% (516) | 51.23% (542) | Sharp | 42.47% (403) | 57.53% (546) | |||||||
| Crittenden | 53.92% (2398) | 46.08% (2049) | Lonoke | 52.84% (1024) | 47.16% (914) | St. Francis | 61.42% (1654) | 38.58% (1039) | |||||||
| Cross | 44.52% (740) | 55.48% (928) | Madison | 67.51% (428) | 32.49% (206) | Stone | 33.88% (721) | 66.12% (1407) | |||||||
| Dallas | 48.02% (498) | 51.98% (539) | Marion | 56.25% (243) | 43.75% (189) | Union | 67.59% (1214) | 32.41% (582) | |||||||
| Desha | 53.03% (1139) | 46.97% (1009) | Miller | 62.55% (907) | 37.45% (543) | Van Buren | 47.29% (506) | 52.71% (564) | |||||||
| Drew | 41.94% (1150) | 58.06% (1592) | Mississippi | 75.61% (2424) | 24.39% (782) | Washington | 84.42% (5832) | 15.58% (1076) | |||||||
| Faulkner | 69.19% (1925) | 30.81% (857) | Monroe | 43.38% (514) | 56.62% (671) | White | 52.45% (964) | 47.55% (874) | |||||||
| Franklin | 56.34% (502) | 43.66% (389) | Montgomery | 53.04% (192) | 46.96% (170) | Woodruff | 50.72% (738) | 49.28% (717) | |||||||
| Fulton | 43.42% (508) | 56.58% (662) | Nevada | 36.28% (537) | 63.72% (943) | Yell | 35.86% (545) | 64.14% (975) | |||||||
Republican primary[]
| |||||||||||||||||||||||||||||||||||||||||
| |||||||||||||||||||||||||||||||||||||||||
 Arkansas results by county
Mitt Romney
(Note: Italicization indicates a withdrawn candidacy) | |||||||||||||||||||||||||||||||||||||||||
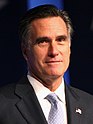

The Republican primary had 33 delegates at stake. Mitt Romney won all 75 counties in Arkansas. As a result, all 33 delegates were allocated to, and pledged to vote for Mitt Romney at the 2012 Republican National Convention.
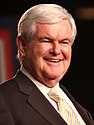
Rick Santorum and Newt Gingrich withdrew from the [presidential race on April 10 and May 2, 2012, respectively. Both endorsed Mitt Romney as the nominee.
| Arkansas Republican primary, 2012[8] | |||
|---|---|---|---|
| Candidate | Votes | Percentage | Delegates |
| Mitt Romney | 104,200 | 68.39% | 33 |
| Ron Paul | 20,399 | 13.39% | 0 |
| Rick Santorum | 20,308 | 13.33% | 0 |
| Newt Gingrich | 7,453 | 4.89% | 0 |
| Unpledged delegates: | 3 | ||
| Total: | 152,360 | 100% | 36 |
| Key: | Withdrew prior to contest |
| Results by county (actual votes in parentheses):[8] | ||||||||||
|---|---|---|---|---|---|---|---|---|---|---|
| County | Mitt Romney | Ron Paul | Rick Santorum (withdrawn) |
Newt Gingrich (withdrawn) |
County | Mitt Romney | Ron Paul | Rick Santorum (withdrawn) |
Newt Gingrich (withdrawn) | |
| Arkansas | 68.86% (418) | 12.69% (77) | 11.53% (70) | 6.92% (42) | Lee | 48.00% (12) | 4.00% (1) | 36.00% (9) | 12.00% (3) | |
| Ashley | 70.09% (232) | 7.25% (24) | 17.52% (58) | 5.14% (17) | Lincoln | 72.55% (37) | 11.76% (6) | 9.80% (5) | 5.88% (3) | |
| Baxter | 73.04% (2338) | 13.71% (439) | 8.78% (281) | 4.47% (143) | Little River | 76.42% (162) | 5.19% (11) | 12.74% (27) | 5.66% (12) | |
| Benton | 65.10% (14527) | 14.69% (3278) | 15.65% (3493) | 4.56% (1018) | Logan | 70.36% (869) | 12.31% (152) | 12.31% (152) | 5.02% (62) | |
| Boone | 65.60% (1903) | 15.41% (447) | 13.89% (403) | 5.10% (148) | Lonoke | 65.51% (2758) | 13.52% (569) | 15.11% (636) | 5.87% (247) | |
| Bradley | 73.66% (193) | 8.02% (21) | 12.60% (33) | 5.73% (15) | Madison | 66.34% (889) | 15.82% (212) | 14.18% (190) | 3.66% (49) | |
| Calhoun | 63.11% (65) | 13.59% (14) | 19.42% (20) | 3.88% (4) | Marion | 69.93% (528) | 13.38% (101) | 12.05% (91) | 4.64% (35) | |
| Carroll | 64.44% (1263) | 15.87% (311) | 13.67% (268) | 6.02% (118) | Miller | 73.82% (1824) | 9.19% (227) | 12.18% (301) | 4.82% (119) | |
| Chicot | 79.07% (102) | 6.20% (8) | 6.20% (8) | 8.53% (11) | Mississippi | 76.47% (364) | 9.45% (45) | 9.45% (45) | 4.62% (22) | |
| Clark | 65.55% (725) | 13.74% (152) | 13.47% (149) | 7.23% (80) | Monroe | 65.82% (52) | 10.13% (8) | 16.46% (13) | 7.59% (6) | |
| Clay | 53.64% (59) | 29.09% (32) | 13.64% (15) | 3.64% (4) | Montgomery | 72.04% (456) | 13.74% (87) | 9.16% (58) | 5.06% (32) | |
| Cleburne | 68.10% (2011) | 11.65% (344) | 13.48% (398) | 6.77% (200) | Nevada | 72.84% (59) | 8.64% (7) | 16.05% (13) | 2.47% (2) | |
| Cleveland | 68.82% (287) | 8.63% (36) | 16.31% (68) | 6.24% (26) | Newton | 61.74% (276) | 15.44% (69) | 17.45% (78) | 5.37% (24) | |
| Columbia | 71.67% (1472) | 10.81% (222) | 12.27% (252) | 5.26% (108) | Ouachita | 75.25% (830) | 7.98% (88) | 13.24% (146) | 3.54% (39) | |
| Conway | 61.90% (442) | 13.87% (99) | 19.47% (139) | 4.76% (34) | Perry | 65.91% (292) | 15.80% (70) | 14.67% (65) | 3.61% (16) | |
| Craighead | 70.92% (1678) | 10.40% (246) | 13.86% (328) | 4.82% (114) | Phillips | 68.63% (35) | 15.69% (8) | 1.96% (1) | 13.73% (7) | |
| Crawford | 72.21% (3259) | 10.26% (463) | 13.27% (599) | 4.25% (192) | Pike | 65.05% (134) | 15.53% (32) | 14.56% (30) | 4.85% (10) | |
| Crittenden | 72.18% (288) | 9.27% (37) | 10.03% (40) | 8.52% (34) | Poinsett | 64.44% (241) | 11.76% (44) | 16.04% (60) | 7.75% (29) | |
| Cross | 75.10% (196) | 6.51% (17) | 12.26% (32) | 6.13% (16) | Polk | 68.32% (1085) | 12.03% (191) | 13.29% (211) | 6.36% (101) | |
| Dallas | 70.87% (253) | 11.20% (40) | 13.45% (48) | 4.48% (16) | Pope | 69.59% (2751) | 12.32% (487) | 12.98% (513) | 5.11% (202) | |
| Desha | 67.16% (45) | 8.96% (6) | 16.42% (11) | 7.46% (5) | Prairie | 60.94% (78) | 22.66% (29) | 13.28% (17) | 3.13% (4) | |
| Drew | 72.56% (423) | 7.55% (44) | 14.24% (83) | 5.66% (33) | Pulaski | 71.27% (9758) | 13.27% (1817) | 11.52% (1578) | 3.94% (539) | |
| Faulkner | 64.50% (5233) | 15.83% (1284) | 14.93% (1211) | 4.75% (385) | Randolph | 67.01% (197) | 12.59% (37) | 15.31% (45) | 5.10% (15) | |
| Franklin | 71.32% (980) | 9.24% (127) | 13.46% (185) | 5.97% (82) | Saline | 66.50% (6782) | 15.02% (1532) | 13.93% (1421) | 4.55% (464) | |
| Fulton | 66.55% (185) | 14.75% (41) | 9.71% (27) | 8.99% (25) | Scott | 70.31% (450) | 11.25% (72) | 13.59% (87) | 4.84% (31) | |
| Garland | 72.83% (5829) | 13.58% (1087) | 8.47% (678) | 5.12% (410) | Searcy | 57.48% (857) | 20.59% (307) | 14.55% (217) | 7.38% (110) | |
| Grant | 69.24% (493) | 12.92% (92) | 12.78% (91) | 5.06% (36) | Sebastian | 70.82% (6331) | 12.09% (1081) | 12.40% (1108) | 4.69% (419) | |
| Greene | 65.83% (422) | 10.45% (67) | 17.32% (111) | 6.40% (41) | Sevier | 71.30% (164) | 14.35% (33) | 9.57% (22) | 4.78% (11) | |
| Hempstead | 71.34% (478) | 10.45% (70) | 11.79% (79) | 6.42% (43) | Sharp | 62.50% (375) | 16.17% (97) | 15.83% (95) | 5.50% (33) | |
| Hot Spring | 67.68% (693) | 13.87% (142) | 13.38% (137) | 5.08% (52) | St. Francis | 76.42% (94) | 8.13% (10) | 7.32% (9) | 8.13% (10) | |
| Howard | 69.68% (193) | 12.64% (35) | 12.27% (34) | 5.42% (15) | Stone | 69.94% (342) | 12.47% (61) | 12.47% (61) | 5.11% (25) | |
| Independence | 68.37% (536) | 13.14% (103) | 14.16% (111) | 4.34% (34) | Union | 73.34% (1642) | 11.39% (255) | 10.50% (235) | 4.78% (107) | |
| Izard | 70.97% (357) | 16.90% (85) | 8.15% (41) | 3.98% (20) | Van Buren | 71.37% (653) | 11.58% (106) | 11.37% (104) | 5.68% (52) | |
| Jackson | 64.55% (122) | 8.99% (17) | 20.63% (39) | 5.82% (11) | Washington | 68.11% (8504) | 14.93% (1864) | 12.92% (1613) | 4.04% (505) | |
| Jefferson | 70.52% (1220) | 9.71% (168) | 13.99% (242) | 5.78% (100) | White | 65.47% (3638) | 12.13% (674) | 16.63% (924) | 5.78% (321) | |
| Johnson | 65.81% (512) | 13.88% (108) | 13.24% (103) | 7.07% (55) | Woodruff | 57.89% (11) | 10.53% (2) | 21.05% (4) | 10.53% (2) | |
| Lafayette | 71.82% (288) | 9.98% (40) | 14.71% (59) | 3.49% (14) | Yell | 68.72% (681) | 13.22% (131) | 12.21% (121) | 5.85% (58) | |
| Lawrence | 66.09% (269) | 13.02% (53) | 14.50% (59) | 6.39% (26) | ||||||
General election[]
Candidate Ballot Access:
- Mitt Romney/Paul Ryan, Republican
- Barack Obama/Joseph Biden, Democratic
- Gary Johnson/James P. Gray, Libertarian
- Jill Stein/Cheri Honkala, Green
- Peta Lindsay/Yari Osorio, Socialism and Liberation
Results[]
| 2012 United States presidential election in Arkansas | ||||||
|---|---|---|---|---|---|---|
| Party | Candidate | Running mate | Votes | Percentage | Electoral votes | |
| Republican | Mitt Romney | Paul Ryan | 647,744 | 60.57% | 6 | |
| Democratic | Barack Obama | Joe Biden | 394,409 | 36.88% | 0 | |
| Libertarian | Gary Johnson | Jim Gray | 16,276 | 1.52% | 0 | |
| Green | Jill Stein | Cheri Honkala | 9,305 | 0.87% | 0 | |
| Socialism and Liberation | Peta Lindsay | Yari Osorio | 1,734 | 0.16% | 0 | |
| Totals | 1,069,468 | 100.00% | 6 | |||
By county[]
| County | Obama% | Obama# | Romney% | Romney# | Others% | Others# | Total |
|---|---|---|---|---|---|---|---|
| Arkansas | 37.80% | 2,455 | 60.01% | 3,897 | 2.19% | 142 | 6,494 |
| Ashley | 36.09% | 2,859 | 61.44% | 4,867 | 2.46% | 195 | 7,921 |
| Baxter | 26.74% | 5,172 | 70.78% | 13,688 | 2.48% | 479 | 19,339 |
| Benton | 28.56% | 22,636 | 68.95% | 54,646 | 2.49% | 1,975 | 79,257 |
| Boone | 24.51% | 3,772 | 72.50% | 11,159 | 2.99% | 460 | 15,391 |
| Bradley | 39.68% | 1,449 | 58.43% | 2,134 | 1.89% | 69 | 3,652 |
| Calhoun | 30.36% | 660 | 67.07% | 1,458 | 2.58% | 56 | 2,174 |
| Carroll | 36.30% | 3,696 | 60.15% | 6,125 | 3.55% | 362 | 10,183 |
| Chicot | 60.74% | 2,649 | 38.29% | 1,670 | .96% | 42 | 4,361 |
| Clark | 45.32% | 3,811 | 51.65% | 4,343 | 3.03% | 255 | 8,409 |
| Clay | 34.01% | 1,738 | 63.11% | 3,225 | 2.88% | 147 | 5,110 |
| Cleburne | 22.50% | 2,620 | 74.64% | 8,693 | 2.87% | 334 | 11,647 |
| Cleveland | 25.87% | 845 | 70.82% | 2,313 | 3.31% | 108 | 3,266 |
| Columbia | 37.62% | 3,557 | 61.24% | 5,790 | 1.14% | 108 | 9,455 |
| Conway | 38.87% | 3,005 | 58.40% | 4,514 | 2.73% | 211 | 7,730 |
| Craighead | 33.21% | 10,527 | 64.20% | 20,350 | 2.6% | 823 | 31,700 |
| Crawford | 23.70% | 4,881 | 73.55% | 15,145 | 2.74% | 565 | 20,591 |
| Crittenden | 56.75% | 9,487 | 41.86% | 6,998 | 1.38% | 231 | 16,716 |
| Cross | 34.11% | 2,279 | 63.90% | 4,269 | 1.99% | 133 | 6,681 |
| Dallas | 43.35% | 1,337 | 53.99% | 1,665 | 2.66% | 82 | 3,084 |
| Desha | 55.27% | 2,443 | 42.90% | 1,896 | 1.83% | 81 | 4,420 |
| Drew | 39.65% | 2,630 | 58.60% | 3,887 | 1.75% | 116 | 6,633 |
| Faulkner | 32.85% | 13,621 | 64.45% | 26,722 | 2.69% | 1,117 | 41,460 |
| Franklin | 26.39% | 1,726 | 70.81% | 4,631 | 2.8% | 183 | 6,540 |
| Fulton | 32.11% | 1,452 | 65.21% | 2,949 | 2.68% | 121 | 4,522 |
| Garland | 33.89% | 13,804 | 63.87% | 26,014 | 2.23% | 910 | 40,728 |
| Grant | 22.66% | 1,468 | 74.53% | 4,829 | 2.81% | 182 | 6,479 |
| Greene | 29.07% | 4,000 | 65.92% | 9,071 | 5.01% | 690 | 13,761 |
| Hempstead | 35.66% | 2,468 | 61.90% | 4,284 | 2.44% | 169 | 6,921 |
| Hot Spring | 34.01% | 3,830 | 63.03% | 7,097 | 2.96% | 333 | 11,260 |
| Howard | 32.97% | 1,471 | 64.81% | 2,892 | 2.22% | 99 | 4,462 |
| Independence | 26.47% | 3,281 | 70.40% | 8,728 | 3.13% | 388 | 12,397 |
| Izard | 28.87% | 1,524 | 67.73% | 3,575 | 3.39% | 179 | 5,278 |
| Jackson | 39.18% | 2,095 | 57.45% | 3,072 | 3.37% | 180 | 5,347 |
| Jefferson | 63.80% | 17,470 | 34.77% | 9,520 | 1.44% | 393 | 27,383 |
| Johnson | 34.56% | 2,799 | 62.53% | 5,064 | 2.9% | 235 | 8,098 |
| Lafayette | 40.05% | 1,173 | 58.48% | 1,713 | 1.47% | 43 | 2,929 |
| Lawrence | 32.27% | 1,788 | 63.83% | 3,536 | 3.9% | 216 | 5,540 |
| Lee | 61.54% | 2,107 | 37.38% | 1,280 | 1.08% | 37 | 3,424 |
| Lincoln | 38.24% | 1,425 | 59.02% | 2,199 | 2.74% | 102 | 3,726 |
| Little River | 30.73% | 1,552 | 67.02% | 3,385 | 2.26% | 114 | 5,051 |
| Logan | 27.40% | 2,009 | 69.28% | 5,079 | 3.31% | 243 | 7,331 |
| Lonoke | 23.33% | 5,625 | 74.15% | 17,880 | 2.53% | 609 | 24,114 |
| Madison | 31.96% | 2,099 | 64.91% | 4,263 | 3.14% | 206 | 6,568 |
| Marion | 28.89% | 2,037 | 67.71% | 4,774 | 3.4% | 240 | 7,051 |
| Miller | 29.47% | 4,518 | 69.29% | 10,622 | 1.23% | 189 | 15,329 |
| Mississippi | 48.35% | 6,467 | 49.37% | 6,603 | 2.28% | 305 | 13,375 |
| Monroe | 49.01% | 1,583 | 49.07% | 1,585 | 1.92% | 62 | 3,230 |
| Montgomery | 27.03% | 920 | 69.59% | 2,369 | 3.38% | 115 | 3,404 |
| Nevada | 38.83% | 1,314 | 58.98% | 1,996 | 2.19% | 74 | 3,384 |
| Newton | 27.12% | 993 | 68.51% | 2,508 | 4.37% | 160 | 3,661 |
| Ouachita | 44.92% | 4,633 | 53.52% | 5,521 | 1.56% | 161 | 10,315 |
| Perry | 30.14% | 1,187 | 65.54% | 2,581 | 4.32% | 170 | 3,938 |
| Phillips | 65.60% | 5,202 | 32.76% | 2,598 | 1.64% | 130 | 7,930 |
| Pike | 22.47% | 851 | 75.16% | 2,847 | 2.38% | 90 | 3,788 |
| Poinsett | 31.61% | 2,390 | 65.79% | 4,974 | 2.59% | 196 | 7,560 |
| Polk | 20.14% | 1,556 | 77.08% | 5,955 | 2.78% | 215 | 7,726 |
| Pope | 25.08% | 5,126 | 72.23% | 14,763 | 2.69% | 550 | 20,439 |
| Prairie | 28.02% | 880 | 68.55% | 2,153 | 3.44% | 108 | 3,141 |
| Pulaski | 54.74% | 87,248 | 43.28% | 68,984 | 1.98% | 3,149 | 159,381 |
| Randolph | 34.35% | 2,046 | 62.14% | 3,701 | 3.51% | 209 | 5,956 |
| Saint Francis | 58.72% | 4,910 | 40.28% | 3,368 | 1.% | 84 | 8,362 |
| Saline | 27.34% | 12,869 | 70.04% | 32,963 | 2.61% | 1,230 | 47,062 |
| Scott | 24.64% | 897 | 72.28% | 2,631 | 3.08% | 112 | 3,640 |
| Searcy | 22.04% | 814 | 73.06% | 2,699 | 4.9% | 181 | 3,694 |
| Sebastian | 30.19% | 13,092 | 67.27% | 29,169 | 2.54% | 1,101 | 43,362 |
| Sevier | 24.06% | 1,042 | 72.42% | 3,136 | 3.51% | 152 | 4,330 |
| Sharp | 28.72% | 2,092 | 67.57% | 4,921 | 3.71% | 270 | 7,283 |
| Stone | 25.33% | 1,356 | 70.53% | 3,776 | 4.15% | 222 | 5,354 |
| Union | 36.07% | 6,196 | 62.29% | 10,699 | 1.64% | 282 | 17,177 |
| Van Buren | 28.49% | 1,832 | 67.88% | 4,365 | 3.62% | 233 | 6,430 |
| Washington | 40.07% | 28,236 | 56.33% | 39,688 | 3.6% | 2,536 | 70,460 |
| White | 21.74% | 5,765 | 75.47% | 20,011 | 2.78% | 738 | 26,514 |
| Woodruff | 49.91% | 1,340 | 45.70% | 1,227 | 4.39% | 118 | 2,685 |
| Yell | 28.82% | 1,722 | 67.66% | 4,042 | 3.52% | 210 | 5,974 |
See also[]
2012 U.S. presidential election | |
|---|---|
|
|
| Democratic Party | |
|
|
| Republican Party | |
|
|
| Related races | |
|
|
| |
- United States presidential elections in Arkansas
- 2012 Democratic Party presidential primaries
- 2012 Republican Party presidential debates and forums
- 2012 Republican Party presidential primaries
- Results of the 2012 Republican Party presidential primaries
References[]
- ^ "Arkansas State General Election November 6, 2012". Arkansas Secretary of State. Retrieved 22 November 2012.
- ^ Jump up to: a b Brantley, Max (Jun 17, 2012). "Democratic convention delegates chosen". Arkansas Times. Retrieved 7 August 2012.
- ^ "Arkansas Democratic Delegation 2008". The Green Papers. Retrieved 2008-02-01.
- ^ Pare, Mike (April 18, 2012). "John Wolfe cries foul in Louisiana primary". Chattanooga Times Free Press. WRCB. Retrieved May 2, 2012.
- ^ Tilove, Jonathan (April 23, 2012). "President Obama will clinch renomination Tuesday, but it may not be unanimous". The Times-Picayune. Retrieved May 2, 2012.
- ^ Candidate who won 42 percent in Arkansas Democratic primary sues for his delegates Archived 2012-05-26 at the Wayback Machine. Fox News. Retrieved May 26, 2012.
- ^ "The Green Papers". Retrieved June 23, 2016.
- ^ Jump up to: a b c Arkansas State Primary Election: Statewide Results, May 22, 2012, Little Rock, AR: Office of the Arkansas Secretary of State, May 22, 2012, retrieved June 3, 2012
External links[]
- The Green Papers: for Arkansas
- The Green Papers: major state elections in chronological order
| hide State and district results of the 2012 United States presidential election | ||
|---|---|---|
|  | |
- 2012 United States presidential election by state
- 2012 Arkansas elections
- United States presidential elections in Arkansas