Election in nebraska
Main article: 2012 United States presidential election
2012 United States presidential election in Nebraska
Nominee
Mitt Romney Barack Obama
Party
Republican
Democratic
Home state
Massachusetts
Illinois
Running mate
Paul Ryan Joe Biden
Electoral vote
5
0
Popular vote
475,064
302,081
Percentage
59.80%
38.03%
Romney
40-50%
50-60%
60-70%
70-80%
80-90%
Obama
50-60%
President before election Barack Obama Democratic
Elected President Barack Obama Democratic
The 2012 United States presidential election in Nebraska took place on November 6, 2012, as part of the 2012 United States presidential election in which all 50 states plus the District of Columbia participated. Voters chose five electors to represent them in the Electoral College via a popular vote pitting incumbent Democratic President Barack Obama and his running mate, Vice President Joe Biden , against Republican challenger and former Massachusetts Governor Mitt Romney and his running mate, Congressman Paul Ryan .
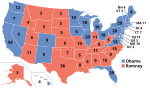
Mitt Romney carried Nebraska , taking 59.80% of the vote to Barack Obama's 38.03%, a margin of 21.77%. Nebraska is one of two states (along with Maine ) which splits its electoral votes based on the winner in each congressional district. In 2012, Romney won all 3 congressional districts, thus winning all 5 of the state's electoral votes. This was a change from 2008 , when the state as a whole had voted for Republican John McCain but Democrat Barack Obama still won an electoral vote from the state. Nebraska's 2nd congressional district , home to Omaha , had split with the rest of the state and awarded one of Nebraska's electoral votes to a Democratic presidential nominee for the first time since 1964 . Nebraska's 2nd congressional district, Indiana , and North Carolina were the only sources of electoral votes to change hands from Obama to the Republicans between 2008 and 2012. Obama only won a single county, Thurston , largely due to its majority and increasingly politically active Native American population. He also narrowly lost three of four counties he won in 2008: Douglas , Lancaster , and Saline , home to the cities of Omaha , Lincoln , and Crete , respectively.
This is the most recent election as of 2020 in which the Democrat won Thurston County and the Republican won Douglas or Lancaster County. This is also the last election (and the sole one since 2000) when both Nebraska's 2nd congressional district did not back the overall winner of the Electoral College, while the Democratic candidate would win the general election without carrying the district (which was the first time that scenario would occur since 1996) as well.
Democratic primary [ ] The Democratic primary was not held as Barack Obama ran unopposed and had secured enough delegates for nomination.[1]
Republican primary [ ] 2012 Nebraska Republican presidential primary
Candidate
Mitt Romney Rick Santorum
Home state
Massachusetts
Pennsylvania
Delegate count
30
0
Popular vote
131,436
25,830
Percentage
70.89%
13.93%
Candidate
Ron Paul
Newt Gingrich
Home state
Texas
Georgia
Delegate count
2
0
Popular vote
18,508
9,628
Percentage
9.98%
5.19%
Nebraska results by county
Mitt Romney
(Note:
Italicization indicates a withdrawn candidacy)
The Republican primary was on May 15, 2012.[2]
2012 Nebraska Republican primary
Candidate
Votes
Percentage
Delegates
Mitt Romney
131,436
70.89%
30
Rick Santorum 25,830
13.93%
0
Ron Paul
18,508
9.98%
2
Newt Gingrich 9,628
5.19%
0
Unpledged delegates:
3
Total:
185,402
100.0%
35
Key: Withdrew prior to contest
Convention [ ] The State Convention was held in Grand Island on July 14, 2012.
Convention Results[3] [4]
Candidate
1st
2nd
3rd
State
Party
Total
Mitt Romney
3
1
3
23
2
32
Ron Paul
0
2
0
0
0
2
Unknown
0
0
0
0
1
1
Total
9
23
3
35
General election [ ] Results [ ]
2012 United States presidential election in Nebraska
Party
Candidate
Running mate
Votes
Percentage
Electoral votes
Republican Mitt Romney Paul Ryan 475,064
59.80%
5
Democratic
Barack Obama
Joe Biden
302,081
38.03%
0
Libertarian
Gary Johnson
Jim Gray
11,109
1.40%
0
Write-Ins
3,717
0.47%
0
Independent
Randall Terry
Missy Smith
2,408
0.30%
0
Totals
794,379
100.00%
5
Results by congressional district [ ] Romney won all three of Nebraska's congressional districts.[5]
District
Romney %
Romney #
Obama %
Obama #
Johnson %
Johnson #
Terry %
Terry #
Representative
1st 57.43%
152,021
40.83%
108,082
1.45%
3,847
0.28%
762
Jeff Fortenberry
2nd 52.85%
140,976
45.70%
121,889
1.27%
3,393
0.18%
469
Lee Terry
3rd 70.23%
182,067
27.82%
72,110
1.44%
3,869
0.45%
1,177
Adrian Smith
By county [ ]
County
Romney %
Romney #
Obama %
Obama #
Others %
Others #
Total
Adams 65.64%
8,316
32.06%
4,062
2.30%
292
12670
Antelope 80.32%
2596
17.67%
571
2.01%
65
3232
Arthur 86.64%
227
11.45%
30
1.91%
5
262
Banner 84.18%
346
13.38%
55
2.43%
10
411
Blaine 88.45%
268
9.57%
29
1.98%
6
303
Boone 76.19%
2,138
21.92%
615
1.89%
53
2806
Box Butte 60.98%
2,869
35.96%
1,692
3.06%
144
4705
Boyd 81.51%
873
17.55%
188
0.93%
10
1071
Brown 83.73%
1302
14.41%
224
1.86%
29
1555
Buffalo 69.76%
13,570
27.58%
5,365
2.66%
518
19453
Burt 60.12%
2,029
38.25%
1,291
1.63%
55
3375
Butler 70.95%
2,738
27.08%
1,045
1.97%
76
3859
Cass 62.04%
7556
35.85%
4367
2.11%
257
12180
Cedar 75.63%
3,278
22.10%
958
2.26%
98
4334
Chase 84.84%
1,584
13.60%
254
1.55%
29
1867
Cherry 83.45%
2,557
14.23%
436
2.32%
71
3064
Cheyenne 74.19%
3449
23.32%
1084
2.50%
116
4649
Clay 75.74%
2232
22.63%
667
1.63%
48
2947
Colfax 66.83%
2051
31.57%
969
1.60%
49
3069
Cuming 72.33%
2876
25.93%
1031
1.74%
69
3976
Custer 78.14%
4296
19.70%
1083
2.16%
119
5498
Dakota 50.42%
3094
47.62%
2922
1.96%
120
6136
Dawes 66.47%
2478
30.36%
1132
3.17%
118
3728
Dawson 69.47%
5460
27.98%
2199
2.54%
200
7859
Deuel 75.02%
763
21.14%
215
3.83%
39
1017
Dixon 64.97%
1745
32.39%
870
2.64%
71
2686
Dodge 60.17%
8995
37.95%
5673
1.89%
282
14950
Douglas 50.56%
113220
47.54%
106456
1.90%
4,251
223927
Dundy 80.41%
792
17.87%
176
1.73%
17
985
Fillmore 69.71%
2007
28.03%
807
2.26%
65
2879
Franklin 72.40%
1112
25.00%
384
2.60%
40
1536
Frontier 77.16%
1007
20.77%
271
2.07%
27
1305
Furnas 79.55%
1782
18.88%
423
1.56%
35
2240
Gage 57.06%
5513
40.40%
3903
2.54%
245
9661
Garden 75.99%
829
22.18%
242
1.83%
20
1091
Garfield 81.81%
769
15.85%
149
2.34%
22
940
Gosper 75.05%
734
23.52%
230
1.43%
14
978
Grant 88.71%
322
8.26%
30
3.03%
11
363
Greeley 69.20%
820
28.69%
340
2.11%
25
1185
Hall 62.51%
12646
35.40%
7161
2.09%
422
20229
Hamilton 73.91%
3600
23.53%
1146
2.57%
125
4871
Harlan 78.46%
1395
19.91%
354
1.63%
29
1778
Hayes 88.31%
476
9.46%
51
2.23%
12
539
Hitchcock 78.80%
1178
18.33%
274
2.88%
43
1495
Holt 79.41%
3922
17.86%
882
2.73%
135
4939
Hooker 83.54%
330
14.94%
59
1.52%
6
395
Howard 65.85%
1890
31.85%
914
2.30%
66
2870
Jefferson 62.86%
2166
34.68%
1195
2.47%
85
3446
Johnson 59.38%
1225
38.29%
790
2.33%
48
2063
Kearney 73.87%
2349
24.31%
773
1.82%
58
3180
Keith 75.01%
3044
22.87%
928
2.12%
86
4058
Keya Paha 81.20%
393
16.53%
80
2.27%
11
484
Kimball 73.21%
1235
23.41%
395
3.38%
57
1687
Knox 71.48%
2885
26.24%
1059
2.28%
92
4036
Lancaster 49.02%
62434
48.69%
62015
2.28%
2,906
127355
Lincoln 68.53%
10728
28.43%
4450
3.05%
477
15655
Logan 82.60%
356
15.78%
68
1.62%
7
431
Loup 81.01%
290
17.32%
62
1.68%
6
358
Madison 72.47%
10062
25.10%
3485
2.43%
338
13885
McPherson 81.44%
237
14.09%
41
4.47%
13
291
Merrick 71.37%
2490
26.51%
925
2.12%
74
3489
Morrill 76.76%
1681
20.78%
455
2.47%
54
2190
Nance 68.23%
1106
29.67%
481
2.10%
34
1621
Nemaha 62.60%
2012
35.10%
1128
2.30%
74
3214
Nuckolls 71.84%
1574
25.92%
568
2.24%
49
2191
Otoe 60.99%
4258
36.68%
2561
2.33%
163
6982
Pawnee 67.04%
899
29.83%
400
3.13%
42
1341
Perkins 81.42%
1135
17.07%
238
1.51%
21
1394
Phelps 77.63%
3400
20.09%
880
2.28%
100
4380
Pierce 78.90%
2707
18.57%
637
2.54%
87
3431
Platte 74.68%
10061
23.37%
3148
1.96%
264
13473
Polk 76.92%
1890
21.49%
528
1.59%
39
2457
Red Willow 78.83%
3891
19.29%
952
1.88%
93
4936
Richardson 65.34%
2443
31.85%
1191
2.81%
105
3739
Rock 85.17%
672
13.05%
103
1.77%
14
789
Saline 51.57%
2557
46.17%
2289
2.26%
112
4958
Sarpy 60.45%
43213
37.31%
26671
2.25%
1,606
71490
Saunders 65.65%
6770
32.07%
3307
2.28%
235
10312
Scotts Bluff 67.53%
9648
30.29%
4327
2.18%
312
14287
Seward 66.06%
5003
31.51%
2386
2.43%
184
7573
Sheridan 81.76%
2021
15.78%
390
2.47%
61
2472
Sherman 60.59%
927
36.08%
552
3.33%
51
1530
Sioux 84.44%
624
13.67%
101
1.89%
14
739
Stanton 73.71%
1949
23.22%
614
3.06%
81
2644
Thayer 70.48%
1874
27.38%
728
2.14%
57
2659
Thomas 88.24%
360
10.29%
42
1.47%
6
408
Thurston 42.39%
939
56.30%
1247
1.31%
29
2215
Valley 75.49%
1657
22.69%
498
1.82%
40
2195
Washington 67.33%
6899
30.57%
3132
2.10%
215
10246
Wayne 67.71%
2493
29.17%
1074
3.12%
115
3682
Webster 72.22%
1258
25.37%
442
2.41%
42
1742
Wheeler 77.01%
345
20.76%
93
2.23%
10
448
York 76.70%
4874
21.61%
1373
1.70%
108
6355
Counties that flipped from Democratic to Republican [ ] Douglas (largest city: Omaha )Lancaster (largest city: Lincoln )Saline (largest city: Crete )See also [ ] United States presidential elections in Nebraska Presidency of Barack Obama 2012 Republican Party presidential debates and forums 2012 Republican Party presidential primaries Results of the 2012 Republican Party presidential primaries Nebraska Republican Party References [ ] External links [ ]
State and district results of the 2012 United States presidential election
(← 2008 ) 2012 United States presidential election (2016 → )
Democratic Party
Candidates
Incumbent nominee: Barack Obama
campaign endorsements positions Incumbent VP nominee: Joe Biden
Challengers
Bob Ely Keith Judd Warren Mosler Vermin Supreme Randall Terry John Wolfe
Republican Party
Candidates
Nominee: Mitt Romney
campaign endorsements positions VP nominee: Paul Ryan
Other candidates
Michele Bachmann
campaign Herman Cain
campaign positions Mark Callahan Jack Fellure Newt Gingrich
campaign positions Stewart Greenleaf Jon Huntsman
campaign Gary Johnson
campaign Fred Karger Andy Martin Thaddeus McCotter
campaign Jimmy McMillan Roy Moore Ron Paul
campaign positions Tim Pawlenty
campaign Rick Perry
campaign positions Buddy Roemer
campaign Rick Santorum
campaign
Libertarian Party
Candidates
Nominee: Gary Johnson
VP nominee: Jim Gray Other candidates
Carl Person Sam Sloan R. Lee Wrights
Green Party
Candidates
Nominee: Jill Stein
VP nominee: Cheri Honkala Other candidates: Stewart Alexander Roseanne Barr
Other third-party and independent candidates
American Independent Party
Nominee: Tom Hoefling Other candidates: Wiley Drake
Virgil Goode
Edward C. Noonan Laurie Roth American Third Position Party
Nominee: Merlin Miller VP nominee: Virginia Abernethy Constitution Party
Convention Nominee: Virgil Goode
VP nominee: Jim Clymer Other candidates: Laurie Roth Robby Wells Freedom Socialist Party Grassroots Party Justice Party
Nominee: Rocky Anderson VP nominee: Luis J. Rodriguez Socialism and Liberation Peace and Freedom Party
Nominee: Roseanne Barr VP nominee: Cindy Sheehan Other candidates: Stewart Alexander Rocky Anderson Peta Lindsay Prohibition Party
Nominee: Jack Fellure Other candidates: James Hedges Reform Party
Nominee: Andre Barnett Other candidates: Laurence Kotlikoff Buddy Roemer
Robby Wells Socialist Equality Party Socialist Workers Party Socialist Party
Nominee: Stewart Alexander
VP nominee: Alejandro Mendoza Independents and others
Objectivist Party
Tom Stevens Independents
Lee Abramson Randy Blythe Jeff Boss Robert Burck Terry Jones Joe Schriner Michael Bloomberg
attempt to draft
Other 2012 elections :House Senate Gubernatorial
United States presidential primaries and caucuses
Election timelines National polling
Democratic Party
2008 2016 2020 Republican Party
2008 2012 2016 2020 State polling
Democratic Party
2004 2008 2016 2020 Republican Party
2008 2012 2016 2020 Fundraising Debates and forums
Democratic Party 2004 2008 2016 2020
debates forums Republican Party 2008 2012 2016 2020 Libertarian Party
2016 Green Party
2016 Straw polls Major events
Iowa caucuses New Hampshire primary Nevada caucuses South Carolina primary Super Tuesday Caucuses primaries
Democratic Party
1912 1916 1920 1924 1928 1932 1936 1940 1944 1948 1952 1956 1960 1964 1968 1972 1976 1980 1984 1988 1992 1996 2000 2004 2008 2012 2016 2020 Republican Party Libertarian Party Green Party Reform Party Constitution Party
Results breakdown National
Democratic Party
1832 1835 1840 1844 1848 1852 1856 1860 1864 1868 1872 1876 1880 1884 1888 1892 1896 1900 1904 1908 1912 1916 1920 1924 1928 1932 1936 1940 1944 1948 1952 1956 1960 1964 1968 1972 1976 1980 1984 1988 1992 1996 2000 2004 2008 2012 2016 2020 Republican Party Libertarian Party
1983 1987 1991 1996 2000 2004 2008 2010 2012 2014 2016 2020 Green Party Defunct
Whig Party Greenback Party Populist Party
1892 1896 1900 • 1904 • 1908 Progressive Party
Reforms