2012 United States presidential election in West Virginia
| ||||||||||||||||||||||||||
| ||||||||||||||||||||||||||
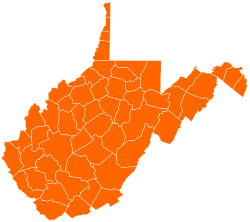
 County Results
Romney 50-60% 60-70% 70-80% 80-90%
| ||||||||||||||||||||||||||
| ||||||||||||||||||||||||||


| Elections in West Virginia |
|---|
 |
|
|
|
|
|
|
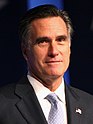
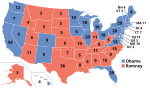
The 2012 United States presidential election in West Virginia took place on November 6, 2012, as part of the 2012 United States presidential election in which all 50 states plus the District of Columbia participated. West Virginia voters chose five electors to represent them in the Electoral College via a popular vote pitting incumbent Democratic President Barack Obama and his running mate, Vice President Joe Biden, against Republican challenger and former Massachusetts Governor Mitt Romney and his running mate, Congressman Paul Ryan.
Mitt Romney defeated Barack Obama in the state of West Virginia by a landslide 26.76-point margin. The Republican ticket took 62.30% of the vote to the Democratic ticket's 35.54%, sweeping every county in the state.[1] Romney became the first presidential candidate from any party since West Virginia's admission to the Union in 1863 to sweep every single county in the state and the first Republican candidate since Richard Nixon in 1972 to carry over 60% of the state's votes.[2] This represented a historic loss for the Democrats in West Virginia, which had been a Democratic stronghold from the New Deal up through the 1990s. The two subsequent presidential elections would also see the Democratic candidate fail to pick up a single county in the state.
With 62.14% of the popular vote, West Virginia would prove to be Romney's fifth strongest state in the 2012 election after Utah, Wyoming, Oklahoma and Idaho.[3] As of 2020, this is the last time the Democratic nominee has received more than 30% of the vote in the Mountain State. It was also the first time since 1948 that West Virginia voted to the right of neighboring Kentucky, and the last time it voted to the left of Utah, Idaho, or Oklahoma (or any state besides Wyoming) as of 2021.
Democratic primary[]
Barack Obama defeated Keith Judd, a convicted felon serving a federal prison sentence in Texarkana, TX, by a surprisingly narrow 59% to 41%.[4]
| |||||||||||||||||||
| |||||||||||||||||||
 West Virginia results by county
Barack Obama
Keith Judd | |||||||||||||||||||

Republican primary[]
| |||||||||||||||||||||||||||||||||||||||||
| |||||||||||||||||||||||||||||||||||||||||
 West Virginia results by county
Mitt Romney
(Note: Italicization indicates a withdrawn candidacy) | |||||||||||||||||||||||||||||||||||||||||

The Republican primary took place on May 8, 2012.[5][6]
| Candidate | Votes | Percentage | Projected delegate count | |
|---|---|---|---|---|
| CNN | GP | |||
| 78,197 | 69.56% | 24 | ||
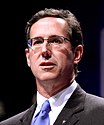
| Rick Santorum (withdrawn) | 13,590 | 12.09% | 2 | |
| Ron Paul | 12,412 | 11.04% | 0 | |
| Newt Gingrich (withdrawn) | 7,076 | 6.29% | 0 | |
| Buddy Roemer (withdrawn) | 1,141 | 1.01% | 0 | |
| Unprojected delegates | 31 | 5 | ||
| Total: | 112,416 | 100% | 31 | 31 |
Results by county[]
| County[8] | Mitt Romney | Ron Paul | Rick Santorum (withdrawn) |
Newt Gingrich (withdrawn) |
Buddy Roemer (withdrawn) |
|---|---|---|---|---|---|
| Barbour | 66.96% (983) | 9.20% (135) | 15.94% (234) | 7.49% (110) | 0.41% (6) |
| Berkeley | 69.31% (4366) | 14.92% (940) | 10.29% (648) | 4.84% (305) | 0.64% (40) |
| Boone | 70.28% (454) | 10.68% (69) | 14.55% (94) | 3.41% (22) | 1.08% (7) |
| Braxton | 68.44% (399) | 13.89% (81) | 12.35% (72) | 4.12% (24) | 1.20% (7) |
| Brooke | 69.46% (778) | 10.36% (116) | 15.09% (169) | 4.64% (52) | 0.45% (5) |
| Cabell | 69.09% (3351) | 12.60% (611) | 11.34% (550) | 5.77% (280) | 1.20% (58) |
| Calhoun | 66.78% (191) | 11.89% (34) | 12.24% (35) | 5.59% (16) | 3.50% (10) |
| Clay | 67.01% (262) | 10.49% (41) | 13.30% (52) | 7.42% (29) | 1.79% (7) |
| Doddridge | 67.36% (997) | 10.61% (157) | 12.23% (181) | 8.31% (123) | 1.49% (22) |
| Fayette | 66.54% (891) | 12.02% (161) | 12.70% (170) | 7.17% (96) | 1.57% (21) |
| Gilmer | 70.44% (255) | 7.73% (28) | 11.05% (40) | 9.94% (36) | 0.83% (3) |
| Grant | 78.16% (1403) | 6.07% (109) | 8.30% (149) | 6.35% (114) | 1.11% (20) |
| Greenbrier | 68.13% (1366) | 11.12% (223) | 13.12% (263) | 6.43% (129) | 1.20% (24) |
| Hampshire | 72.70% (1270) | 8.59% (150) | 12.08% (211) | 5.72% (100) | 0.92% (16) |
| Hancock | 70.04% (1302) | 11.62% (216) | 13.07% (243) | 3.98% (74) | 1.29% (24) |
| Hardy | 69.75% (611) | 8.22% (72) | 13.93% (122) | 6.62% (58) | 1.48% (13) |
| Harrison | 67.88% (2715) | 10.95% (438) | 12.03% (481) | 8.25% (330) | 0.90% (36) |
| Jackson | 65.87% (2030) | 11.36% (350) | 13.98% (431) | 7.66% (236) | 1.14% (35) |
| Jefferson | 67.98% (1771) | 16.08% (419) | 10.13% (264) | 4.99% (130) | 0.81% (21) |
| Kanawha | 71.73% (7295) | 11.62% (1182) | 10.55% (1073) | 5.18% (527) | 0.91% (93) |
| Lewis | 73.98% (1288) | 7.41% (129) | 10.17% (177) | 7.35% (128) | 1.09% (19) |
| Lincoln | 71.69% (504) | 8.53% (60) | 10.38% (73) | 7.54% (53) | 1.85% (13) |
| Logan | 67.71% (388) | 9.77% (56) | 15.01% (86) | 6.46% (37) | 1.05% (6) |
| Marion | 64.57% (1775) | 11.13% (306) | 15.61% (429) | 6.91% (190) | 1.78% (49) |
| Marshall | 71.67% (1687) | 8.54% (201) | 13.04% (307) | 5.82% (137) | 0.93% (22) |
| Mason | 66.04% (1641) | 11.11% (276) | 13.48% (335) | 7.69% (191) | 1.69% (42) |
| McDowell | 62.81% (152) | 12.81% (31) | 15.70% (38) | 8.26% (20) | 0.41% (1) |
| Mercer | 72.24% (1884) | 8.51% (222) | 12.08% (315) | 6.40% (167) | 0.77% (20) |
| Mineral | 70.54% (1722) | 10.00% (244) | 12.04% (294) | 6.72% (164) | 0.70% (17) |
| Mingo | 69.21% (272) | 7.63% (30) | 12.21% (48) | 8.91% (35) | 2.04% (8) |
| Monongalia | 66.40% (2826) | 14.14% (602) | 11.63% (495) | 6.72% (286) | 1.10% (47) |
| Monroe | 65.27% (671) | 12.55% (129) | 12.16% (125) | 8.46% (87) | 1.56% (16) |
| Morgan | 68.77% (1240) | 13.09% (236) | 11.09% (200) | 5.60% (101) | 1.44% (26) |
| Nicholas | 69.78% (875) | 9.81% (123) | 12.28% (154) | 7.10% (89) | 1.04% (13) |
| Ohio | 76.43% (2775) | 8.84% (321) | 10.52% (382) | 3.58% (130) | 0.63% (23) |
| Pendleton | 75.64% (354) | 7.26% (34) | 11.54% (54) | 4.70% (22) | 0.85% (4) |
| Pleasants | 66.26% (381) | 10.78% (62) | 16.70% (96) | 5.57% (32) | 0.70% (4) |
| Pocahontas | 63.05% (558) | 14.01% (124) | 13.56% (120) | 8.47% (75) | 0.90% (8) |
| Preston | 66.95% (2032) | 10.48% (318) | 15.32% (465) | 6.39% (194) | 0.86% (26) |
| Putnam | 70.34% (3891) | 11.26% (623) | 12.26% (678) | 5.28% (292) | 0.87% (48) |
| Raleigh | 73.23% (2992) | 7.73% (316) | 11.75% (480) | 6.78% (277) | 0.51% (21) |
| Randolph | 68.43% (969) | 9.25% (131) | 13.14% (186) | 7.84% (111) | 1.34% (19) |
| Ritchie | 65.27% (1000) | 13.97% (214) | 12.01% (184) | 7.18% (110) | 1.57% (24) |
| Roane | 69.95% (866) | 9.94% (123) | 11.31% (140) | 7.43% (92) | 1.37% (17) |
| Summers | 67.24% (388) | 10.40% (60) | 11.96% (69) | 9.01% (52) | 1.39% (8) |
| Taylor | 67.82% (784) | 11.76% (136) | 12.63% (146) | 7.44% (86) | 0.35% (4) |
| Tucker | 69.29% (422) | 11.33% (69) | 9.85% (60) | 9.03% (55) | 0.49% (3) |
| Tyler | 68.46% (675) | 11.76% (116) | 11.97% (118) | 6.39% (63) | 1.42% (14) |
| Upshur | 69.12% (2344) | 9.20% (312) | 13.65% (463) | 6.69% (227) | 1.33% (45) |
| Wayne | 66.79% (1076) | 10.12% (163) | 14.65% (236) | 7.76% (125) | 0.68% (11) |
| Webster | 64.65% (139) | 10.70% (23) | 15.35% (33) | 6.98% (15) | 2.33% (5) |
| Wetzel | 69.53% (566) | 8.35% (68) | 16.46% (134) | 5.28% (43) | 0.37% (3) |
| Wirt | 63.00% (332) | 11.57% (61) | 16.32% (86) | 8.92% (47) | 0.19% (1) |
| Wood | 70.20% (5422) | 11.64% (899) | 10.72% (828) | 6.42% (496) | 1.02% (79) |
| Wyoming | 75.58% (616) | 7.61% (62) | 9.08% (74) | 6.87% (56) | 0.86% (7) |
General election[]
Results[]
| 2012 United States presidential election in West Virginia[9] | |||||||||
|---|---|---|---|---|---|---|---|---|---|
| Party | Candidate | Running mate | Popular vote | Electoral vote | Swing | ||||
| Count | % | Count | % | ||||||
| Republican | Mitt Romney of Massachusetts | Paul Ryan of Wisconsin | 417,655 | 62.30% | 5 | 100.00% | |||
| Democratic | Barack Obama of Illinois | Joe Biden of Delaware | 238,269 | 35.54% | 0 | 0.00% | |||
| Libertarian | Gary Johnson of New Mexico | James P. Gray of California | 6,302 | 0.94% | 0 | 0.00% | |||
| Mountain | Jill Stein of Massachusetts | Cheri Honkala of Pennsylvania | 4,406 | 0.66% | 0 | 0.00% | |||
| Independent | Randall Terry of West Virginia | N/A of N/A | 3,806 | 0.57% | 0 | 0.00% | |||
| Write-in | Various of Various | Various of Various | 1,502 | 0.22% | 0 | 0.00% | |||
| Constitution | Virgil Goode (write-in) of Virginia | Jim Clymer of Pennsylvania | 119 | 0.02% | 0 | 0.00% | |||
| Peace and Freedom | Roseanne Barr (write-in) of Hawaii | Cindy Sheehan of California | 31 | 0.00% | 0 | 0.00% | |||
| Justice | Rocky Anderson (write-in) of Utah | Luis J. Rodriguez of California | 12 | 0.00% | 0 | 0.00% | |||
| American Third Position | Merlin Miller (write-in) of Iowa | Virginia Abernethy of Arizona | 12 | 0.00% | 0 | 0.00% | |||
| American Independent | Tom Hoefling (write-in) of Iowa | Robert Ornelas of California | 5 | 0.00% | 0 | 0.00% | |||
| Independent | Richard Duncan (write-in) of - | - of - | 1 | 0.00% | 0 | 0.00% | |||
| Total | 670,438 | 100.00% | 5 | 100.00% | |||||
By county[]
| County | Obama% | Obama# | Romney% | Romney# | Others% | Others# | Total |
|---|---|---|---|---|---|---|---|
| Barbour | 30.69% | 1,768 | 66.38% | 3,824 | 2.93% | 169 | 5,761 |
| Berkeley | 38.40% | 14,275 | 59.60% | 22,156 | 1.99% | 741 | 37,172 |
| Boone | 32.82% | 2,790 | 64.32% | 5,467 | 2.86% | 243 | 8,500 |
| Braxton | 41.59% | 1,998 | 56.72% | 2,725 | 1.69% | 81 | 4,804 |
| Brooke | 43.09% | 4,005 | 54.44% | 5,060 | 2.46% | 229 | 9,294 |
| Cabell | 42.21% | 13,568 | 55.95% | 17,985 | 1.84% | 591 | 32,144 |
| Calhoun | 37.06% | 818 | 59.76% | 1,319 | 3.17% | 70 | 2,207 |
| Clay | 30.91% | 931 | 65.44% | 1,971 | 3.65% | 110 | 3,012 |
| Doddridge | 20.77% | 575 | 76.92% | 2,130 | 2.31% | 64 | 2,769 |
| Fayette | 38.51% | 5,419 | 59.35% | 8,350 | 2.14% | 301 | 14,070 |
| Gilmer | 33.48% | 840 | 63.57% | 1,595 | 2.95% | 74 | 2,509 |
| Grant | 15.66% | 718 | 82.49% | 3,783 | 1.85% | 85 | 4,586 |
| Greenbrier | 36.33% | 4,710 | 61.17% | 7,930 | 2.49% | 323 | 12,963 |
| Hampshire | 28.79% | 2,299 | 69.16% | 5,523 | 2.05% | 164 | 7,986 |
| Hancock | 38.18% | 4,627 | 59.63% | 7,226 | 2.19% | 265 | 12,118 |
| Hardy | 28.68% | 1,482 | 68.42% | 3,536 | 2.90% | 150 | 5,168 |
| Harrison | 37.22% | 9,732 | 60.72% | 15,876 | 2.06% | 539 | 26,147 |
| Jackson | 33.39% | 3,854 | 64.17% | 7,408 | 2.44% | 282 | 11,544 |
| Jefferson | 46.97% | 10,398 | 50.85% | 11,258 | 2.18% | 482 | 22,138 |
| Kanawha | 43.26% | 32,480 | 55.10% | 41,364 | 1.64% | 1,233 | 75,077 |
| Lewis | 27.61% | 1,736 | 69.59% | 4,375 | 2.80% | 176 | 6,287 |
| Lincoln | 32.66% | 2,227 | 64.29% | 4,383 | 3.05% | 208 | 6,818 |
| Logan | 29.04% | 3,469 | 68.83% | 8,222 | 2.13% | 255 | 11,946 |
| Marion | 41.59% | 8,959 | 55.96% | 12,054 | 2.46% | 529 | 21,542 |
| Marshall | 34.72% | 4,484 | 62.98% | 8,135 | 2.30% | 297 | 12,916 |
| Mason | 38.59% | 3,778 | 58.65% | 5,741 | 2.76% | 270 | 9,789 |
| McDowell | 34.08% | 2,109 | 63.98% | 3,959 | 1.94% | 120 | 6,188 |
| Mercer | 25.53% | 5,432 | 72.62% | 15,450 | 1.85% | 394 | 21,276 |
| Mineral | 26.28% | 2,885 | 71.35% | 7,833 | 2.38% | 261 | 10,979 |
| Mingo | 27.50% | 2,428 | 70.11% | 6,191 | 2.39% | 211 | 8,830 |
| Monongalia | 43.93% | 13,826 | 53.47% | 16,831 | 2.60% | 818 | 31,475 |
| Monroe | 27.92% | 1,455 | 69.38% | 3,616 | 2.71% | 141 | 5,212 |
| Morgan | 33.55% | 2,363 | 64.07% | 4,513 | 2.39% | 168 | 7,044 |
| Nicholas | 30.32% | 2,664 | 67.14% | 5,898 | 2.54% | 223 | 8,785 |
| Ohio | 37.89% | 6,786 | 60.12% | 10,768 | 1.99% | 357 | 17,911 |
| Pendleton | 33.16% | 1,074 | 64.68% | 2,095 | 2.16% | 70 | 3,239 |
| Pleasants | 33.63% | 955 | 64.26% | 1,825 | 2.11% | 60 | 2,840 |
| Pocahontas | 36.44% | 1,303 | 61.02% | 2,182 | 2.54% | 91 | 3,576 |
| Preston | 26.28% | 2,931 | 70.72% | 7,889 | 3.0% | 335 | 11,155 |
| Putnam | 30.65% | 7,256 | 67.72% | 16,032 | 1.63% | 385 | 23,673 |
| Raleigh | 26.84% | 7,739 | 71.50% | 20,614 | 1.65% | 476 | 28,829 |
| Randolph | 34.26% | 3,342 | 63.15% | 6,160 | 2.58% | 252 | 9,754 |
| Ritchie | 20.27% | 768 | 77.11% | 2,921 | 2.61% | 99 | 3,788 |
| Roane | 38.42% | 1,939 | 59.08% | 2,982 | 2.50% | 126 | 5,047 |
| Summers | 34.23% | 1,621 | 62.96% | 2,981 | 2.81% | 133 | 4,735 |
| Taylor | 32.85% | 1,941 | 65.00% | 3,840 | 2.15% | 127 | 5,908 |
| Tucker | 28.04% | 880 | 69.34% | 2,176 | 2.61% | 82 | 3,138 |
| Tyler | 27.14% | 890 | 70.57% | 2,314 | 2.29% | 75 | 3,279 |
| Upshur | 26.08% | 2,158 | 71.79% | 5,939 | 2.13% | 176 | 8,273 |
| Wayne | 35.34% | 4,931 | 62.26% | 8,688 | 2.41% | 336 | 13,955 |
| Webster | 34.37% | 947 | 62.07% | 1,710 | 3.56% | 98 | 2,755 |
| Wetzel | 37.86% | 2,217 | 59.31% | 3,473 | 2.83% | 166 | 5,856 |
| Wirt | 31.14% | 676 | 65.73% | 1,427 | 3.13% | 68 | 2,171 |
| Wood | 33.05% | 11,230 | 65.29% | 22,183 | 1.66% | 564 | 33,977 |
| Wyoming | 21.04% | 1,583 | 76.68% | 5,769 | 2.27% | 171 | 7,523 |
Counties that flipped from Democratic to Republican[]
- Boone (largest city: Madison)
- Braxton (largest town: Sutton)
- Jefferson (largest city: Charles Town)
- Marion (largest city: Fairmont)
- McDowell (largest city: Welch)
- Monongalia (largest city: Morgantown)
- Webster (largest town: Webster Springs)
See also[]
- Republican Party presidential debates, 2012
- Republican Party presidential primaries, 2012
- Results of the 2012 Republican Party presidential primaries
- United States presidential election in Virginia, 2012
References[]
- ^ "WV Secretary of State". Retrieved January 3, 2013.
- ^ Thomas, G. Scott; The Pursuit of the White House: A Handbook of Presidential Election Statistics and History, pp. 459-460 ISBN 0313257957
- ^ "2012 Presidential Election Statistics". Dave Leip's Atlas of U.S. Presidential Elections. Retrieved 2018-03-05.
- ^ http://www.cbsnews.com/8301-503544_162-57430719-503544/4-in-10-choose-convict-over-obama-in-w.va-primary/
- ^ "Primary and Caucus Printable Calendar". CNN. Retrieved January 12, 2012.
- ^ "Presidential Primary Dates" (PDF). Federal Election Commission. Retrieved January 23, 2012.
- ^ Secretary of State official results
- ^ "WV SOS Election Results Center". May 8, 2012. Retrieved August 29, 2012.
- ^ https://uselectionatlas.org/RESULTS/state.php?year=2012&fips=54&off=0&elect=0&f=0
External links[]
- The Green Papers: for West Virginia
- The Green Papers: Major state elections in chronological order
State and district results of the 2012 United States presidential election | ||
|---|---|---|
|  | |
- United States presidential elections in West Virginia
- 2012 West Virginia elections
- 2012 United States presidential election by state