2016 United States presidential election in West Virginia
| ||||||||||||||||||||||||||
| Turnout | 57.45%[1] | |||||||||||||||||||||||||
|---|---|---|---|---|---|---|---|---|---|---|---|---|---|---|---|---|---|---|---|---|---|---|---|---|---|---|
| ||||||||||||||||||||||||||
 County Results
Trump 50–60% 60–70% 70–80% 80–90%
| ||||||||||||||||||||||||||
| ||||||||||||||||||||||||||


| Elections in West Virginia |
|---|
 |
|
|
|
|
|
|
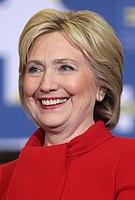
The 2016 United States presidential election in West Virginia was held on November 8, 2016, as part of the 2016 General Election in which all 50 states plus the District of Columbia participated. West Virginia voters chose electors to represent them in the Electoral College via a popular vote pitting the Republican Party's nominee, businessman Donald Trump, and running mate Indiana Governor Mike Pence against Democratic Party nominee, former Secretary of State Hillary Clinton and her running mate, Virginia Senator Tim Kaine.
On May 10, 2016, in the presidential primaries, West Virginia voters expressed their preferences for the Democratic, Republican, Green, and Libertarian parties' respective nominees for president. Registered members of each party only voted in their party's primary, while voters who were unaffiliated chose any one primary in which to vote.
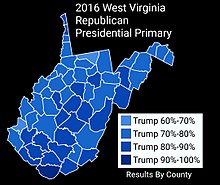
Donald Trump won West Virginia with 68.5% of the vote, his largest share of the vote in any state. Hillary Clinton received just over a quarter of the vote, with 26.4%. Trump's performance in the state made it his strongest state in the 2016 election by total vote share.[2]
West Virginia was also one of two states where Donald Trump won every county, the other being Oklahoma. This was the second consecutive presidential election where every county within the state voted Republican. Trump's 42.2% margin of victory is the largest of any presidential candidate from either party in the state's history, besting Abraham Lincoln's 36.4% margin of victory in 1864. Hillary Clinton's performance was the worst by a major party nominee since 1912, when three candidates split the vote and received over 20% of the vote each, and, as of the 2020 election, remains the worst performance ever by a Democrat in West Virginia.
Primary elections[]
Democratic primary[]

Six candidates appeared on the Democratic presidential primary ballot:[3] (alphabetically)
- Hillary Clinton
- Rocky De La Fuente
- Paul T. Farrell Jr.
- Martin O'Malley (withdrawn)
- Keith Judd
- Bernie Sanders
| West Virginia Democratic primary, May 10, 2016 | |||||
|---|---|---|---|---|---|
| Candidate | Popular vote | Delegates | |||
| Count | Percentage | Pledged | Unpledged | Total | |
| Bernie Sanders | 124,700 | 51.41% | 18 | 18 | |
| Hillary Clinton | 86,914 | 35.84% | 11 | 8 | 19 |
| Paul T. Farrell Jr. | 21,694 | 8.94% | |||
| Keith Judd | 4,460 | 1.84% | |||
| Martin O'Malley (withdrawn) | 3,796 | 1.57% | |||
| Rocky De La Fuente | 975 | 0.40% | |||
| Uncommitted | N/A | 0 | 0 | 0 | |
| Total | 242,539 | 100% | 29 | 8 | 37 |
| Source: The Green Papers, West Virginia Secretary of State | |||||
Republican primary[]
Eleven candidates appeared on the Republican presidential primary ballot:[3]
- Jeb Bush (withdrawn)
- Ben Carson (withdrawn)
- Chris Christie (withdrawn)
- Ted Cruz (withdrawn)
- Carly Fiorina (withdrawn)
- Mike Huckabee (withdrawn)
- John Kasich (withdrawn)
- Rand Paul (withdrawn)
- Marco Rubio (withdrawn)
- Donald Trump
| Candidate | Votes | Percentage | Actual delegate count | ||
|---|---|---|---|---|---|
| Bound | Unbound | Total | |||
| Donald Trump | 157,238 | 77.05% | 32 | 0 | 32 |
| Ted Cruz (withdrawn) | 18,301 | 8.97% | 0 | 0 | 0 |
| John Kasich (withdrawn) | 13,721 | 6.72% | 1 | 0 | 1 |
| Ben Carson (withdrawn) | 4,421 | 2.17% | 0 | 0 | 0 |
| Marco Rubio (withdrawn) | 2,908 | 1.43% | 0 | 0 | 0 |
| Jeb Bush (withdrawn) | 2,305 | 1.13% | 0 | 0 | 0 |
| Rand Paul (withdrawn) | 1,798 | 0.88% | 0 | 0 | 0 |
| Mike Huckabee (withdrawn) | 1,780 | 0.87% | 0 | 0 | 0 |
| Chris Christie (withdrawn) | 727 | 0.36% | 0 | 0 | 0 |
| Carly Fiorina (withdrawn) | 659 | 0.32% | 0 | 0 | 0 |
| David Eames Hall | 203 | 0.10% | 0 | 0 | 0 |
| Uncommitted | 1 | 0 | 1 | ||
| Unprojected delegates: | 0 | 0 | 0 | ||
| Total: | 204,061 | 100.00% | 34 | 0 | 34 |
| Source: The Green Papers | |||||
Polling[]
Analysis[]
As expected, Republican nominee Donald Trump won West Virginia in a 42-point rout (the largest of any presidential candidate in the state's history) over Democratic nominee Hillary Clinton,[4] thanks to ardent support from coal industry workers in Appalachia. He thus captured all five electoral votes from the Mountain State. Trump had promised to bring back mining jobs in economically depressed areas of coal country, whereas his opponent had proposed investing millions into converting the region to a producer of green energy.[5][6] Democrats' championing of environmentalism is viewed as a threat in coal country, and Clinton faced a towering rejection from Mountain State voters. Clinton was also seen as being "haunted" by a comment she made within the state itself, in which in describing the transition to clean energy she stated "We’re going to put a lot of coal miners and coal companies out of business."[7]
West Virginia was once a solidly Democratic state; it voted Democratic in every election from 1932 to 1996, except for the Republican landslides of 1956, 1972, and 1984. However, in recent years it has drifted to becoming solidly Republican, and has stayed that way since it was won by George W. Bush in 2000. Barack Obama, for example, failed to win even a single county in 2012. West Virginia is one of the two states where Hillary Clinton did not win any counties, the other being Oklahoma, which last voted for a Democrat in 1964.[8]
General election[]
Predictions[]
| Source | Ranking | As of |
|---|---|---|
| Los Angeles Times[9] | Safe R | November 6, 2016 |
| CNN[10] | Safe R | November 4, 2016 |
| Cook Political Report[11] | Safe R | November 7, 2016 |
| Electoral-vote.com[12] | Safe R | November 8, 2016 |
| Rothenberg Political Report[13] | Safe R | November 7, 2016 |
| Sabato's Crystal Ball[14] | Safe R | November 7, 2016 |
| RealClearPolitics[15] | Safe R | November 8, 2016 |
| Fox News[16] | Safe R | November 7, 2016 |
Statewide results[]
Chart of popular vote
| 2016 United States presidential election in West Virginia[17] | |||||||||
|---|---|---|---|---|---|---|---|---|---|
| Party | Candidate | Running mate | Popular vote | Electoral vote | Swing | ||||
| Count | % | Count | % | ||||||
| Republican | Donald Trump of New York | Mike Pence of Indiana | 489,371 | 68.50% | 5 | 100.00% | |||
| Democratic | Hillary Clinton of New York | Tim Kaine of Virginia | 188,794 | 26.43% | 0 | 0.00% | |||
| Libertarian | Gary Johnson of New Mexico | Bill Weld of Massachusetts | 23,004 | 3.22% | 0 | 0.00% | |||
| Mountain | Jill Stein of Massachusetts | Ajamu Baraka of Illinois | 8,075 | 1.13% | 0 | 0.00% | |||
| Constitution | Darrell Castle of Tennessee | Scott Bradley of Utah | 3,807 | 0.53% | 0 | 0.00% | |||
| Total | 714,423 | 100.00% | 5 | 100.00% | |||||
By congressional district[]
Trump won all three congressional districts.[18]
| District | Trump | Clinton | Representative |
|---|---|---|---|
| 1st | 68% | 26% | David McKinley |
| 2nd | 66% | 29% | Alex Mooney |
| 3rd | 73% | 23% | Evan Jenkins |
By county[]
| County | Clinton% | Clinton# | Trump% | Trump# | Others% | Others# | Total |
|---|---|---|---|---|---|---|---|
| Barbour | 20.19% | 1,222 | 74.78% | 4,527 | 5.04% | 305 | 6,054 |
| Berkeley | 28.75% | 12,321 | 65.91% | 28,244 | 5.33% | 2,285 | 42,850 |
| Boone | 20.61% | 1,790 | 74.90% | 6,504 | 4.48% | 389 | 8,683 |
| Braxton | 25.95% | 1,321 | 69.49% | 3,537 | 4.56% | 232 | 5,090 |
| Brooke | 26.71% | 2,568 | 68.92% | 6,625 | 4.37% | 420 | 9,613 |
| Cabell | 34.60% | 11,447 | 60.00% | 19,850 | 5.40% | 1,788 | 33,085 |
| Calhoun | 17.42% | 456 | 77.76% | 2,035 | 4.81% | 126 | 2,617 |
| Clay | 19.11% | 568 | 77.39% | 2,300 | 3.50% | 104 | 2,972 |
| Doddridge | 12.75% | 362 | 83.03% | 2,358 | 4.23% | 120 | 2,840 |
| Fayette | 27.97% | 4,290 | 67.53% | 10,357 | 4.50% | 690 | 15,337 |
| Gilmer | 21.43% | 545 | 74.56% | 1,896 | 4.01% | 102 | 2,543 |
| Grant | 10.33% | 512 | 87.69% | 4,346 | 1.98% | 98 | 4,956 |
| Greenbrier | 26.77% | 3,765 | 67.94% | 9,556 | 5.30% | 745 | 14,066 |
| Hampshire | 18.36% | 1,580 | 77.74% | 6,692 | 3.90% | 336 | 8,608 |
| Hancock | 25.68% | 3,262 | 70.14% | 8,909 | 4.18% | 531 | 12,702 |
| Hardy | 20.47% | 1,155 | 75.74% | 4,274 | 3.79% | 214 | 5,643 |
| Harrison | 27.52% | 7,694 | 67.06% | 18,750 | 5.42% | 1,516 | 27,960 |
| Jackson | 21.85% | 2,663 | 74.01% | 9,020 | 4.14% | 504 | 12,187 |
| Jefferson | 39.42% | 9,518 | 54.68% | 13,204 | 5.90% | 1,425 | 24,147 |
| Kanawha | 37.34% | 28,263 | 57.93% | 43,850 | 4.73% | 3,577 | 75,690 |
| Lewis | 19.44% | 1,347 | 76.13% | 5,274 | 4.43% | 307 | 6,928 |
| Lincoln | 20.65% | 1,459 | 75.11% | 5,307 | 4.25% | 300 | 7,066 |
| Logan | 16.93% | 2,092 | 80.08% | 9,897 | 2.99% | 370 | 12,359 |
| Marion | 30.24% | 6,964 | 63.69% | 14,668 | 6.07% | 1,397 | 23,029 |
| Marshall | 22.08% | 2,918 | 73.14% | 9,666 | 4.78% | 632 | 13,216 |
| Mason | 20.43% | 2,081 | 75.14% | 7,654 | 4.43% | 451 | 10,186 |
| McDowell | 23.18% | 1,438 | 74.63% | 4,629 | 2.19% | 136 | 6,203 |
| Mercer | 20.47% | 4,704 | 75.73% | 17,404 | 3.80% | 874 | 22,982 |
| Mineral | 17.73% | 2,050 | 78.43% | 9,070 | 3.84% | 444 | 11,564 |
| Mingo | 14.41% | 1,370 | 83.19% | 7,911 | 2.41% | 229 | 9,510 |
| Monongalia | 40.78% | 14,699 | 51.13% | 18,432 | 8.09% | 2,917 | 36,048 |
| Monroe | 19.14% | 1,111 | 76.54% | 4,443 | 4.32% | 251 | 5,805 |
| Morgan | 20.55% | 1,573 | 74.89% | 5,732 | 4.56% | 349 | 7,654 |
| Nicholas | 19.39% | 1,840 | 76.40% | 7,251 | 4.21% | 400 | 9,491 |
| Ohio | 30.62% | 5,493 | 62.10% | 11,139 | 7.28% | 1,306 | 17,938 |
| Pendleton | 22.60% | 729 | 74.36% | 2,398 | 3.04% | 98 | 3,225 |
| Pleasants | 19.71% | 621 | 74.86% | 2,358 | 5.43% | 171 | 3,150 |
| Pocahontas | 25.45% | 928 | 68.46% | 2,496 | 6.09% | 222 | 3,646 |
| Preston | 19.51% | 2,470 | 75.35% | 9,538 | 5.14% | 651 | 12,659 |
| Putnam | 23.64% | 5,884 | 71.46% | 17,788 | 4.90% | 1,221 | 24,893 |
| Raleigh | 21.75% | 6,443 | 74.44% | 22,048 | 3.81% | 1,127 | 29,618 |
| Randolph | 25.15% | 2,735 | 70.15% | 7,629 | 4.71% | 512 | 10,876 |
| Ritchie | 12.17% | 496 | 83.56% | 3,405 | 4.27% | 174 | 4,075 |
| Roane | 23.29% | 1,222 | 72.06% | 3,781 | 4.65% | 244 | 5,247 |
| Summers | 24.48% | 1,190 | 71.06% | 3,455 | 4.46% | 217 | 4,862 |
| Taylor | 22.81% | 1,491 | 72.39% | 4,733 | 4.80% | 314 | 6,538 |
| Tucker | 21.61% | 751 | 73.81% | 2,565 | 4.58% | 159 | 3,475 |
| Tyler | 13.88% | 507 | 81.99% | 2,996 | 4.13% | 151 | 3,654 |
| Upshur | 19.16% | 1,766 | 75.99% | 7,005 | 4.85% | 447 | 9,218 |
| Wayne | 22.11% | 3,357 | 73.46% | 11,152 | 4.43% | 673 | 15,182 |
| Webster | 18.67% | 556 | 77.30% | 2,302 | 4.03% | 120 | 2,978 |
| Wetzel | 21.69% | 1,359 | 72.13% | 4,519 | 6.18% | 387 | 6,265 |
| Wirt | 15.94% | 386 | 78.90% | 1,911 | 5.16% | 125 | 2,422 |
| Wood | 23.59% | 8,400 | 71.41% | 25,434 | 5.0% | 1,781 | 35,615 |
| Wyoming | 13.56% | 1,062 | 83.60% | 6,547 | 2.83% | 222 | 7,831 |
See also[]
- Democratic Party presidential debates, 2016
- Democratic Party presidential primaries, 2016
- Republican Party presidential debates, 2016
- Republican Party presidential primaries, 2016
References[]
- ^ "2016 General Election Turnout". www.sos.wv.gov. Archived from the original on 13 July 2017. Retrieved 28 June 2019.
- ^ "FEDERAL ELECTIONS 2016--Election Results for the U.S. President, the U.S. Senate and the U.S. House of Representatives" (PDF). Retrieved November 18, 2020.
- ^ a b "West Virginia Presidential Primary Ballots Set | Ballot Access News".
- ^ "West Virginia Election Results 2016". The New York Times. Retrieved 2016-11-12.
- ^ "Deep in Virginia's craggy coal country, they saw Trump as their only hope". Washington Post. Retrieved 2016-11-12.
- ^ Thomas, Zoe (2016-11-02). "Coal country West Virginia feels forgotten by politics". BBC News. Retrieved 2016-11-12.
- ^ Strauss, Daniel (May 10, 2016). "Clinton haunted by coal country comment". Politico. Retrieved June 3, 2017.
- ^ "West Virginia Election Results 2016 – The New York Times". The New York Times. Retrieved November 10, 2016.
- ^ "Our final map has Clinton winning with 352 electoral votes. Compare your picks with ours". Los Angeles Times. 2016-11-06. Retrieved 2016-11-13.
- ^ Chalian, David (November 4, 2016). "Road to 270: CNN's new election map". CNN. Retrieved March 3, 2019.
- ^ "2016 Electoral Scorecard". The Cook Political Report. November 7, 2016. Retrieved March 3, 2019.
- ^ "2016 Electoral Map Prediction". Electoral-vote.com. November 8, 2016. Retrieved March 3, 2019.
- ^ "Presidential Ratings". The Rothenberg Political Report. Retrieved August 16, 2021.
- ^ Sabato, Larry J. (November 7, 2016). "2016 President". University of Virginia Center for Politics. Retrieved March 3, 2019.
- ^ "2016 Election Maps - Battle for White House". RealClearPolitics. Retrieved 2016-11-13.
- ^ "Electoral Scorecard: Map shifts again in Trump's favor, as Clinton holds edge". Fox News. 2016-11-07. Retrieved 2016-11-13.
- ^ "Election and voting information" (PDF).
- ^ "Introducing the 2017 Cook Political Report Partisan Voter Index".
State and district results of the 2016 United States presidential election | ||
|---|---|---|
|  | |
- 2016 United States presidential election by state
- United States presidential elections in West Virginia
- 2016 West Virginia elections