The 2016 United States presidential election in New Hampshire was held on Tuesday, November 8, 2016, as part of the 2016 United States presidential election in which all 50 states plus the District of Columbia participated. New Hampshire voters chose electors to represent them in the Electoral College via a popular vote, pitting the Republican Party's nominee, businessman Donald Trump, and running mate Indiana GovernorMike Pence against Democratic Party nominee, former Secretary of StateHillary Clinton, and her running mate Virginia SenatorTim Kaine. New Hampshire has four electoral votes in the Electoral College.[1]
Clinton won the state with 47.62% of the vote, while Trump lost with 47.25%, by a 0.4% margin or by 2736 votes. This marked the second-closest margin percentage in the presidential election, behind only Michigan. As of 2020, this is the most recent election in which a Republican won Carroll, Hillsborough, Rockingham, and Sullivan Counties, as well as the last time New Hampshire voted more Republican than the nation as a whole.
As per tradition and by New Hampshire electoral laws,[2] New Hampshire holds the primaries before any other state. As a result, candidates for nomination usually spend a long period campaigning in New Hampshire.
Democratic primary[]
Main article: 2016 New Hampshire Democratic primary
2016 New Hampshire Democratic presidential primary
← 2012
February 9, 2016 (2016-02-09)
2020 →
Candidate
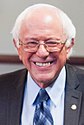
Bernie Sanders
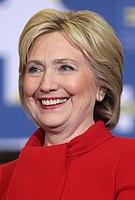
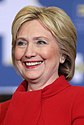
Hillary Clinton
Home state
Vermont
New York
Delegate count
15
9
Popular vote
152,193
95,355
Percentage
60.14%
37.68%
New Hampshire results by county
Bernie Sanders
Former Secretary of State Hillary Clinton at a campaign event in Manchester
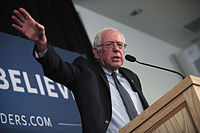
Senator Bernie Sanders at a campaign event in Hooksett
In the New Hampshire Democratic primary taking place on February 9, 2016, there were 24 pledged delegates and 8 super delegates that went to the Democratic National Convention. The pledged electors were allocated in this way. 16 delegates were allocated proportionally by congressional district (8 delegates per district). The other 8 delegates were allocated based on the statewide popular vote.[3]
This section should include a summary of New Hampshire Democratic primary, 2016. See Wikipedia:Summary style for information on how to incorporate it into this article's main text.(July 2016)
Results[]
New Hampshire Democratic primary, February 9, 2016
2016 New Hampshire Republican presidential primary
← 2012
February 9, 2016 (2016-02-09)
2020 →
Candidate
Donald Trump
John Kasich
Ted Cruz
Home state
New York
Ohio
Texas
Delegate count
11
4
3
Popular vote
100,735
44,932
33,244
Percentage
35.23%
15.72%
11.63%
Candidate
Jeb Bush
Marco Rubio
Chris Christie
Home state
Florida
Florida
New Jersey
Delegate count
3
2
0
Popular vote
31,341
30,071
21,089
Percentage
10.96%
10.52%
7.38%
New Hampshire results by county
Donald Trump
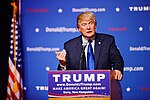
Businessman Donald Trump at a campaign event in Derry
Senator Marco Rubio at a campaign event in Manchester
Senator Ted Cruz at a campaign event in Manchester
Governor John Kasich at a campaign event in Nashua
Main article: 2016 New Hampshire Republican presidential primary
The New Hampshire Republican primary took place on February 9, 2016, where there were 23 bound delegates which were allocated proportionally and a candidate has to get at least 10% of the vote to get any delegates to the Republican National Convention.[7]
This section should include a summary of New Hampshire Republican primary, 2016. See Wikipedia:Summary style for information on how to incorporate it into this article's main text.(July 2016)
Results[]
New Hampshire Republican primary, February 9, 2016
See also: Statewide opinion polling for the United States presidential election, 2016 § New Hampshire
Up until late October 2016, Democrat Hillary Clinton won almost every pre-election poll. On November 1, just one week before the election, Republican Donald Trump won a poll for the first time, 44% to 42%. In the final week, Trump won 4 polls to Clinton's 2 and one tie. The final poll showed a 45% to 44% lead for Clinton, which was accurate compared to the results.[16] The average of the final 3 polls showed Clinton up 45% to 42%.[17]
Hillary Clinton's margin of victory was the smallest for a Democrat in the state since Woodrow Wilson narrowly won it in 1916. New Hampshire last voted for a Republican, George W. Bush, in 2000, and although Trump did not win New Hampshire, the top-line county results were exactly the same in 2000 and 2016. Despite Trump's narrow loss, this would be the first and only presidential election since 2000 where New Hampshire would vote more Republican than the national average, when the Republican candidate won more of the state's counties, along with the first time since 1976 when the winner of Coos County did not also carry the state as well. Coincidentally, New Hampshire voted as Republican in 2016 as it did Democratic in 2012 and 2020 in comparison to the rest of the nation.
Allegations of voting irregularities[]
On September 7, 2017, state House speaker Shawn Jasper announced that data showed that 6,540 people voted using out-of-state licenses. Of those, only 15% had received state licenses by August 2017. Of the remaining 5,526, only 3.3% had registered a motor vehicle in New Hampshire. In addition to the close vote for president, Democratic Governor Maggie Hassan defeated incumbent Republican Senator Kelly Ayotte by 1,017 votes. In February 2017, President Trump had told a gathering of senators at the White House that fraudulent out-of-state voting had cost him and Ayotte the election in New Hampshire. Mainstream media disputed Trump's and Jasper's assertion.[20] New Hampshire law permits New Hampshire residents to vote using out-of-state identification if they are domiciled in the state, out-of-state college students attending schools in New Hampshire being one example of such legitimate use of out-of-state identification.[21]
Several investigations by New Hampshire's Ballot Law Commission found no evidence of widespread fraud, and only 4 instances of fraud total in the state for the 2016 elections.[22] Specifically addressing the claim of people being bussed in from out of state to vote, Associate Attorney General Anne Edwards noted that they found no evidence for such claims. When they investigated these claims, they found that the buses were chartered out of state, but the voters on the buses lived in New Hampshire and could legally vote there.[23]
See also[]
Presidency of Donald Trump
United States presidential elections in New Hampshire
2016 Democratic Party presidential debates and forums
2016 Democratic Party presidential primaries
2016 Republican Party presidential debates and forums
2016 Republican Party presidential primaries
Notes[]
^The write-ins include 3,248 votes for these 11 Republican presidential candidates: Trump (1795), Kasich (438), Jeb Bush (263), Christie (216), Marco Rubio (203), Ted Cruz (162), Fiorina (99), Carson (52), Paul (12), Gilmore (6), Huckabee (2).[4]