2019 Plymouth City Council election
| |||||||||||||||||||||||||||||||||||||||||||||
19 of the 57 seats to Plymouth City Council 29 seats needed for a majority | |||||||||||||||||||||||||||||||||||||||||||||
|---|---|---|---|---|---|---|---|---|---|---|---|---|---|---|---|---|---|---|---|---|---|---|---|---|---|---|---|---|---|---|---|---|---|---|---|---|---|---|---|---|---|---|---|---|---|
| |||||||||||||||||||||||||||||||||||||||||||||
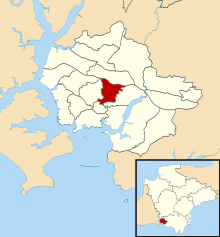
 Map showing the results of contested wards in the 2019 Plymouth City Council elections. | |||||||||||||||||||||||||||||||||||||||||||||
| |||||||||||||||||||||||||||||||||||||||||||||
The 2019 Plymouth City Council election was held on 2 May 2019 to elect members of Plymouth City Council in England.
The Labour Party took control of the council after the 2018 election, with thirty-one members and a working majority. Labour defended nine seats, and the Conservatives defended ten. Labour won the election, winning ten of the nineteen seats up for election, with the Conservatives winning the other nine.
Background[]
Plymouth City Council held local elections on 2 May 2019 along with councils across England as part of the 2019 local elections. The council elects its councillors in thirds, with a third being up for election every year for three years, with no election each fourth year to correspond with councillors' four-year terms.[1][2] Councillors defending their seats in this election were previously elected in 2015. In that election, ten Conservative candidates and nine Labour candidates were elected.
Following the 2018 Plymouth City Council election, the council has been controlled by the Labour Party, initially with thirty-one councillors.
Labour held its seat in a subsequent by-election in Stoke ward, which took place in July 2018. As the councillor who stood down was elected in the same cycle as 2019, Jemima Laing, the winner of the by-election, was the incumbent up for re-election.[3] Kevin Neil, who was elected in 2018, was suspended from the Labour Party when a police investigation was launched into him. He continues to sit as an independent following the closure of the police investigation, pending an internal investigation by the party.[4]
Labour and the Conservatives contested all nineteen seats up for election, whilst the Liberal Democrats stood seventeen candidates and the UK Independence Party stood twelve.[5]
Overall results[]
| After 2018 election | Before 2019 election | After 2019 election | ||||||
|---|---|---|---|---|---|---|---|---|
| Party | Seats | Party | Seats | Party | Seats | |||
| Labour | 31 | Labour | 30 | Labour | 31 | |||
| Conservative | 26 | Conservative | 26 | Conservative | 25 | |||
| Independent | 0 | Independent | 1 | Independent | 1 | |||
| 2019 Plymouth City Council election[6] | ||||||||||
|---|---|---|---|---|---|---|---|---|---|---|
| Party | This election | Full council | This election | |||||||
| Seats | Net | Seats % | Other | Total | Total % | Votes | Votes % | +/− | ||
| Labour | 10 | 52.6 | 21 | 31 | 54.4 | 23,392 | 37.4 | –6.6 | ||
| Conservative | 9 | 47.4 | 16 | 25 | 43.9 | 23,076 | 36.9 | –7.8 | ||
| Independent | 0 | 0.0 | 1 | 1 | 1.7 | 1,156 | 1.8 | +1.3 | ||
| UKIP | 0 | 0.0 | 0 | 0 | 0.0 | 7,072 | 11.3 | –8.6 | ||
| Liberal Democrats | 0 | 0.0 | 0 | 0 | 0.0 | 4,416 | 7.0 | +3.6 | ||
| Green | 0 | 0.0 | 0 | 0 | 0.0 | 2,416 | 3.9 | –2.3 | ||
| Active for Plymouth | 0 | 0.0 | 0 | 0 | 0.0 | 779 | 1.2 | New | ||
| Socialist Alternative | 0 | 0.0 | 0 | 0 | 0.0 | 346 | 0.6 | New | ||
| Vivamus | 0 | 0.0 | 0 | 0 | 0.0 | 20 | 0.1 | ±0.0 | ||
Note: All changes in vote share are in comparison to the corresponding 2015 election.
Ward results[]
Asterisks denote sitting councillors seeking re-election.
Budshead[]

| Party | Candidate | Votes | % | ±% | |
|---|---|---|---|---|---|
| Conservative | Jonathan Drean* | 1,547 | 47.0 | ||
| Labour | Charlotte Cree | 1,081 | 32.9 | ||
| UKIP | John McCarthy | 504 | 15.3 | ||
| Active For Plymouth | Stephen Minns | 157 | 4.8 | N/A | |
| Majority | 466 | 14.2 | |||
| Turnout | 3,289 | ||||
| Conservative hold | Swing | ||||
Compton[]
| Party | Candidate | Votes | % | ±% | |
|---|---|---|---|---|---|
| Conservative | Nick Kelly | 1,497 | 40.7 | ||
| Labour | Liz Nicolls | 1,352 | 36.7 | ||
| UKIP | Michael Snelling | 460 | 12.5 | ||
| Liberal Democrats | Stuart Spicer | 373 | 10.1 | ||
| Majority | 145 | 3.9 | |||
| Turnout | 3,682 | ||||
| Conservative hold | Swing | ||||
Devonport[]

| Party | Candidate | Votes | % | ±% | |
|---|---|---|---|---|---|
| Labour | Mark Coker* | 1,438 | 46.3 | ||
| Conservative | Sandy Borthwick | 630 | 20.3 | ||
| UKIP | Richard Ellison | 628 | 20.2 | ||
| Green | Andy Pratt | 238 | 7.7 | ||
| Liberal Democrats | Fleur Ball | 169 | 5.4 | ||
| Majority | 808 | 26.0 | |||
| Turnout | 3,103 | ||||
| Labour hold | Swing | ||||
Drake[]

| Party | Candidate | Votes | % | ±% | |
|---|---|---|---|---|---|
| Labour | Chaz Singh* | 859 | 44.7 | ||
| Independent | Steve Ricketts | 846 | 44.0 | N/A | |
| Conservative | Mark Thompson | 102 | 5.3 | ||
| Liberal Democrats | Jeffrey Hall | 90 | 4.7 | ||
| Active For Plymouth | Jules Popescu | 26 | 1.4 | N/A | |
| Majority | 13 | 0.7 | |||
| Turnout | 1,923 | ||||
| Labour hold | Swing | N/A | |||
Efford and Lipson[]

| Party | Candidate | Votes | % | ±% | |
|---|---|---|---|---|---|
| Labour | Pauline Murphy* | 1,714 | 54.4 | ||
| UKIP | Stephen Austin | 612 | 19.4 | ||
| Conservative | Brett Carr | 583 | 18.5 | ||
| Liberal Democrats | Alex Primmer | 243 | 7.7 | ||
| Majority | 1,102 | 35.0 | |||
| Turnout | 3,152 | ||||
| Labour hold | Swing | ||||
Eggbuckland[]

| Party | Candidate | Votes | % | ±% | |
|---|---|---|---|---|---|
| Conservative | Lynda Bowyer* | 1,893 | 52.8 | ||
| Labour | John Petrie | 808 | 22.5 | ||
| UKIP | Wendy Noble | 660 | 18.4 | ||
| Liberal Democrats | Richard Simpson | 227 | 6.3 | N/A | |
| Majority | 1,085 | 30.2 | |||
| Turnout | 3,588 | ||||
| Conservative hold | Swing | ||||
Ham[]

| Party | Candidate | Votes | % | ±% | |
|---|---|---|---|---|---|
| Labour | Tudor Evans* | 1,441 | 45.9 | ||
| UKIP | Michael Arthur | 633 | 20.2 | ||
| Conservative | Tim Blazevic | 605 | 19.3 | ||
| Active For Plymouth | Jason Shopland | 287 | 9.1 | N/A | |
| Liberal Democrats | Mike Gillbard | 157 | 5.0 | ||
| Socialist Alternative | Nik Brookson | 16 | 0.5 | N/A | |
| Majority | 808 | 25.7 | |||
| Turnout | 3,139 | ||||
| Labour hold | Swing | ||||
Honicknowle[]

| Party | Candidate | Votes | % | ±% | |
|---|---|---|---|---|---|
| Labour | Mark Lowry* | 1,499 | 48.8 | ||
| UKIP | Ivor Lucas | 747 | 24.3 | ||
| Conservative | Nikki Bale | 642 | 20.9 | ||
| Liberal Democrats | Lloyd Jones | 121 | 3.9 | N/A | |
| Socialist Alternative | Samuel Taylor-Wickenden | 61 | 2.0 | N/A | |
| Majority | 752 | 24.5 | |||
| Turnout | 3,070 | ||||
| Labour hold | Swing | ||||
Moor View[]

| Party | Candidate | Votes | % | ±% | |
|---|---|---|---|---|---|
| Conservative | John Riley | 1,311 | 36.9 | ||
| Labour | Merika Kindlon | 1,233 | 34.7 | ||
| UKIP | John Baddeley | 670 | 18.9 | ||
| Independent | Arthur Watson | 171 | 4.8 | N/A | |
| Liberal Democrats | Jim Spencer | 168 | 4.7 | ||
| Majority | 78 | 2.2 | |||
| Turnout | 3,553 | ||||
| Conservative hold | Swing | ||||
Peverell[]

| Party | Candidate | Votes | % | ±% | |
|---|---|---|---|---|---|
| Labour | Sarah Allen | 1,902 | 41.3 | ||
| Conservative | John Mahony* | 1,710 | 37.1 | ||
| UKIP | Paul McAuley | 385 | 8.4 | ||
| Green | Nicholas Casley | 355 | 7.7 | ||
| Liberal Democrats | Richard Lawrie | 233 | 5.1 | ||
| Vivamus | Bernard Toolan | 20 | 0.4 | ||
| Majority | 192 | 4.2 | N/A | ||
| Turnout | 4,605 | ||||
| Labour gain from Conservative | Swing | ||||
Plympton Erle[]

| Party | Candidate | Votes | % | ±% | |
|---|---|---|---|---|---|
| Conservative | Terri Beer* | 1,468 | 62.7 | ||
| Labour | Andrew Wade | 544 | 23.2 | ||
| Liberal Democrats | Dennis Draper | 330 | 14.1 | ||
| Majority | 924 | 39.5 | |||
| Turnout | 2,342 | ||||
| Conservative hold | Swing | ||||
Plympton St Mary[]

| Party | Candidate | Votes | % | ±% | |
|---|---|---|---|---|---|
| Conservative | Patrick Nicholson* | 2,634 | 72.6 | ||
| Labour | Paul McNamara | 623 | 17.2 | ||
| Liberal Democrats | Thomas Heard | 373 | 10.3 | N/A | |
| Majority | 2,011 | 55.4 | |||
| Turnout | 3,630 | 37.0 | |||
| Conservative hold | Swing | ||||
Plymstock Dunstone[]

| Party | Candidate | Votes | % | ±% | |
|---|---|---|---|---|---|
| Conservative | Nigel Churchill* | 1,947 | 57.6 | ||
| Labour | Ben Davy | 795 | 23.5 | ||
| Liberal Democrats | Sima Davarian | 636 | 18.8 | ||
| Majority | 1,152 | 34.1 | |||
| Turnout | 3,378 | 36.0 | |||
| Conservative hold | Swing | ||||
Plymstock Radford[]

| Party | Candidate | Votes | % | ±% | |
|---|---|---|---|---|---|
| Conservative | Kathy Watkin | 1,866 | 50.0 | ||
| Labour | Baz Ahmed | 853 | 22.9 | ||
| Green | Matthew Faith | 594 | 15.9 | N/A | |
| Liberal Democrats | Roy Plumley | 419 | 11.2 | N/A | |
| Majority | 1,013 | 27.1 | |||
| Turnout | 3,732 | 35.6 | |||
| Conservative hold | Swing | ||||
Southway[]

| Party | Candidate | Votes | % | ±% | |
|---|---|---|---|---|---|
| Conservative | Mark Deacon* | 1,423 | 40.7 | ||
| Labour | Sally Cresswell | 1,314 | 37.6 | ||
| UKIP | William Bertram | 563 | 16.1 | ||
| Liberal Democrats | Jacqui Spencer | 198 | 5.7 | N/A | |
| Majority | 109 | 3.1 | |||
| Turnout | 3,498 | 35.5 | |||
| Conservative hold | Swing | ||||
St Budeaux[]

| Party | Candidate | Votes | % | ±% | |
|---|---|---|---|---|---|
| Labour | George Wheeler* | 1,181 | 40.0 | ||
| Conservative | Pat Patel | 985 | 33.4 | ||
| UKIP | Ross Horton | 680 | 23.1 | ||
| Socialist Alternative | Andrew White | 103 | 3.5 | N/A | |
| Majority | 196 | 6.6 | |||
| Turnout | 2,949 | 30.9 | |||
| Labour hold | Swing | ||||
St Peter and the Waterfront[]

| Party | Candidate | Votes | % | ±% | |
|---|---|---|---|---|---|
| Labour | Chris Penberthy* | 1,528 | 43.5 | ||
| Conservative | Shannon Burden | 697 | 19.8 | ||
| UKIP | Hugh Davies | 530 | 15.1 | ||
| Green | James Ellwood | 355 | 10.1 | ||
| Liberal Democrats | Hugh Janes | 219 | 6.2 | ||
| Independent | Tim Francis | 139 | 4.0 | N/A | |
| Socialist Alternative | Ryan Aldred | 47 | 1.3 | N/A | |
| Majority | 831 | 23.6 | |||
| Turnout | 3,515 | 30.2 | |||
| Labour hold | Swing | ||||
Stoke[]

| Party | Candidate | Votes | % | ±% | |
|---|---|---|---|---|---|
| Labour | Jemima Laing* | 1,544 | 47.1 | ||
| Conservative | Chip Tofan | 866 | 26.4 | ||
| Green | Ian Poyser | 434 | 13.2 | ||
| Liberal Democrats | Connor Clarke | 227 | 6.9 | ||
| Active For Plymouth | Alina Zanosche | 206 | 6.3 | ||
| Majority | 678 | 20.7 | |||
| Turnout | 3,277 | 33.2 | |||
| Labour hold | Swing | ||||
Sutton and Mount Gould[]

| Party | Candidate | Votes | % | ±% | |
|---|---|---|---|---|---|
| Labour | Sue Dann* | 1,683 | 53.7 | ||
| Conservative | Dan Collins | 670 | 21.4 | ||
| Green | Mike Kewish | 440 | 14.0 | ||
| Liberal Democrats | Peter York | 233 | 7.1 | ||
| Socialist Alternative | Roxy Castell | 119 | 3.8 | ||
| Majority | 1,013 | 32.3 | |||
| Turnout | 3,135 | 31.7 | |||
| Labour hold | Swing | ||||
References[]
- ^ "Local government structure and elections". GOV.UK. Retrieved 27 April 2018.
- ^ "Election Timetable in England" (PDF).
- ^ O'Leary, Miles (27 July 2018). "Labour hold Stoke ward seat in Plymouth by-election". plymouthherald. Retrieved 20 October 2018.
- ^ Eve, Carl (25 September 2018). "Police investigation into suspended Labour councillor dropped". plymouthherald. Retrieved 10 April 2019.
- ^ Oldfield, Edward (5 April 2019). "Every person standing for election in Plymouth listed". plymouthherald. Retrieved 10 April 2019.
- ^ "Local election results 2019". Plymouth City Council. Archived from the original on 26 October 2019.
| Devon County Council | |
|---|---|
| East Devon District Council |
|
| Exeter City Council | |
| Mid Devon District Council |
|
| North Devon District Council | |
| Plymouth City Council | |
| South Hams District Council |
|
| Teignbridge District Council |
|
| Torbay Council | |
| Torridge District Council | |
| West Devon Borough Council | |
| |
- 2019 English local elections
- Plymouth City Council elections
- 2010s in Devon
- May 2019 events in the United Kingdom