Armstrong School District (Pennsylvania)
| Armstrong School District | |
|---|---|
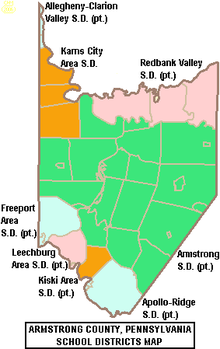 Map of Armstrong County Pennsylvania School Districts | |
| Address | |
410 Main Street
, Armstrong County and Indiana County, Pennsylvania, 16226United States | |
| District information | |
| Type | Public |
| Motto | Working Together for Academic Excellence |
| Grades | PreK–12 |
| Superintendent | Dr Stan J Chapp (2010-2015) |
| Asst. superintendent(s) | Dr Lyn R Logelin |
| Business administrator | Mr. John Zenone |
| School board | 9 locally elected board members |
| Budget | $96,135,837 (2014-2015)[1] $85 million (2008-2009) |
| Students and staff | |
| Enrollment | 5,405 pupils (2013),[4] 5,615 pupils (2009-10), 6,031 pupils (2006-07)[5] |
| Teachers | 418 teachers (2012); 419 (2010)[2] |
| Staff | 280 (2012);[3] 280 non-teaching staff members |
| Other information | |
| Website | www |

The Armstrong School District is a large, public school district which encompasses approximately 437 square miles (1,130 km2). The District is one of the 500 public school districts of Pennsylvania. In Armstrong County, Pennsylvania, Armstrong School District covers the Boroughs of Applewold, Atwood, Dayton, Elderton, Ford City, Ford Cliff, Kittanning, Manorville, Rural Valley, West Kittanning and Worthington and the Townships of Bethel Township, Boggs Township, Burrell Township, Cadogan Township, Cowanshannock Township, East Franklin Township, Kittanning Township, Manor Township, North Buffalo Township, Pine Township, Plumcreek Township, Rayburn Township, South Bend Township, Valley Township, Washington Township, Wayne Township and West Franklin Township. In Indiana County, Pennsylvania the district includes the Borough of Smicksburg and West Mahoning Township. According to 2000 federal census data, it served a resident population of 44,970. By 2010, the District's population declined to 43,301 people.[6] In 2009, Armstrong School District residents' per capita income was $15,449, while the median family income was $36,907.[7]
According to Armstrong School District officials, in school year 2009-10, the District provided basic educational services to 5,551 pupils. The District employed 463 teachers, 232 full-time and part-time support personnel, and 28 administrators. Armstrong School District received more than $43.3 million in state funding in school year 2009-10. In school year 2005–06, the Armstrong School District provided basic educational services to 6,145 pupils. In 2005 it employed: 490 teachers, 173 full-time and part-time support personnel, and 33 administrators. Armstrong School District received more than $38 million in state funding in school year 2005–06.
In 2013, Armstrong School District operated ten (10) public schools. A new junior-senior high school was completed in 2015. As such, two older high school buildings will be closed. The district was established 1966 when Pennsylvania consolidated several smaller school districts.
Current schools include: Armstrong Junior-Senior High School (7-12); Dayton Elementary School (K-6); Elderton Elementary School (K-6); Lenape Elementary School (K-6); Shannock Valley Elementary School (K-6); West Hills Primary (K-3); West Hills Intermediate School (4-6); and West Shamokin Junior-Senior High School (7-12).
High school students may also choose to attend Lenape Tech [1] for vocational training. The ARIN Intermediate Unit IU28 provides the district with a wide variety of services like specialized education for disabled students and hearing, speech and visual disability services and professional development for staff and faculty.
The mission statement of the Armstrong School District is 'The Armstrong School District, in partnership with our families and communities, will graduate educationally prepared, productive, morally responsible individuals'.
Governance[]
The Armstrong School District is governed by 9 individually elected board members (serve four-year terms), the Pennsylvania State Board of Education, the Pennsylvania Department of Education and the Pennsylvania General Assembly.[8] The federal government controls programs it funds like Title I funding for low-income children in the Elementary and Secondary Education Act and the No Child Left Behind Act, which mandates the district focus resources on student success in acquiring essential reading and math skills. The Superintendent and Business Manager are appointed by the school board. The Superintendent is the chief administrative officer with overall responsibility for all aspects of operations, including education and finance. The Business Manager is responsible for budget and financial operations. Neither of these officials are voting members of the School Board. The School Board enters into individual employment contracts for these positions. In Pennsylvania, public school districts are required to give 150 days notice to the Superintendent regarding renewal of the employment contract.
The Commonwealth Foundation for Public Policy Alternatives Sunshine Review gave the Armstrong School Board and school district administration a "C-" for transparency based on a review of "What information can people find on their school district's website". It examined the school district's website for information regarding; taxes, the current budget, meetings, school board members names and terms, contracts, audits, public records information and more.[9]
The Armstrong School District's Board of Education consists of the following people in 2010:[10] Joseph D. Close - President, Christopher E. Choncek - Vice President, Stan J. Berdell, Dr. Paul J. Lobby, Amy K. Lhote, Larry P. Robb Jr., James T. Rearic, D. Royce Smeltzer, Sara J. Yassem, Lee V. Price – Solicitor, Linda J. Shirley – Board Secretary, Eric A. Brandenburg – Board Treasurer on January 18, 2010.
Schools[]
West Hills Primary School 181 Heritage Park Dr., Kittaning, PA 16201
West Hills Intermediate School 175 Heritage Park Dr., Kittanning, PA 16201
Lenape Elementary School
Shannock Valley Elementary School
Armstrong Junior Senior High School - 7th - 12th grades
West Shamokin Jr./Sr. High School 7th – 12th grades
Armstrong School District Cyber Academy - online school grades 7 - 12 [2].
Academic achievements[]
In 2007, Johns Hopkins University reported that several of the district's high schools were listed among 47 Pennsylvania schools and 1700 nationwide high schools with high drop out rates.[11]
In 2014, Armstrong School District was ranked 322nd out of the 496 ranked Pennsylvania public school districts by the Pittsburgh Business Times.[12] The ranking is based on the last 3 years of student academic achievement as demonstrated by PSSAs results in: reading, writing, math and science and the three Keystone Exams (literature, Algebra 1, Biology I) in high school.[13] Three school districts were excluded because they do not operate high schools (Saint Clair Area School District, Midland Borough School District, Duquesne City School District). The PSSAs are given to all children in grades 3rd through 8th. Adapted PSSA examinations are given to children in the special education programs. Writing exams were given to children in 5th and 8th grades.
|
|
|
- Overachiever statewide ranking
In 2013, the Pittsburgh Business Times also reported an Overachievers Ranking for 498 Pennsylvania school districts. Armstrong School District ranked 273rd. In 2012, the District was 272nd.[20] The editor describes the ranking as: "a ranking answers the question - which school districts do better than expectations based upon economics? This rank takes the Honor Roll rank and adds the percentage of students in the district eligible for free and reduced-price lunch into the formula. A district finishing high on this rank is smashing expectations, and any district above the median point is exceeding expectations."[21]
- Western Pennsylvania schools ranking
Armstrong School District was ranked 70th out of 105 western Pennsylvania school districts in 2013 by the Pittsburgh Business Times. The ranking was based on the last three years of student academic performance on the PSSAs for math, reading, writing and science.[22] (includes 105 districts in: Allegheny County, Armstrong County, Beaver County, Butler County, Fayette County, Washington County and Westmoreland County but excludes Duquesne City School District & Midland Borough School District due to their not operating a high school).
- 2012 - 72nd
- 2010 - 72nd
- 2009 - 72nd
- 2008 - 67th
District-wide graduation rate[]
In 2013, Armstrong School District achieved an 87% graduation rate.[23] In 2012, Armstrong School District achieved an 87.23% graduation rate.[24] In 2011, Armstrong School District achieved an 89% graduation rate.[25] In 2010, the Pennsylvania Department of Education issued a new, 4-year cohort graduation rate. Armstrong School District's rate was 83% for 2010.[26]
According to traditional graduation rate calculations:
In 2006, 51% of the graduates from Armstrong School District did not achieve proficient or better on the PSSA's for Mathematics and Reading.[31]
District AYP History[]
In 2012, Armstrong School District achieved Adequate Yearly Progress rating even though 6 of its schools were in Warning AYP status due to lagging student achievement.[32] the low achievement schools are: Elderton Junior Senior High School, Ford City Junior High School, Kittanning Area Junior High School, Kittanning Senior High School, Shannock Valley Elementary School, and West Hills Intermediate School.
- achieved AYP status 2005-2011
- 2003 and 2004 - Warning AYP status due to lagging student achievement in reading and mathematics.
- District Wide PSSA results
- 11th grade reading:
- 2012 - 59% on grade level, (20% below basic). State - 67% of 11th graders are on grade level.[33]
- 2011 - 65%, (17% below basic). State - 69.1%[34]
- 2010 - 65% (19% below basic). State - 66%
- 2009 - 74%, State – 65%
- 2008 - 64%, State – 65%
- 11th grade math:
- 2012 - 53% on grade level (25% below basic). In Pennsylvania, 59% of 11th graders are on grade level.[35]
- 2011 - 51%, (23% below basic). State - 60.3%
- 2010 - 53%, (25% below basic). State - 59%
- 2009 - 61%, State – 56%[36]
- 2008 - 49%, State – 56%
- 11th grade science:
- 2012 - 38% on grade level (13% below basic). State - 42% of 11th graders were on grade level.[37]
- 2011 - 36% on grade level (16% below basic). State - 40% of 11th graders were on grade level.[38]
- 2010 - 35%, (14% below basic). State – 39%
- 2009 - 48%, State – 39%%[39]
Graduation requirements[]
The Armstrong School Board has determined that a pupil must earn 25 credits to graduate, including: a required class every year in math 4 credits, English 4 credits, social studies 4 credits, science 3 credits, Physical Education, Computer Science 0.5 credit, Community Service Learning .25 credit, Public speaking 0.5 credit, Living on Your Own 0.5 credit, Driver Education Theory 0.3 credit and other electives.[40] Beginning in grade 7, students have the opportunity to make up a maximum of two courses failed during the school year in summer school.
Driver Education Theory is scheduled in grade ten as a required course. Behind-the- wheel driving lessons (six total hours) may be scheduled during after-school hours and after the Driver Education Theory course is completed. A $50 fee is charged for behind- the-wheel lessons.
By law, all Pennsylvania secondary school students must complete a project as a part of their eligibility to graduate from high school. The type of project, its rigor and its expectations are set by the individual school district.[41] Effective with the graduating class of 2017, the Pennsylvania State Board of Education eliminated the state mandate that students complete a culminating project in order to graduate.[42]
By Pennsylvania School Board regulations, beginning with the class of 2017, public school students must demonstrate successful completion of secondary level course work in Algebra I, Biology, and English Literature by passing the Keystone Exams.[43] The exam is given at the end of the course. Keystone Exams replace the PSSAs for 11th grade.[44]
Students have several opportunities to pass the exam. Those who do not pass after several attempts can perform a project in order to graduate.[45][46] For the class of 2019, a Composition exam will be added. For the class of 2020, passing a civics and government exam will be added to the graduation requirements.[47] In 2011, Pennsylvania high school students field tested the Algebra 1, Biology and English Lit exams. The statewide results were: Algebra 1 38% on grade level, Biology 35% on grade level and English Lit - 49% on grade level.[48] Individual student, school or district reports were not made public, although they were reported to district officials by the Pennsylvania Department of Education. Students identified as having special needs and qualifying for an Individual Educational Program (IEP) may graduate by meeting the requirements of their Individual Education Plan (IEP).
Ford City Junior Senior High School[]
Ford City Junior Senior High School is located at 4th Ave and 11th St, Ford City. In 2013, the enrollment is 746 pupils in grades 7th through 12th, with 39% of pupils coming from homes with low income. Additionally, 13% of its pupils receive special education services and 4.5% were identified as gifted. According to a report by the Pennsylvania Department of Education, 100% of its teachers were rated "Highly Qualified" under the federal No Child Left Behind Act.[49]
According to the National Center for Education Statistics, in 2011, Ford City Junior Senior High School reported an enrollment of 676 pupils in grades 7th through 12th, with 238 pupils eligible for a federal free or reduced price lunch due to the family meeting the federal poverty level. The school employed 51 teachers yielding a student-teacher ratio of 13:1.[50] According to a report by the Pennsylvania Department of Education, 100% of its teachers were rated "Highly Qualified" under the federal No Child Left Behind Act.[51]
- 2013 School Performance Profile
Ford City Junior Senior High School achieved 68.4 out of 100. Reflects on grade level reading, mathematics and science achievement. In reading/literature - 73.78% were on grade level. In Algebra 1, 76% showed on grade level skills. In Biology, 57% showed on grade level science understanding. Eighth grade writing was 67% of students demonstrated on grade level writing skills.[52] According to the Pennsylvania Department of Education, 2,181 public schools (less than 73 percent of Pennsylvania public schools), achieved an academic score of 70 or higher. Pennsylvania 11th grade students no longer take the PSSAs. Instead, they now take the Keystone Exams at the end of the associated course.
- Adequate Yearly Progress History
In 2012, Ford City Junior Senior High School declined to Warning AYP status due to the significantly lagging student achievement in reading and mathematics.[53] In 2011, Ford City Junior Senior High School achieved AYP status.[54] In 2010, Ford City Junior Senior High School was in Warning status for academic achievement due to low student achievement in reading and mathematics. In 2009, the school achieved AYP.[55] In 2008 and 2003, Ford City Junior Senior High School was also in Warning AYP status.[56]
- Graduation rate:
- PSSA results
PSSAs are NCLB related examinations which were administered from 2003 through 2012. Eleventh grade students were tested in reading, writing, mathematics and science. In 2013, the Commonwealth of Pennsylvania changed its high school assessments to the Keystone Exams in Algebra 1, Reading/literature and Biology1. The exams are given at the end of the course, rather than all in the spring of the student's 11th grade year.
11th grade Reading:
- 2012 - 70% on grade level, (17% below basic). State - 67% of 11th graders are on grade level.[33]
- 2011 - 59%, (26% below basic). State - 69.1%.[34]
- 2010 – 70%, (16% below basic). State – 66%[62]
- 2009 – 74%, State – 65%[63]
- 2008 – 67%, State – 65%
- 2007 – 74%, State – 65%
- 11th grade Math:
- 2012 - 64% on grade level (19% below basic). In Pennsylvania, 59% of 11th graders are on grade level.[35]
- 2011 - 48%, (25% below basic). State - 60.3%[64]
- 2010 – 64%, (18% below basic). State - 59%
- 2009 – 63%, State – 56%
- 2008 – 52%, State – 56%[65]
- 2007 – 61%, State – 53%[66]
- 11th grade Science:
- 2012 - 46% on grade level (5% below basic). State - 42% of 11th graders were on grade level.[67]
- 2011 - 39%, (11% below basic). State - 40%[38]
- 2010 – 43%, (12% below basic). State – 39%
- 2009 – 44%, State – 40%
- 2008 – 25%, State – 39%
Eighth grade[]
In 2013, Ford City's 8th grade was ranked 84th out of 141 western Pennsylvania middle schools, by the Pittsburgh Business Times, based on the last three year of student achievement on the PSSAs in reading mathematics, writing and science.[68] In 2012, the eighth grade ranked 87th in the western Pennsylvania schools. In 2009, the 8th grade was ranked 93rd out of 141 western Pennsylvania middle schools.[69]
|
8th grade Reading:
|
8th grade Math:
|
8th grade Science:
- 2012 - 61% on grade level (13% below basic). State - 59%
- 2011 - 68% (16% below basic). State – 58.3%
- 2010 - 54% (25% below basic). State - 57%
- 2009 - 57% (19% below basic). State - 55%[72]
Seventh grade[]
In 2013, Ford City's seventh (7th) grade ranked 61st out of 150 western Pennsylvania middle school seventh grades.[73] In 2012, Ford City's seventh grade ranked 70th in the western Pennsylvania region.
|
7th grade Reading:
|
7th grade Math:
|
Kittanning Senior High School[]
Kittanning Senior High School is located at 1200 Orr Avenue, Kittanning. In 2013, the School reported an enrollment of 612 pupils in grades 9th through12th, with 38% of pupils receiving a federal free lunch due to family poverty. Additionally, 11% of pupils received special education services and 4% were identified as gifted. According to a report by the Pennsylvania Department of Education, 100% of its teachers were rated "Highly Qualified" under No Child Left Behind.[74]
According to the National Center for Education Statistics, in 2011, the school reported an enrollment of 632 pupils in grades 9th through 12th, with 209 pupils eligible for a federal free or reduced price lunch due to the family meeting the federal poverty level. The school is not a federally designated Title I school. The school employed 51 teachers yielding a student-teacher ratio of 12:1.[75] According to a report by the Pennsylvania Department of Education, 100% of its teachers were rated "Highly Qualified" under No Child Left Behind.[76]
- 2013 School Performance Profile
Kittanning Senior High School achieved 67.2 out of 100. Reflects on grade level reading, mathematics and science achievement. In reading/literature - 71% of tested pupils were on grade level. In Algebra 1, 61.7% showed on grade level skills. In Biology, just 43.8% showed on grade level science understanding.[77]
- Graduation Rate:
- Western Pennsylvania ranking
In 2013, the Pittsburgh Business Times ranked Kittanning Senior High School's eleventh (11th) grade 67th out of 105 western Pennsylvania high schools, based on the last three years of student academic achievement on the Pennsylvania System of School Assessments (PSSA) in: reading, math, writing and science.[82] In 2012, the eleventh grade ranked 73rd in western Pennsylvania.
- AYP Status history
In 2012, Kittanning Senior High School remained in Warning AYP (Adequate Yearly Progress) status due to missing all metric in reading and mathematics.[83] In 2011, Kittanning Senior High School declined to Warning AYP status. In 2010, the School achieved AYP status.[84]
- PSSA history
11th grade Reading
- 2012 - 64% on grade level, (15% below basic). State - 67% of 11th graders are on grade level.
- 2011 - 70%, (16% below basic). State - 69.1% of 11th graders are on grade level.[85]
- 2010 – 73% (16% below basic). State - 66%
- 2009 – 69% (17% below basic), State – 65%[86]
- 11th grade Math:
- 2012 - 63% on grade level (19% below basic). In Pennsylvania, 59% of 11th graders are on grade level.[35]
- 2011 - 58%, (16% below basic). State - 60.3%
- 2010 - 64%, (22% below basic). State - 59%[87]
- 2009 - 60%, State – 56%[88]
- 2008 - 46%, State – 56%[89]
- 2007 - 49%, State – 53%[90]
- 11th grade Science:
- 2012 - 42% on grade level (10% below basic). State - 42% of 11th graders were on grade level.[91]
- 2011 - 44%, (13% below basic). State - 40%
- 2010 – 42%, (12% below basic). State – 39%
- 2009 – 47%, State – 40%
- 2008 – 37%, State – 39%
- AP Courses
In 2013, Kittanning Senior High School offered 5 Advanced Placement (AP) courses at a higher cost than regular courses. The student pays the fee for the exam which was $89 per test per pupil in 2012. Students have the option of taking College Board approved courses and then taking the College Board's examination in the Spring. Students, who achieve a 3 or better on the exam, may be awarded college credits at US universities and colleges. Each higher education institution sets its own standards about what level of credits are awarded to a student based on their AP exam score. Most higher education give credits for scores of 4 or 5. Some schools also give credits for scores of 3. High schools give credits towards graduation to students who take the school's AP class. At Kittanning Senior High School 24.48% of students who took an AP course earned a 3 or better on the exam.[92]
Kittanning Junior High School[]
Kittanning Junior High School is located at 210 N McKean Street, Kittanning. In 2013, enrollment was 379 pupils, in grades 7th and 8th, with 41% of pupils eligible for a free lunch due to family poverty. Additionally, 18.7% of pupils received special education services, while less than 1% of pupils were identified as gifted.[93] According to a 2013 report by the Pennsylvania Department of Education, 100% of its teachers were rated "Highly Qualified" under No Child Left Behind.[94]
According to the National Center for Education Statistics, in 2011, Kittanning Junior High School reported an enrollment of 379 pupils in grades 7th and 8th, with 41% of its pupils receiving a federal free or reduced price lunch due to family poverty. In 2011, the school employed 27 teachers yielding a student-teacher ratio of 12:1.[95] According to a report by the Pennsylvania Department of Education, 100% of its teachers were rated "Highly Qualified" under No Child Left Behind.[96]
- 2013 School Performance Profile
Kittanning Junior High School achieved 71.5 out of 100. Reflects on grade level reading, writing, mathematics and science achievement. In reading, 78.7% of the students were on grade level. In Mathematics, 83% of the students showed on grade level skills. In Science, 59.7% of the 8th graders demonstrated on grade level understanding. In writing, 74% of the 8th grade students were on grade level.[97]
- AYP History
In 2012, Kittanning Junior High School declined to Warning AYP status.[98] In 2010 and 2011, Kittanning Junior High School achieved AYP status.[99]
- Western Pennsylvania 8th grade ranking
In 2013, Kittanning Junior High's eighth grade ranked 82nd out of 149 western Pennsylvania middle schools based on the last three years of student academic achievement in Pennsylvania System of School Assessments (PSSA) in: reading, math, writing and three years of science.[100] In 2012, Kitanning's 8th grade was ranked 77th among western Pennsylvania schools. In 2009, the 8th grade was ranked 74th out of 141 western Pennsylvania middle schools based on three years of student academic achievement in PSSAs in: reading, mathematics, writing and one year of science.[69]
- PSSA History
|
8th grade Reading:
|
8th grade Math:
|
8th grade Science:
- 2012 - 53% on grade level (23% below basic). State - 59%
- 2011 - 58% (17% below basic). State – 58.3%
- 2010 – 49% (27% below basic). State – 57%
- 2009 – 52% (21% below basic), State – 55%[106]
- Seventh grade
In 2013, the Kittanning Junior High School's seventh grade ranked 60th out of 150 western Pennsylvania middle school seventh grades.[73] In 2012, the seventh grade ranked 63rd in the western Pennsylvania region.
|
7th grade Reading:
|
7th grade Math:
|
West Shamokin Junior Senior High School[]
West Shamokin Junior Senior High School is located at 178 Wolf Drive, Rural Valley. In 2013, enrollment was 722 pupils, in grades 7th through 12th, with 39% of pupils eligible for a free lunch due to family poverty. Additionally, 16.8% of pupils received special education services, while 3.6% of pupils were identified as gifted.[107] According to a 2013 report by the Pennsylvania Department of Education, 100% of its teachers were rated "Highly Qualified" under No Child Left Behind.[108]
According to the National Center for Education Statistics, in 2011, West Shamokin Junior Senior High School reported an enrollment of 545 pupils, in grades 7th through 12th, with 240 pupils receiving a federal free or reduced price lunch due to family poverty. The School employed 48 teachers yielding a student-teacher ratio of 11:1.[109] According to a report by the Pennsylvania Department of Education, 100% of its teachers were rated "Highly Qualified" under No Child Left Behind.[110]
Graduation Rate:
- AYP History
In 2011 and 2012, West Shamokin Junior Senior High School achieved AYP status. In 2010, the School was in Warning AYP status due to lagging student academic achievement.[114]
- PSSA results
11th grade Reading:
- 2012 - 71% on grade level, (11% below basic). State - 67%
- 2011 - 78% (8% below basic). State - 69.1%[34]
- 2010 – 73% (14% below basic). State - 66%[62]
- 2009 – 83% (8% below basic), State – 65%[63]
- 11th grade Math:
- 2012 - 60%, on grade level (15% below basic). State - 59%
- 2011 - 63%, on grade level (10% below basic). State - 60.3%[115]
- 2010 – 54%, State - 59%[116]
- 2009 – 71%, State – 56%
- 2008 – 48%, State – 56%
- 2007 – 53%, State – 53%
11th grade Science:
- 2011 - 42% on grade level (9% below basic). State - 42%
- 2011 - 37% (18% below basic). State - 40%[38]
- 2010 – 38%, State – 39%
- 2009 – 64%, State – 40%
- 2008 – 27%, State – 39%
Eighth grade[]
In 2009, the 8th grade was ranked 75th out of 141 western Pennsylvania middle schools based on three years of student academic achievement in PSSAs in: reading, math writing and one year of science.[69]
|
8th Grade Reading
|
8th Grade Math:
|
8th Grade Science:
- 2012 - 66% on grade level (14% below basic). State – 59% of 8th graders were on grade level.
- 2011 - 46% (30% below basic). State – 58.3%
- 2010 - 47% (34% below basic). State - 57%[117]
Seventh grade[]
|
7th Grade Reading
|
7th Grade Math:
|
Cyber education[]
As of the 2008–2009 school year, the Armstrong School District is offering its Cyber Academy. It is available for students in grades 7 through 12. The school district's cyber school is an alternative to other statewide public cyber charter schools, such as the Pennsylvania Cyber Charter School.[118] See: Education in Pennsylvania.
Dual enrollment[]
The Armstrong School District high schools offer a dual enrollment program. This state program permits high school students to take courses, at local higher education institutions, to earn college credits. Students remain enrolled at their high school. The courses count towards high school graduation requirements and towards earning a college degree. The students continue to have full access to activities and programs at their high school. The college credits are offered at a deeply discounted rate. The state offers a small grant to assist students in costs for tuition, fees and books.[119] Under the Pennsylvania Transfer and Articulation Agreement, many Pennsylvania colleges and universities accept these credits for students who transfer to their institutions.[120] For the 2009–10 funding year, the school district received a state grant of $12,125 for the program.
Twenty dual enrollment course options are available in the District throughout the school year in areas such as Music, Art, Psychology, Anthropology, Algebra, Calculus, Microeconomics, Spanish, French, History, and Political Science. ASD partners with Indiana University of Pennsylvania (IUP), Butler County Community College (BC3) and California University of Pennsylvania (Cal U) to offer these courses. The course costs are deeply discounted up to 75% off.
College remediation[]
According to a Pennsylvania Department of Education study released in January 2009, 20% of Armstrong School District graduates required remediation in mathematics and or reading before they were prepared to take college level courses in the Pennsylvania State System of Higher Education or community colleges.[121] Less than 66% of Pennsylvania high school graduates, who enroll in a four-year college in Pennsylvania, will earn a bachelor's degree within six years. Among Pennsylvania high school graduates pursuing an associate degree, only one in three graduate in three years.[122] Per the Pennsylvania Department of Education, one in three recent high school graduates who attend Pennsylvania's public universities and community colleges takes at least one remedial course in math, reading or English.
Dayton Elementary School[]
Dayton Elementary School is located at 175 E. Grant Avenue, Dayton. In 2013, the school's enrollment was 262 pupils with 36% of pupils receiving a federal free or reduced price meals due to family poverty. According to a report by the Pennsylvania Department of Education, 100% of the teachers were rated highly qualified under No Child Left Behind. The school provides both half day kindergarten and full day kindergarten through 6th grade.[123] The Dayton Elementary School is a federally designated Title I school. In 2011, the school employed 22 teachers yielding a student-teacher ratio of 12:1.[124] In 2011, the enrollment was 273 pupils.
- 2013 School Performance Profile
Dayton Elementary School achieved a score of 78.3 out of 100. The score reflects on grade level: reading, science, writing and mathematics achievement. In 2012-13, only 71% of the students were reading on grade level in grades 3rd through 5th. In 3rd grade, 84.6% of the pupils were reading on grade level. In math, 85% were on grade level (3rd-5th grades). In 4th grade science, just 80% of the pupils demonstrated on grade level understanding. In writing only 75% of 5th grade pupils demonstrated on grade level skills.[125]
In 2011 and 2012, Dayton Elementary School achieved AYP status.[126][127]
Elderton Elementary School[]
Elderton Elementary School is located at 239 S. Lytle Street, Elderton. In 2013, the school's enrollment was 286 pupils with 37% of pupils receiving a federal free or reduced price meals due to family poverty. According to a report by the Pennsylvania Department of Education, 100% of the teachers were rated highly qualified under No Child Left Behind in 2013. The school provides both: half day kindergarten and full day kindergarten as well as first through sixth grade.[128] The school is a federally designated Title I school. In 2011, Elderton Elementary School employed 22 teachers yielding a student-teacher ratio of 12:1. The enrollment was 272 pupils in 2011.[129]
- 2013 School Performance Profile
Elderton Elementary School achieved a score of 76.9 out of 100. The score reflects on grade level: reading, science, writing and mathematics achievement. In 2012-13, only 67% of the students were reading on grade level in grades 3rd through 5th. In 3rd grade, 83% of the pupils were reading on grade level. In math, 75% were on grade level (3rd-5th grades). In 4th grade science, 82% of the pupils demonstrated on grade level understanding. In writing, only 77% of 5th grade pupils demonstrated on grade level writing skills.[130]
In 2011 and 2012, Elderton Elementary School achieved AYP status.[131][132]
Lenape Elementary School[]
Lenape Elementary School is located at. In 2013, the school's enrollment was 825 pupils with 52% of pupils receiving a federal free or reduced price meals due to family poverty. According to a report by the Pennsylvania Department of Education, 100% of the teachers were rated highly qualified under No Child Left Behind. The school provides both full day and half day kindergarten through sixth grade.[133] Lenape Elementary School is a federally designated Title I school. In 2011, the school employed 48 teachers yielding a student-teacher ratio of 15:1. The enrollment was 720 pupils in 2011.[134]
- 2013 School Performance Profile
Lenape Elementary School achieved a score of 81.3 out of 100. The score reflects on grade level: reading, science, writing and mathematics achievement. In 2012-13, only 66% of the students were reading on grade level in grades 3rd through 5th. In 3rd grade, 58% of the pupils were reading on grade level. In math, 78.6% were on grade level (3rd-5th grades). In 4th grade science, 88% of the pupils demonstrated on grade level understanding. In writing, only 60% of 5th grade pupils demonstrated on grade level writing skills.[135]
In 2012, Lenape Elementary School achieved AYP status. In 2011, Lenape Elementary School was in Warning AYP status due to lagging reading achievement.[136][137]
Shannock Valley Elementary School[]
Shannock Valley Elementary School is located at. In 2013, the school's enrollment was 348 pupils with 45% of pupils receiving a federal free or reduced price meals due to family poverty. According to a report by the Pennsylvania Department of Education, 100% of the teachers were rated highly qualified under No Child Left Behind. The school provides both half day and full day kindergarten through sixth grade.[138] The school is a federally designated Title I school. In 2011, Shannock Valley Elementary School employed 24 teachers yielding a student-teacher ratio of 15:1, with an enrollment of 365 pupils.[139]
- 2013 School Performance Profile
Shannock Valley Elementary School achieved a score of 81.9 out of 100. The score reflects on grade level: reading, science, writing and mathematics achievement. In 2012-13, only 75% of the students were reading on grade level in grades 3rd through 5th. In 3rd grade, 87% of the pupils were reading on grade level. In math, 83% were on grade level (3rd-5th grades). In 4th grade science, 87.7% of the pupils demonstrated on grade level understanding. In writing, only 64% of 5th grade pupils demonstrated on grade level writing skills.[140]
In 2012, Shannock Valley Elementary School declined to Warning AYP status due to lagging reading achievement.[141] In 2011, Shannock Valley Elementary School achieved AYP status.
West Hills Primary School[]
West Hills Primary School is located at 175 Heritage Park Drive, Kittanning. In 2013, the school's enrollment was 698 pupils with 45.7% of pupils receiving a federal free or reduced price meals due to family poverty. According to a report by the Pennsylvania Department of Education, 100% of the teachers were rated highly qualified under No Child Left Behind. The school provides half day and full day kindergarten through 3rd grade.[142] The school is a federally designated Title I school. The school employed 40 teachers yielding a student-teacher ratio of 16:1.[143]
- 2013 School Performance Profile
West Hills Primary School achieved a score of 81 out of 100. The score reflects on grade level: reading, science, writing and mathematics achievement. In 2012-13, only 75% of the 3rd grade pupils were reading on grade level. In math, 82% were on grade level (3rd grades).[144]
In 2011 and 2012, West Hills Primary School achieved AYP status.[145][146]
West Hills Intermediate School[]
West Hills Intermediate School is located at 175 Heritage Park Drive, Kittanning. In 2013, the school's enrollment was 515 pupils with 45.8% of pupils receiving a federal free or reduced price meals due to family poverty. According to a report by the Pennsylvania Department of Education, 100% of the teachers were rated highly qualified under No Child Left Behind. The school provides grades 4th through 6th.[147] The school is a federally designated Title I school. In 2011, West Hills Intermediate School employed 33 teachers yielding a student-teacher ratio of 15:1.[148]
- 2013 School Performance Profile
West Hills Intermediate School achieved a score of 65.2 out of 100. The score reflects on grade level: reading, science, writing and mathematics achievement. In 2012-13, only 58% of the students were reading on grade level in grades 4th through 6th. In math, 72.5% were on grade level (4th-6th grades). In 4th grade science, just 77.7% of the pupils demonstrated on grade level understanding. In writing, only 44% of 5th grade pupils demonstrated on grade level skills.[149]
In 2012, West Hills Intermediate School declined to Warning AYP status.[150] In 2011, West Hills Intermediate School achieved AYP status.
Special education[]
In December 2012, Armstrong School District administration reported that 1,072 pupils or 18.6% of the district's pupils received Special Education services, with 40.9% of the identified students having a specific learning disability.[151] In December 2009, the district administration reported that 1009 pupils or 16.9% of the district's pupils received Special Education services.[152][153]
In compliance with state and federal laws, Armstrong School District engages in identification procedures to ensure that eligible students receive an appropriate educational program consisting of special education and related services, individualized to meet student needs. At no cost to the parents, these services are provided in compliance with state and federal law; and are reasonably calculated to yield meaningful educational benefit and student progress.[154] To identify students who may be eligible for special education, various screening activities are conducted on an ongoing basis. These screening activities include: review of group-based data (cumulative records, enrollment records, health records, report cards, ability and achievement test scores); hearing, vision, motor, and speech/language screening; and review by the Special Education administration. When screening results suggest that the student may be eligible, the District seeks parental consent to conduct a multidisciplinary evaluation. Parents who suspect their child is eligible may verbally request a multidisciplinary evaluation from a professional employee of the District or contact the Special Education Office.[155]
For the 2010–11 school year, the state of Pennsylvania provided $1,026,815,000 for Special Education services. This funding is in addition to the state's basic education per pupil funding, as well as, all other state and federal funding.[156]
Armstrong School District received a $4,081,602 supplement for special education services in 2010.[157] The Pennsylvania Special Education funding system assumes that 16% of the district's students receive special education services. It also assumes that each student's needs accrue the same level of costs.[158] The state requires each district to have a three-year special education plan to meet the unique needs of its special education students.[159] Overidentification of students in order to increase state funding has been an issue in the Commonwealth. Some districts have more than 20% of its students receiving special education services while others have 10% supported through special education.[160] In 2012, the Obama Administration's US Department of Education issued a directive that schools include students with disabilities in extracurricular activities, including sports.[161]
For the 2011–2012 school year, all Pennsylvania public school districts received the same level of funding for special education that they received in 2010. This level funding is provided regardless of changes in the number of pupils who need special education services and regardless of the level of services the respective students required.[162] For the 2012–13 and 2013-14 school years, all Pennsylvania public school districts received the same level of funding for special education that they received in 2010-11. This level funding is provided regardless of changes in the number of pupils who need special education services and regardless of the level of services the respective students required.[163][164] Additionally, the state provides supplemental funding for extraordinarily impacted students. The District must apply for this added funding. in 2014-2015, Armstrong School District received $1,648,697 for special education services.
Gifted education[]
The District Administration reported that 180 or 2.97% of its students were gifted in 2009.[165] By law, the district must provide mentally gifted programs at all grade levels. The referral process for a gifted evaluation can be initiated by teachers or parents by contacting the student's building principal and requesting an evaluation. All requests must be made in writing. To be eligible for mentally gifted programs in Pennsylvania, a student must have a cognitive ability of at least 130 as measured on a standardized ability test by a certified school psychologist. Other factors that indicate giftedness will also be considered for eligibility.[166]
Budget[]
Pennsylvania public school districts budget and expend funds according to procedures mandated by the General Assembly and the Pennsylvania Department of Education (PDE). An annual operating budget is prepared by school district administrative officials. A uniform form is furnished by the PDE and submitted to the board of school directors for approval prior to the beginning of each fiscal year on July 1.
Under Pennsylvania's Taxpayer Relief Act, Act 1 of the Special Session of 2006, all school districts of the first class A, second class, third class and fourth class must adopt a preliminary budget proposal. The proposal must include estimated revenues and expenditures and the proposed tax rates. This proposed budget must be considered by the Board no later than 90 days prior to the date of the election immediately preceding the fiscal year. The preliminary budget proposal must also be printed and made available for public inspection at least 20 days prior to its adoption. The board of school directors may hold a public hearing on the budget, but are not required to do so. The board must give at least 10 days' public notice of its intent to adopt the final budget according to Act 1 of 2006.[167]
In 2013, the average teacher salary in Armstrong School District was $58,560 a year, while the cost of the benefits teachers received was $25,636 per employee (among the highest in the Commonwealth public schools), for a total annual average teacher compensation of $84,196.[168]
In 2012, the average teacher salary in Armstrong School District was $66,413.76 a year, while the cost of the benefits teachers received was $24,081 per employee (among the highest in the Commonwealth public schools), for a total annual average teacher compensation of $90,495.[169] The District employed 657 teachers with an average salary of $70,484 and a top salary of $172,521.[170] In 2012, the district's average teacher salary was $67,546 and a top salary of $160,850.[171] In 2009, the district's average teacher salary was $64,332 and a top salary of $144,500.[172]
In 2007, the Armstrong School District employed 440 teachers. The average teacher salary in the district was $57,646 for 180 days worked. The district's teachers were the highest paid in Armstrong County.[173] The average teacher salary in Pennsylvania was $54,977. As of 2007, Pennsylvania ranked in the top 10 states in average teacher salaries. When adjusted for cost of living Pennsylvania ranked fourth in the nation for teacher compensation.[174] Additionally, the teachers receive a defined benefit pension, health insurance, professional development reimbursement, paid personal days, 10 paid sick days, and many other benefits.[175]
Per pupil spending Armstrong School District's administrative costs per pupil was $846.91 in 2008. The lowest administrative cost per pupil in Pennsylvania was $398 per pupil.[176] It ranked 141st among Pennsylvania's 500 public school districts for administration spending. The Pennsylvania School Boards Association collects and maintains statistics on salaries of public school district employees in Pennsylvania. According to the association's report, the average salary for a superintendent, for the 2007-08 school year, was $122,165. Superintendents and administrators receive a benefit package commensurate with that offered to the district's teachers' union.[177] According to PSBA, the median Superintendent salary rose to over $130,000 in 2011.[178] William H. Kerr, Ed.D. was the superintendent unit 2010. He left to be the superintendent of Norwin School District.
In 2008, Armstrong School District administration reported that per pupil spending was $13,037 which ranked 174th among Pennsylvania's 501 school districts. In 2010, the District's per pupil spending had increased to $14,593.76.[179] In 2011, Pennsylvania's per pupil spending was $13,467, ranking 6th in the United States.[180] In 2007, the Pennsylvania per pupil total expenditures was reported as $12,759.[181] In 2011, Pennsylvania's per pupil spending was $13,467, ranking 6th in the United States.[180] In 2007, the Pennsylvania per pupil total expenditures was reported as $12,759.[181]
The U.S. Census Bureau reported that Pennsylvania spent $8,191 per pupil in school year 2000-01.[182] In 2007, the Pennsylvania per pupil total expenditures was reported as $12,759.[181] Among the fifty states, Pennsylvania's total per pupil revenue (including all sources) ranked 11th at $15,023 per student, in 2008-09.[183] Pennsylvania's total revenue per pupil rose to $16,186 ranking 9th in the nation in 2011.[184]
Reserves In 2011, Armstrong School District reported having over $6.18 million in reserves. Some of that was used to balance the 2011–12 school year budget.[185] The District's business manager estimated having an $5.1 million fund balance in June 2012. Armstrong School District administration reported an increase to $4,962,995 in the unreserved-undesignated fund balance. The District also reported $6,592,217 in its reserve fund in 2012. Pennsylvania public school district reserve funds are divided into two categories – designated and undesignated. The undesignated funds are not committed to any planned project. Designated funds and any other funds, such as capital reserves, are allocated to specific projects. School districts are required by state law to keep 5 percent of their annual spending in the undesignated reserve funds to preserve bond ratings. According to the Pennsylvania Department of Education, from 2003 to 2010, as a whole, Pennsylvania school districts amassed nearly $3 billion in reserved funds.[186] In 2005, the total reserve funds held by Pennsylvania public school districts was $1.9 billion.[187] By 2013, reserves held by Pennsylvania public school districts, as a whole, had increased to over $3.8 billion.[188] In 2014, Armstrong School District reported its reserves at $2,170,247.
Audit In January 2010, the Pennsylvania Auditor General conducted a performance audit of the district and school board. Multiple serious findings were reported to the school board.[189]
KOZs Five pieces of Armstrong School District-owned property were converted to tax-free Keystone Opportunity Expansion Zones. The Ford City High School building in Ford City, Kittanning Township Elementary School in Kittanning Township, Kittanning Middle School and Kittanning High School in Kittanning, and 144.7 acres in East Franklin's West Hills Industrial Park campus was designated Keystone Opportunity Expansion Zones, after receiving approval from each of the impacted municipalities, the Armstrong School District board also needed the approval of the Armstrong County Commissioners. Several of the public school buildings are to close after the 2014-15 school year in preparation for the new Armstrong Junior-Senior High School in Manor Township. In Pennsylvania Keystone Opportunity Zones, multiple taxes, including state corporate net income tax, state capital stock and foreign franchise tax, state personal income tax, state sales and use tax, local earned income and net profits tax, local business gross receipts, business occupancy, business privilege and mercantile tax, and local property, sales and use taxes, are waived.[190][191]
Property tax abatement The Board of School Directors of Armstrong School District approved a Tax Abatement Program on January 28, 2002 (renewed in 2005, 2007, and 2009) that allows for the exemption of certain real estate property taxes. The abatement provides 100% relief of the Armstrong School District real property tax on the assessed value of improvements to unimproved residential property located within the Armstrong School District. It lasts for two years.
Tuition Students who live in the District's attendance area may choose to attend one of Pennsylvania's 157 public charter schools. A student living in a neighboring public school district or a foreign exchange student may seek admission to Armstrong School District. For these cases, the Pennsylvania Department of Education sets an annual tuition rate for each school district. It is the amount the public school district pays to a charter school for each resident student that attends the charter and it is the amount a nonresident student's parents must pay to attend the Armstrong School District's schools. The 2012 tuition rates are Elementary School - $9,207.03, High School - $11,468.59.[192] In 2013, Armstrong School District received $39,350 in tuition payments.[193]
Armstrong School District is funded by a combination of: a local earned income tax 1%, a property tax, a real estate transfer tax 0.5%, per capita taxes, coupled with substantial funding from the Commonwealth of Pennsylvania and the federal government. Grants can provide an opportunity to supplement school funding without raising local taxes.[194] Grants can provide an opportunity to supplement school funding without raising local taxes. Interest earnings on accounts also provide nontax income to the District. In the Commonwealth of Pennsylvania, pension income and Social Security income are exempted from state personal income tax and local earned income tax, regardless of the level of the individual's personal wealth.[195] The average Pennsylvania public school teacher pension in 2011 exceeds $60,000 a year plus they receive federal Social Security benefits: both are free of Pennsylvania state income tax and local income tax which funds local public schools.[196]
State basic education funding[]
According to a report from Representative Todd Stephens office, School District receives 55.5% of its annual revenue from the state.[197]
For the 2014-15 school year, Armstrong School District will receive $6,008,715 in State Basic Education funding. The District will also receive $227,314 in new Ready To Learn Block grant. The State's enacted Education Budget includes $5,526,129,000 for the 2014-2015 Basic Education Funding.[198] The Education budget also includes Accountability Block Grant funding at $100 million and $241 million in new Ready to Learn funding for public schools that focus on student achievement and academic success. The State is paying $500.8 million to Social Security on the school employees behalf and another $1.16 billion to the state teachers pension system (PSERS). In total, Pennsylvania's Education budget for K-12 public schools is $10 billion. This was a $305 million increase over 2013-2014 state spending and the greatest amount ever allotted by the Commonwealth for its public schools.[199]
For the 2013-14 school year, the Armstrong School District received a 1.4% increase or $28,492,036 in Pennsylvania Basic Education Funding. This is $395,158 more than its 2012-13 state BEF to the District. Additionally, Armstrong School District received $473,482 in Accountability Block Grant funding to focus on academic achievement and level funding for special education services. Among the public school districts in Armstrong County, Freeport Area School District received the highest percentage increase in BEF at 2%. The District has the option of applying for several other state and federal grants to increase revenues. The Commonwealth's budget increased Basic Education Funding statewide by $123 million to over $5.5 billion. Most of Pennsylvania's 500 public school districts received an increase of Basic Education Funding in a range of 0.9% to 4%. Eight public school districts received exceptionally high funding increases of 10% to 16%. The highest increase in state funding was awarded to Austin Area School District which received a 22.5% increase in Basic Education Funding.[200] The highest percent of state spending per student is in the Chester-Upland district, where roughly 78 percent comes from state coffers. In Philadelphia, it is nearly 49 percent.[201] As a part of the education budget, the state provided the PSERS (Pennsylvania school employee pension fund) with $1,017,000,000 and Social Security payments for school employees of $495 million.[202]
For the 2012-13 school year, the Armstrong School District received $28,096,878.[203] The Governor's Executive Budget for 2012-2013 included $9.34 billion for kindergarten through 12th grade public education, including $5.4 billion in basic education funding, which was an increase of $49 million over the 2011-12 budget. In addition, the Commonwealth provided $100 million for the Accountability Block Grant (ABG) program. Armstrong School District received $473,482 in Accountability Block Grant funding to focus on academic achievement. The state also provided a $544.4 million payment for School Employees' Social Security and $856 million for School Employees' Retirement fund called PSERS.[204] This amount was a $21,823,000 increase (0.34%) over the 2011-2012 appropriations for Basic Education Funding, School Employees' Social Security, Pupil Transportation, Nonpublic and Charter School Pupil Transportation. Since taking office, Corbett's first two budgets have restored more than $918 million in support of public schools, compensating for the $1 billion in federal stimulus dollars lost at the end of the 2010-11 school year.
In 2011–12 school year, Armstrong School District received $28,096,880 in state Basic Education Funding.[205][206] Additionally, the District received $473,482 in Accountability Block Grant funding. The enacted Pennsylvania state Education budget includes $5,354,629,000 for the 2011–2012 Basic Education Funding appropriation. This amount is a $233,290,000 increase (4.6%) over the enacted State appropriation for 2010–2011. The highest increase in state basic education funding was awarded to Duquesne City School District, which got a 49% increase in state funding for 2011-12.[207]
In 2010, the District reported that 2,403 pupils received a free or reduced-price lunch due to their family meeting the federal poverty level.
For the 2010–11 budget year, the Armstrong School District received a base 2% increase in state basic education funding for a total of $29,290,465. Freeport Area School District received the highest increase in Armstrong County at 5.43%. One hundred fifty school districts in Pennsylvania received the 2% base increase for budget year 2010–11. The highest increase in the state was awarded to Kennett Consolidated School District of Chester County which was given a 23.65% increase in state basic education funding.[208] Fifteen (15) Pennsylvania public school districts received a BEF increase of greater than 10%. The state's hold harmless policy regarding state basic education funding continued where each district received at least the same amount as it received the prior school year, even when enrollment had significantly declined. The amount of increase each school district received was set by Governor Edward Rendell and then Secretary of Education Gerald Zahorchak, as a part of the state budget proposal given each February. This was the second year of Governor Rendell's policy to fund some public school districts at a far greater rate than others.[209]
In the 2009–2010 budget year, the Commonwealth of Pennsylvania provided the Armstrong School District a 2.20% increase in Basic Education Funding for a total of $28,716,028. This was the lowest percentage point increase, in Basic Education Funding, for the school districts in Armstrong County. Two county school districts received increases of over 5% in Basic Education Funding. Sixteen school districts in Pennsylvania received an increase of over 10% in 2009. The Muhlenberg School District of Berks County received an increase of 22.31% in 2009–10. The amount of increase each school district received was set by Governor Edward G. Rendell and the Secretary of Education Gerald Zahorchak, as a part of the state budget proposal.[210]
The state Basic Education Funding to the district in 2008–09 was $28,096,880.[211] According to the Pennsylvania Department of Education, 2,366 students received free or reduced-price lunches due to low family income in the 2007–08 school year.[212] According to the U.S. Census Bureau, Pennsylvania spent $7,824 Per Pupil in the year 2000. This amount increased up to $12,085 by the year 2008.[213][214]
Accountability Block Grant[]
The state provides additional education funding to schools in the form of Accountability Block Grants. The use of these funds is strictly focused on specific state approved uses designed to improve student academic achievement. Armstrong School District uses its $1,285,148 to fund reduce class size K-3rd, to pay teachers to attend training to improve their instruction and to fund full-day kindergarten. These annual funds are in addition to the state's basic education funding.[215] Schools Districts apply each year for Accountability Block Grants.[216] In 2009–10, the state provided $271.4 million in Accountability Block grants $199.5 million went to providing all-day kindergartens.[217]
Classrooms for the Future grant[]
The Classroom for the Future state program provided districts with hundreds of thousands of extra state funding to buy laptop computers for each core curriculum high school class (English, Science, History, Mathematics) and paid for teacher training to optimize the computers use. The program was funded from 2006–2009. Armstrong School District did not apply in 2006–07. In 2007–08 the district received $413,503 in funding. For the 2008–09, school year the district received a final $181,651 for a total funding of $595,154. Of the 501 public school districts in Pennsylvania, 447 of them received Classrooms for the Future grant awards.[218] The highest funding statewide was awarded to Philadelphia City School District in Philadelphia County - $9,409,073. The grant program was discontinued by Governor Edward Rendell as part of the 2009-10 state budget.
Other grants[]
The Armstrong School District did not participate in: Pennsylvania Department of Environmental Protection's Environmental Education annual grants, PA Science Its Elementary grants (discontinued effective with 2009-10 budget by Governor Rendell), Education Assistance Grants, 2012 Striving Readers Comprehensive Literacy grant, 2012 and 2013 nor Pennsylvania Hybrid Learning Grants,[219] nor the federal 21st Century Learning grants.
Federal Stimulus funding[]
The Armstrong School District received an extra $5,641,209 in ARRA – Federal Stimulus money to be used in specific programs like special education and meeting the academic needs of low-income students.[220] The funding was limited to the 2009–10 and 2010-2011 school years.[221] Due to the temporary nature of the funding, schools were repeatedly advised to use the funds for one time expenditures like: acquiring equipment, making repairs to buildings, training teachers to provide more effective instruction or purchasing books and software.
Race to the Top[]
Armstrong School District officials applied for the Race to the Top federal grant. When approved for the grant, the district will receive millions of additional federal dollars for improving student academic achievement.[222] Participation required the administration, the school board and the local teachers' union to sign an agreement to prioritize improving student academic success. In Pennsylvania, 120 public school districts and 56 charter schools agreed to participate.[223] In Pennsylvania, 120 public school districts and 56 charter schools agreed to participate.[224] Pennsylvania was not approved for the grant. The failure of districts to agree to participate was cited as one reason that Pennsylvania was not approved.[225]
Enhancing Education Through Technology grant[]
In February, 2010, the District received a $259,200 federal grant from the Enhancing Education Through Technology competitive grant program. Armstrong School District used the money to buy laptop computers, interactive whiteboards, and other innovative technologies to enhance instruction and administrative functions. The Federal Enhancing Education Through Technology was targeted at schools with higher levels of low income pupils.[226]
Common Cents state initiative[]
Armstrong School District School Board chose to not participate in the Pennsylvania Department of Education Common Cents program. The program called for the state to audit the district, at no cost to local taxpayers, to identify ways the district could save tax dollars.[227] After the review of the information, the district was not required to implement the recommended cost savings changes. The report found multiple opportunities for savings.
Real estate taxes[]
Property tax rates in 2013–2014 were set by the Armstrong School Board at: Armstrong County residents – 56.6448 mills and the residents in Indiana County was 160.8425 mills.[185] School districts located in more than one county are required to apportion the tax levy based on the market value in each county as determined by the State Tax Equalization Board pursuant to section 672.1 of the School Code. As a result, the tax rate increases are not the same for each county in a multi-county school district.[228] A mill is $1 of tax for every $1,000 of a property's assessed value. Irregular property reassessments have become a serious issue in the commonwealth as it creates a significant disparity in taxation within a community and across a region. Property taxes, in the Commonwealth of Pennsylvania, apply only to real estate – land and buildings. The property tax is not levied on cars, business inventory, or other personal property. Certain types of property are exempt from property taxes, including: places of worship, places of burial, private social clubs, charitable and educational institutions and government property. Additionally, service related, disabled US military veterans may seek an exemption from paying property taxes. Pennsylvania school district revenues are dominated by two main sources: 1) Property tax collections, which account for the vast majority (between 75–85%) of local revenues; and 2) Act 511 tax collections, which are around 15% of revenues for school districts.[229]
|
|
The average yearly property tax paid by Armstrong County residents amounts to about 3.35% of their yearly income. Armstrong County ranked 434th out of the 3143 United States counties for property taxes as a percentage of median income.[236] According to a report prepared by the Pennsylvania Department of Education, the total real estate taxes collected by all school districts in Pennsylvania rose from $6,474,133,936 in 1999-00 to $10,438,463,356 in 2008-09 and to $11,153,412,490 in 2011.[237] Property taxes in Pennsylvania are relatively high on a national scale. According to the Tax Foundation, Pennsylvania ranked 11th in the U.S. in 2008 in terms of property taxes paid as a percentage of home value (1.34%) and 12th in the country in terms of property taxes as a percentage of income (3.55%).[238]
Act 1 Adjusted index[]
The Act 1 of 2006 Index regulates the rates at which each school district can raise property taxes in Pennsylvania. Districts are not allowed to raise taxes above that index unless they allow voters to vote by referendum, or they seek an exception from the state Department of Education. The base index for the 2010–2011 school year is 2.9 percent, but the Act 1 Index can be adjusted higher, depending on a number of factors, such as property values and the personal income of district residents. Act 1 included 10 exceptions, including: increasing pension costs, increases in special education costs, a catastrophe like a fire or flood, increase in health insurance costs for contracts in effect in 2006 or dwindling tax bases. The base index is the average of the percentage increase in the statewide average weekly wage, as determined by the PA Department of Labor and Industry, for the preceding calendar year and the percentage increase in the Employment Cost Index for Elementary and Secondary Schools, as determined by the Bureau of Labor Statistics in the U.S. Department of Labor, for the previous 12-month period ending June 30. For a school district with a market value/personal income aid ratio (MV/PI AR) greater than 0.4000, its index equals the base index multiplied by the sum of .75 and its MV/PI AR for the current year.[239]
The School District Adjusted Index for the Armstrong School District 2006–2007 through 2011–2012.[240]
|
|
For the 2013-14 budget year, Armstrong School Board applied for an exception to exceed their Act 1 Index limit due to the rapidly escalating cost of the teacher's pensions. For the school budget year 2013-14, 311 Pennsylvania public school districts adopted a resolution certifying that tax rates would not be increased above their index. Another 171 school districts adopted a preliminary budget leaving open the option of exceeded the Index limit. For the exception for pension costs, 89 school districts received approval to exceed the Index in full while others received a partial approval of their request. For special education costs, 75 districts received approval to exceed their tax limit. For the pension costs exception, 169 school districts received approval to exceed the Index. Eleven Pennsylvania public school districts received an approval for grandfathered construction debts.[244]
For the 2012-13 budget year, Armstrong School Board did not apply for exceptions to exceed the Act 1 Index. For 2012-2013, 274 school districts adopted a resolution certifying that tax rates would not be increased above their index; 223 school districts adopted a preliminary budget leaving open the option of exceeded the Index limit. For the exception for pension costs, 194 school districts received approval to exceed the Index. For special education costs, 129 districts received approval to exceed the tax limit.[245]
For the 2011–12 school year, the Armstrong School Board did not apply for exceptions to exceed the Act 1 Index. Each year the Armstrong School Board has the option of adopting either 1) a resolution in January certifying they will not increase taxes above their index or 2) a preliminary budget in February. A school district adopting the resolution may not apply for referendum exceptions or ask voters for a tax increase above the inflation index. A specific timeline for these decisions is publisher each year by the Pennsylvania Department of Education.[246]
According to a state report, for the 2011–2012 school year budgets, 247 school districts adopted a resolution certifying that tax rates would not be increased above their index; 250 school districts adopted a preliminary budget. Of the 250 school districts that adopted a preliminary budget, 231 adopted real estate tax rates that exceeded their index. Tax rate increases in the other 19 school districts that adopted a preliminary budget did not exceed the school district's index. Of the districts who sought exceptions 221 used the pension costs exemption and 171 sought a Special Education costs exemption. Only 1 school district sought an exemption for Nonacademic School Construction Project, while 1 sought an exception for Electoral debt for school construction.[247]
in 2009–10 and in 2010–11 Armstrong School Board did not apply for exceptions to exceed the Act 1 index. This limited their ability to raise property taxes to the amount of increase set by the State in the Act 1 Index.[248][249] In the Spring of 2010, 135 Pennsylvania school boards asked to exceed their adjusted index. Approval was granted to 133 of them and 128 sought an exception for pension costs increases.[250]
Property tax relief[]
In 2013, 12,248 approved residential property owners in the Armstrong School District received a $293 Property Tax Relief reduction in their property taxes.[251] In 2011, 12,365 approved residential property owners received a $290 Property Tax Relief reduction in their property taxes.[252] In 2009, the Homestead/Farmstead Property Tax Relief from gambling for the Armstrong School District was $303 per approved permanent primary residence. In the district, 11,855 property owners applied for the tax relief. The relief was subtracted from the total annual school property tax bill. Property owners apply for the relief through the county Treasurer's office. Farmers can qualify for a farmstead exemption on building used for agricultural purposes. The farm must be at least 10 contiguous acres and must be the primary residence of the owner. Farmers can qualify for both the homestead exemption and the farmstead exemption. In Armstrong County, 77.33% of eligible property owners applied for property tax relief in 2009. In Indiana County, 65% of residents applied for property tax relief.[253]
Additionally, the Pennsylvania Property Tax/Rent Rebate program is provided for low income Pennsylvanians aged 65 and older; widows and widowers aged 50 and older; and people with disabilities age 18 and older. The income limit is $35,000 for homeowners. The maximum rebate for both homeowners and renters is $650. Applicants can exclude one-half (1/2) of their Social Security income, so people who make substantially more than $35,000 may still qualify for a rebate. Individuals must apply annually for the rebate. This can be taken in addition to Homestead/Farmstead Property Tax Relief.
Closed schools[]
In 2000, the Armstrong School Board closed several schools due to declining enrollment: Dayton Jr/Sr High School and Shannock Valley Jr/Sr High School.
- East Franklin Elementary School
- North Buffalo Elementary School
- Worthington High School (Closed 1980s)
- East Brady Jr/Sr High School (Closed, early 1990s, partially consolidated with Kittanning High School, other students sent to Karns City Jr/Sr High School in the Karns City School District)
- Elderton Jr/Sr High School Closed June 2012 see page for more information
- Kittanning Township Elementary School - students shifted to Lenape Elementary in Ford City (closed 2012)
- Kittanning Senior High School - Closed 2015
- Ford City Junior Senior High School - Closed 2015
- Kittanning Junior High School - Closed 2015
Extracurriculars[]
The Armstrong School District offers a wide variety of clubs, activities and an extensive junior high and high school sports program. In 2013, Armstrong School District spent over $1.5 million for activities (not including facilities costs or transportation). In 2014, Armstrong School District spent over $1.8 million for activities (not including facilities costs or transportation).[254] The total revenue received by the district from all activities was only $107,500 in 2013.[255] The district is especially challenged because it operates multiple high schools there by duplicating sports teams and the associated costs like coaches salaries, officials salaries, transportation, facilities and their maintenance, administration, uniforms and so on. Armstrong School Board determines eligibility policies to participate in these programs.[256][257] When the planned high school and junior high school consolidation occurs in 2014-15, some duplicate teams will be eliminated.
By Pennsylvania law, all K-12 students in the district, including those who attend a private nonpublic school, cyber charter school, charter school and those homeschooled, are eligible to participate in the extracurricular programs, including all athletics. They must meet the same eligibility rules as the students enrolled in the district's schools.[258]
According to Pennsylvania's Safety in Youth Sports Act, all sports coaches, paid and volunteer, are required to annually complete the Concussion Management Certification Training and present the certification before coaching.[259][260]
See also[]
References[]
- ^ John A Zenone Armstrong School District Administration, Armstrong School District 2014-15 General Fund Budget, June 26, 2014
- ^ National Center for Education Statistics, Common Core of Data - Armstrong School District 2010, 2012
- ^ NCES, Common Core of Data - Armstrong School District, 2014
- ^ Pennsylvania Department of Education, School Performance Profile - Armstrong School District Fast Facts 2013, 2013
- ^ Pennsylvania Department of Education, Enrollment and Projections, 2010
- ^ US Census Bureau, 2010 Census Poverty Data by Local Education Agency, 2011
- ^ American Fact Finder, US Census Bureau, 2009
- ^ Pennsylvania School Code 2009
- ^ The Commonwealth Foundation for Public Policy Alternatives. "The Pennsylvania Project". Archived from the original on July 16, 2011. Retrieved May 20, 2010.CS1 maint: uses authors parameter (link)
- ^ "Archived copy". Archived from the original on February 27, 2009. Retrieved April 6, 2009.CS1 maint: archived copy as title (link)
- ^ Schools Have High Dropout Rates, WPIX.com, October 29, 2007 accessed March 2010
- ^ Pittsburgh Business Times (April 11, 2014). "Guide to Pennsylvania Schools Statewide School District Ranking 2014".
- ^ Pittsburgh Business Times (April 11, 2014). "What makes up a district's School Performance Profile score?".
- ^ Pittsburgh Business Times (April 5, 2013). "Guide to Pennsylvania Schools Statewide ranking 2013".
- ^ "Statewide Honor Roll Rankings 2013". Pittsburgh Business Times. April 5, 2013.
- ^ Pittsburgh Business Times (May 14, 2011). "Statewide Honor Roll Ranking,". Archived from the original on July 23, 2011.
- ^ Statewide Honor Roll Ranking, Pittsburgh Business Times, May 14, 2010
- ^ Pittsburgh Business Times (May 1, 2009). "Statewide Honor Roll Ranking,".
- ^ Pittsburgh Business Times (May 23, 2007). "Pennsylvania Public School Rankings".
- ^ Pittsburgh Business Times, Statewide Overachivers Ranking Information, April 4, 2013
- ^ "Overachiever statewide ranking". Pittsburgh Business Times. May 6, 2010.
- ^ Pittsburgh Business Times (April 5, 2013). "Western Pennsylvania School District Rankings".
- ^ Pennsylvania Department of Education, Armstrong School District Profile 2013, October 2013
- ^ Pennsylvania Department of Education (September 21, 2012). "Armstrong School District AYP Data Table 2012". Archived from the original on March 19, 2014.
- ^ Pennsylvania Department of Education (September 29, 2011). "ARMSTRONG School District AYP Data Table". Archived from the original on March 19, 2014.
- ^ Pennsylvania Department of Education (March 15, 2011). "New 4-year Cohort Graduation Rate Calculation Now Being Implemented". Archived from the original on September 14, 2010.
- ^ Pennsylvania Department of Education (2010). "Armstrong School District Report Card 2010" (PDF).[permanent dead link]
- ^ Armstrong School District Report Card 2009 "Archived copy". Archived from the original on July 19, 2011. Retrieved March 12, 2010.CS1 maint: archived copy as title (link)
- ^ The Times Tribune (2009). "Armstrong County School District Graduation rates 2008".
- ^ Pennsylvania Partnership for Children (2008). "PA High School Graduation Info by School District 2007". Archived from the original on November 5, 2012.
- ^ Ensuring Success for All High School Graduates. Pennsylvania Partnerships for Children. September 5, 2007
- ^ Pennsylvania Department of Education (September 21, 2012). "Armstrong School District AYP results". Archived from the original on July 19, 2011.
- ^ Jump up to: a b Pennsylvania Department of Education (September 29, 2012). "2011-2012 PSSA and AYP Results".
- ^ Jump up to: a b c Pennsylvania Department of Education (September 29, 2011). "2010-2011 PSSA and AYP Results".
- ^ Jump up to: a b c d e "How is your school doing?". Pittsburgh Post-Gazette. October 15, 2012.
- ^ Pennsylvania Department of Education (2009). "2009 PSSAs: Reading, Math, Writing and Science Results".
- ^ Pennsylvania Department of Education (September 21, 2012). "Armstrong School District Academic Achievement Report Card 2012" (PDF). Archived from the original (PDF) on March 19, 2014.
- ^ Jump up to: a b c Pennsylvania Department of Education (September 29, 2011). "2010-2011 PSSA results in Science".
- ^ The Times-Tribune (2009). "Grading Our Schools database, 2009 Science PSSA results,".
- ^ Armstrong School Board, Program of Studies 2013-14, 1023
- ^ Pennsylvania State Board of Education. "Pennsylvania Code §4.24 (a) High school graduation requirements".
- ^ Pennsylvania State Board of Education, Proposed changes to Chapter 4, May 10, 2012
- ^ Pennsylvania Department of Education (2010). "Keystone Exam Overview" (PDF).
- ^ Megan Harris (September 12, 2013). "Pennsylvania changing high school graduation requirements". Tribune Live.
- ^ Pennsylvania Department of Education (September 2011). "Pennsylvania Keystone Exams Overview". Archived from the original on March 17, 2012.
- ^ Pennsylvania State Board of Education (2010). "Rules and Regulation Title 22 PA School Code CH. 4".
- ^ Pennsylvania Department of Education, State Board of Education Finalizes Adoption of Pennsylvania Common Core State Academic Standards and High School Graduation Requirements, March 14, 2013
- ^ Pennsylvania Department of Education (2011). "Keystone Exams".
- ^ Pennsylvania Department of Education, Professional Qualifications of Teachers Ford City Junior Senior High School 2012, September 21, 2012
- ^ National Center for Education Statistics, Common Core Data - Ford City Junior Senior High School, 2010
- ^ Pennsylvania Department of Education, Professional Qualifications of Teachers High School 2012, September 21, 2012
- ^ Pennsylvania Department of Education (October 4, 2013). "Ford City Junior Senior High School Academic Performance Data 2013".
- ^ Pennsylvania Department of Education (September 21, 2012). "Ford City Junior Senior High School AYP Overview 2012". Archived from the original on July 19, 2011.
- ^ Pennsylvania Department of Education (September 29, 2011). "Ford City Junior Senior High School AYP Overview". Archived from the original on July 19, 2011.
- ^ Pennsylvania Department of Education, Ford City Junior Senior High School AYP Overview 2010, October 20, 2010
- ^ Pennsylvania Department of Education, AYP History by School 2003-2012, 2013
- ^ Pennsylvania Department of Education (September 21, 2012). "Ford City Junior Senior High School AYP Data Table 2012". Archived from the original on March 19, 2014.
- ^ Pennsylvania Department of Education, Ford City Junior Senior High School AYP Data Table 2011, September 29, 2011
- ^ Pennsylvania Department of Education, Ford City Junior Senior High School Academic Achievement Report Card 2010, October 20, 2010
- ^ Pennsylvania Department of Education, Ford City Junior Senior High School Academic Achievement Report Card 2009, September 14, 2009
- ^ Pennsylvania Department of Education, Ford City Junior Senior High School Academic Achievement Report Card 2008, August 15, 2008
- ^ Jump up to: a b Pennsylvania Department of Education (2010). "2009–2010 PSSA and AYP Results".
- ^ Jump up to: a b The Times-Tribune. (September 2009). "Grading Our Schools database, 2009 PSSA results,".
- ^ Pennsylvania Department of Education (September 29, 2011). "FORD CITY Junior Senior High School Academic Achievement Report Card 2011" (PDF).[permanent dead link]
- ^ Pennsylvania Department of Education (August 2008). "2007–2008 PSSA and AYP Results".
- ^ Pennsylvania Department of Education (2007). "PSSA Math and Reading results".
- ^ Pennsylvania Department of Education (September 21, 2012). "Ford City Junior Senior High School Academic Achievement Report Card 2012" (PDF). Archived from the original (PDF) on March 20, 2014.
- ^ Pittsburgh Business Times (April 5, 2013). "Upper St. Clair's Fort Couch Middle School tops among eighth-grade schools".
- ^ Jump up to: a b c The Rankings: Eighth grade, Pittsburgh Business Times, May 15, 2009.
- ^ Jump up to: a b c Pennsylvania Department of Education Report (September 14, 2010). "2010 PSSAs: Reading, Math, Writing Results".
- ^ Pennsylvania Department of Education. "2009 PSSAs: Reading, Math, Writing and Science Results".
- ^ Pennsylvania Department of Education (August 18, 2009). "Science PSSA 2009 by Schools Report".
- ^ Jump up to: a b Pittsburgh Business Times (April 5, 2013). "USC's Fort Couch Middle School top scorer among seventh-grade schools".
- ^ Pennsylvania Department of Education, Professional Qualifications of Teachers Kittanning Senior High School 2013, October 3, 2013
- ^ National Center for Education Statistics, Common Core Data - High School, 2010
- ^ Pennsylvania Department of Education, Professional Qualifications of Teachers Kittanning Senior High School 2012, September 21, 2012
- ^ Pennsylvania Department of Education (October 4, 2013). "Kittanning Senior High School Academic Performance Data 2013".
- ^ Pennsylvania Department of Education (September 21, 2012). "Kittanning Senior High School AYP Data Table 2012". Archived from the original on February 11, 2012.
- ^ Pennsylvania Department of Education, Kittanning Senior High School AYP Data Table 2011, September 29, 2011
- ^ Pennsylvania Department of Education, Kittanning Senior High School AYP Data Table 2010, October 20, 2010
- ^ Pennsylvania Department of Education (2009). "Kittanning Senior High School Academic Achievement Report Card 2009". Archived from the original on July 19, 2011.
- ^ Pittsburgh Business Times, The Rankings: Eleventh grade, April 5, 2013.
- ^ Pennsylvania Department of Education (September 21, 2012). "KITTANNING Senior High School AYP Overview 2012". Archived from the original on July 19, 2011.
- ^ Pennsylvania Department of Education, KITTANNING Senior High School AYP Overview 2011, September 29, 2011
- ^ Pennsylvania Department of Education, KITTANNING Senior High School Academic Achievement Report Card 2011, September 29, 2011
- ^ The Times-Tribune (September 20, 2009). "Grading Our Schools database, 2009 PSSA results".
- ^ Pennsylvania Department of Education, Kittanning Senior High School Academic Achievement Report Card 2010, October 27, 2010
- ^ Pennsylvania Department of Education, Kittanning Senior High School Academic Achievement Report Card 2009, September 14, 2009
- ^ Pennsylvania Department of Education, Kittanning Senior High School Academic Achievement Report Card 2008, August 15, 2008
- ^ Pennsylvania Department of Education, Kittanning Senior High School Academic Achievement Report Card 2007, 2007
- ^ Pennsylvania Department of Education (September 21, 2012). "Kittanning Senior High School Academic Achievement Report Card 2012" (PDF).[permanent dead link]
- ^ PDE, School Performance Profile - Academic Performance Data - Kittanning Senior High School, December 2013
- ^ Pennsylvania Department of Education (October 4, 2013). "Kittanning Junior High School Fast Facts 2013".
- ^ Pennsylvania Department of Education, Professional Qualifications of Teachers Kittanning Junior High School, October 4, 2013
- ^ National Center for Education Statistics, Common Core Data – Kittanning Junior High School, 2011
- ^ Pennsylvania Department of Education, Professional Qualifications of Teachers Kittanning Junior High School, September 21, 2012
- ^ Pennsylvania Department of Education (October 4, 2013). "Kittanning Junior High School Academic Performance Data 2013,".
- ^ Pennsylvania Department of Education (September 21, 2012). "Kittanning Junior High School AYP Overview 2012". Archived from the original on September 7, 2012.
- ^ Pennsylvania Department of Education, Kittanning Junior High School AYP Overview 2011, September 29, 2011
- ^ Pittsburgh Business Times (April 5, 2013). "The Rankings: Eighth grade,".
- ^ Pennsylvania Department of Education, Kittanning Area Junior High School Academic Achievement Report Card 2011, September 29, 2011
- ^ Pennsylvania Department of Education, Kittanning Area Junior High School Academic Achievement Report Card 2010, October 20, 2010
- ^ Pennsylvania Department of Education, Kittanning Area Junior High School Academic Achievement Report Card 2009, September 14, 2009
- ^ Pennsylvania Department of Education (September 21, 2012). "Kittanning Junior High School Academic Achievement Report Card 2012" (PDF).[permanent dead link]
- ^ Pennsylvania Department of Education (October 10, 2009). "2009 PSSAs: Reading, Math, Writing and Science Results".
- ^ Pennsylvania Department of Education Report (August 10, 2009). "Science PSSA 2009 by Schools".
- ^ Pennsylvania Department of Education (October 4, 2013). "West Shamokin Junior Senior High School Fast Facts 2013".
- ^ Pennsylvania Department of Education, Professional Qualifications of Teachers West Shamokin Junior Senior High School, October 4, 2013
- ^ National Center for Education Statistics, Common Core Data – West Shamokin Junior Senior High School, 2011
- ^ Pennsylvania Department of Education, Professional Qualifications of Teachers West Shamokin Junior Senior High School, September 21, 2012
- ^ Pennsylvania Department of Education (September 29, 2011). "WEST SHAMOKIN Junior Senior High School AYP Data Table". Archived from the original on July 19, 2011.
- ^ Pennsylvania Department of Education, WEST SHAMOKIN JSHS School AYP Data Table, October 10, 2010
- ^ Pennsylvania Department of Education, West Shamokin Junior Senior High School Academic Achievement Report Card 2009, 2009
- ^ Pennsylvania Department of Education (September 29, 2011). "WEST SHAMOKIN Junior Senior High School - School AYP Overview". Archived from the original on September 7, 2012.
- ^ Pennsylvania Department of Education (2011). "WEST SHAMOKIN Junior Senior High School Academic Achievement Report Card 2011" (PDF).[permanent dead link]
- ^ Pennsylvania Department of Education, WEST SHAMOKIN JSHS Academic Achievement Report Card 2010, October 20, 2010
- ^ Pennsylvania Department of Education Report (August 2010). "Science PSSA 2010 by Schools".
- ^ "Archived copy". Archived from the original on August 28, 2009. Retrieved July 14, 2009.CS1 maint: archived copy as title (link)
- ^ "Archived copy". Archived from the original on October 17, 2014. Retrieved September 9, 2017.CS1 maint: archived copy as title (link) Pennsylvania Department of Education – Dual Enrollment Guidelines.
- ^ Pennsylvania Transfer and Articulation Agreement. Site accessed March 2010. http://www.patrac.org/
- ^ Pennsylvania College Remediation Report https://www.scribd.com/doc/23970364/Pennsylvania-College-Remediation-Report[permanent dead link]
- ^ National Center for Education Statistics
- ^ Pennsylvania Department of Education, School Performance Profile, Dayton Elementary School Fast Facts, 2013
- ^ National Center for Education Statistics, Common Core Data – Dayton Elementary School, 2011
- ^ Pennsylvania Department of Education (October 4, 2013). "Dayton Elementary School Academic Performance Data 2013".
- ^ Pennsylvania Department of Education (September 21, 2012). "Dayton Elementary School AYP Overview,". Archived from the original on March 19, 2014.
- ^ Pennsylvania Department of Education (September 21, 2012). "Dayton Elementary School Academic Achievement Report Card 2012," (PDF). Archived from the original (PDF) on March 24, 2014.
- ^ Pennsylvania Department of Education, School Performance Profile, Elderton Elementary School Fast Facts, 2013
- ^ National Center for Education Statistics, Common Core Data – Elderton Elementary School, 2011
- ^ Pennsylvania Department of Education (October 4, 2013). "Elderton Elementary School Academic Performance Data 2013".
- ^ Pennsylvania Department of Education, Elderton Elementary School AYP Overview 2012, September 21, 2012
- ^ Pennsylvania Department of Education (September 21, 2013). "Elderton Elementary School Academic Achievement Report Card 2012" (PDF). Archived from the original (PDF) on March 24, 2014.
- ^ Pennsylvania Department of Education, School Performance Profile, Lenape Elementary School Fast Facts, 2013
- ^ National Center for Education Statistics, Common Core Data – Lenape Elementary School, 2011
- ^ Pennsylvania Department of Education (October 4, 2013). "Lenape Elementary School Academic Performance Data 2013".
- ^ Pennsylvania Department of Education, Lenape Elementary School AYP Overview, September 21, 2012
- ^ Pennsylvania Department of Education (September 21, 2012). "Lenape Elementary School Academic Achievement Report Card 2012" (PDF). Archived from the original (PDF) on March 24, 2014.
- ^ Pennsylvania Department of Education, School Performance Profile, Shannock Valley Elementary School Fast Facts, 2013
- ^ National Center for Education Statistics, Common Core Data – Shannock Valley Elementary School, 2011
- ^ Pennsylvania Department of Education (October 4, 2013). "Shannock Valley Elementary School Academic Performance Data 2013".
- ^ Pennsylvania Department of Education, Elementary School AYP Overview, September 21, 2012
- ^ Pennsylvania Department of Education, School Performance Profile, West Hills Primary School Fast Facts, 2013
- ^ National Center for Education Statistics, Common Core Data – West Hills Primary School, 2011
- ^ Pennsylvania Department of Education (October 4, 2013). "West Hills Primary School Academic Performance Data 2013".
- ^ Pennsylvania Department of Education, West Hills Primary School AYP Overview 2012, September 21, 2012
- ^ Pennsylvania Department of Education (September 21, 2012). "West Hills Primary School AYP Overview 2012," (PDF). Archived from the original (PDF) on March 4, 2016.
- ^ Pennsylvania Department of Education, School Performance Profile, West Hills Intermediate School Fast Facts, 2013
- ^ National Center for Education Statistics, Common Core Data – West Hills Intermediate School, 2011
- ^ Pennsylvania Department of Education (October 4, 2013). "West Hills Intermediate School Academic Performance Data 2013".
- ^ Pennsylvania Department of Education, West Hills Intermediate School AYP Overview, September 21, 2012
- ^ Pennsylvania Bureau of Special Education Services (2011–2012). "Armstrong School District Special Education Data Report LEA Performance on State Performance Plan (SPP) Targets" (PDF). Archived from the original (PDF) on March 24, 2014.
- ^ Pennsylvania Bureau of Special Education Services (2010). "Mercer Area SD Special Education Data Report LEA Performance on State Performance Plan (SPP) Targets". Archived from the original on August 24, 2011.
- ^ Pennsylvania House Majority Policy Committee (2010). "PA House Majority Policy Committee May 12, 2010 Hearing Testimony and Handouts". Archived from the original on October 17, 2014.
- ^ Pennsylvania Bureau of Special Education (2008). "Pennsylvania Parent Guide to Special Education Services".
- ^ Armstrong School District Administration (2010). "Armstrong School District Special Education". Archived from the original on September 30, 2011.
- ^ Pennsylvania Department of Education. "Pennsylvania Special Education Funding".
- ^ Pennsylvania Department of Education (July 2010). "Special Education Funding from Pennsylvania State_2010-2011".
- ^ Senator Patrick Browne (November 1, 2011). "Senate Education Committee Holds Hearing on Special Education Funding & Accountability". Archived from the original on July 23, 2012.
- ^ Pennsylvania Department of Education Amy Morton, Executive Deputy Secretary (November 11, 2011). "Public Hearing: Special Education Funding & Accountability Testimony". Archived from the original on April 22, 2012.CS1 maint: uses authors parameter (link)
- ^ Baruch Kintisch Education Law Center (November 11, 2011). "Public Hearing: Special Education Funding & Accountability Testimony" (PDF). Archived from the original (PDF) on April 22, 2012.
- ^ US Department of Education, U.S. Department of Education Clarifies Schools' Obligation to Provide Equal Opportunity to Students with Disabilities to Participate in Extracurricular Athletics, January 25, 2013
- ^ Pennsylvania Department of Education (2011). "Special Education Funding 2011–2012 Fiscal Year".
- ^ Pennsylvania Department of Education (2011). "Special Education Funding 2011-2012 Fiscal Year".
- ^ Pennsylvania Department of Education (April 2012). "Investing in PA kids,". Archived from the original on October 1, 2013.
- ^ Pennsylvania Department of Education (July 2010). "Gifted Students as Percentage of Total Enrollment by School District/Charter School" (PDF). Archived from the original (PDF) on March 4, 2016.
- ^ Pennsylvania Department of Education and Pennsylvania School Board. "CHAPTER 16. Special Education For Gifted Students". Retrieved February 4, 2011.CS1 maint: uses authors parameter (link)
- ^ Pennsylvania General Assembly, Taxpayer Relief Act, Act 1 of the Special Session of 2006, June 27, 2006
- ^ Pennsylvania Department of Education (2013). "Investing in Pennsylvania Students 2014".
- ^ Pennsylvania Department of Education (2013). "Investing in Pennsylvania Students 2012".
- ^ "Armstrong School District Payroll report 2012". OpenPA Gov.org. 2013. Archived from the original on November 19, 2010.
- ^ OpenPA Gov.org, Armstrong School District Payroll report 2012, 2012
- ^ OpenPA Gov.org, Armstrong School District Payroll report 2009, 2009
- ^ Fenton, Jacob (March 2010). "Average classroom teacher salary in Armstrong County, 2006–07". The Morning Call. Archived from the original on June 5, 2012.
- ^ Teachers need to know enough is enough, PaDelcoTimes, April 20, 2010.
- ^ Armstrong School Board (2010). "Armstrong School District Teachers' union Employment Contract 2010". Archived from the original on November 19, 2010.
- ^ Fenton, Jacob. (February 2009). "Pennsylvania School District Data: Will School Consolidation Save Money?,". The Morning Call. Archived from the original on June 5, 2012.
- ^ Pennsylvania School Board Association (October 2009). "Public School Salaries 11th Annual". Archived from the original on October 5, 2008.
- ^ Pennsylvania School Board Association (June 22, 2012). "School Management Salaries Report". School Leader News. Archived from the original on September 21, 2013.
- ^ Pennsylvania Department of Education (2010). "2009-10 Selected Data - 2009-10 Total Expenditures per ADM".
- ^ Jump up to: a b US Census Bureau, States Ranked According to Per Pupil Public Elementary-Secondary School System Finance Amounts: Fiscal Year 2011, May 2013
- ^ Jump up to: a b c US Census Bureau (2009). "Total and current expenditures per pupil in fall enrollment in public elementary and secondary education, by function and state or jurisdiction: 2006-07".
- ^ US Census Bureau (March 2003). "Public Education Finances 2000-01 Annual Survey of Local Government Finances" (PDF).
- ^ United States Census Bureau (2009). "States Ranked According to Per Pupil Elementary-Secondary Public School System Finance Amounts: 2008-09" (PDF).
- ^ US Census Bureau (May 2013). "States Ranked According to Per Pupil Public Elementary-Secondary School System Finance Amounts: Fiscal Year 2011" (PDF).
- ^ Jump up to: a b "Armstrong School Board cuts tax 2 mills by drawing on fund balance". Pittsburgh Tribune-Review. June 28, 2011. Archived from the original on January 31, 2013.
- ^ Murphy, Jan., Pennsylvania's public schools boost reserves, CentreDaily Times, September 22, 2010
- ^ John Baer (December 9, 2013). "Pa. schools and $$ behind the curtain". Philadelphia Daily News.
- ^ Melissa Daniels (June 1, 2013). "PA school districts look to cash stash to balance budgets". PA Independent. Archived from the original on August 26, 2013. Retrieved March 23, 2014.
- ^ Pennsylvania Auditor General (May 2010). "Armstrong School District ARMSTRONG COUNTY, PENNSYLVANIA PERFORMANCE AUDIT REPORT".
- ^ The Kittanning Paper (August 8, 2013). "Final Piece of KOZ Application Complete".
- ^ Commonwealth of Pennsylvania Department of Economic Development (2014). "Keystone Opportunity Zones".
- ^ Pennsylvania Department of Education (May 2012). "Pennsylvania Public School District Tuition Rates".
- ^ Armstrong School District Administration, Armstrong School District Budget Final report 2013, June 2013
- ^ Penn State Cooperative Extension (2010). "What are the Local Taxes in Pennsylvania?, Local Tax Reform Education Project" (PDF).
- ^ Pennsylvania Department of Revenue (April 2010). "Personal Income Taxation Guidelines". Archived from the original on December 13, 2009.
- ^ John Finnerty (2013). "PA teachers pensions". CNHI Harrisburg Bureau.
- ^ Pennsylvania Representative Todd Stephens (January 23, 2014). "LEEF Funding Chart 2014".
- ^ PDE (July 7, 2014). "Enacted Education Budget 2014-2015".
- ^ Pennsylvania Department of Education, 2014-15 Enacted Education Budget Fast Facts, July 14, 2014
- ^ Democrat Appropriations Committee, Report on Education funding by LEA, July 2, 2013
- ^ Sam Wood & Brian X. McCrone (January 29, 2014). "Montgomery County lawmaker proposes using Pa. horse racing funds for education". The Philadelphia Inquirer.
- ^ Pennsylvania Office of the Budget, 2013-14 State Budget Highlights, 2013
- ^ Senator Jake Corman (June 28, 2012). "Pennsylvania Education funding by Local School District" (PDF). Archived from the original (PDF) on July 30, 2012.
- ^ Pennsylvania General Assembly Sen Jake Corman (June 29, 2012). "SB1466 of 2012 General Fund Appropriation".
- ^ Pennsylvania Department ofEducation (July 2011). "Pennsylvania 2011–2012 Estimated Basic Education Funding".
- ^ PA Senate Appropriations Committee (June 28, 2011). "School District 2011–12 funding Report". Archived from the original on October 8, 2014.
- ^ Pennsylvania Department of Education (June 30, 2011). "Basic Education Funding 2011–2012 Fiscal Year".
- ^ Pennsylvania House Appropriations Committee (June 2010). "PA Basic Education Funding-Printout2 2010–2011". Archived from the original on October 8, 2014.
- ^ Office of the Budget (February 2010). "Pennsylvania Budget Proposal 2010".
- ^ Pennsylvania Office of Budget (February 2009). "Governor's Budget Proposal 2009 Pennsylvania Department of Education Budget Proposal 2009". Archived from the original on December 24, 2009.
- ^ Pennsylvania Department of Education, Basic Education Funding report 2008, October 2009
- ^ Pennsylvania Department of Education, Funding Report by LEA 2009, 2009
- ^ U.S. Census Bureau., Annual Survey of Local Government Finances., 2000
- ^ U.S. Census Bureau., 2008 Survey of Local Government Finances – School Systems, 2010
- ^ Pennsylvania Department of Education (2010). "ACCOUNTABILITY BLOCK GRANT Awards". Archived from the original on October 15, 2013.
- ^ Pennsylvania Department of Education (2010). "PA-PACT Information".
- ^ Pennsylvania Department of Education (2010). "2009–2010 Accountability block Grant Mid-year report" (PDF). Archived from the original (PDF) on September 18, 2011.
- ^ Pennsylvania Auditor General (December 22, 2008). "Special Performance Audit Classrooms For the Future grants" (PDF).
- ^ Pennsylvania Department of Education Press Office (October 17, 2013). "Acting Secretary of Education Says Hybrid Learning Benefits Students; Highlights Success of First-Year Pilot Program".
- ^ Commonwealth of Pennsylvania (2009). "Armstrong County ARRA FUNDING". Archived from the original on March 7, 2011.
- ^ "School stimulus money". Pittsburgh Post-Gazette. March 12, 2009.
- ^ Governor's Press Office release (January 20, 2010). "Pennsylvania's 'Race to the Top' Fueled by Effective Reforms, Strong Local Support,".
- ^ Gerald Zahorchak (December 2008). "Pennsylvania Race to the Top Letter to Superintendents" (PDF).
- ^ Pennsylvania's 'Race to the Top' Fueled by Effective Reforms, Strong Local Support
- ^ U.S. Department of Education (March 29, 2010). "Race to the Top Fund".
- ^ US Department of Education Office of Elementary and Secondary Education Home (2012). "ENHANCING EDUCATION THROUGH TECHNOLOGY (ED-TECH) STATE PROGRAM".CS1 maint: uses authors parameter (link)
- ^ Pennsylvania Department of Education. "Common Cents program – Making Every Dollar Count". Retrieved February 1, 2011.
- ^ Taxpayer Relief Act Special Session Act 1 of 2006 – Report on Referendum Exceptions For School Year 2009–2010. Pennsylvania Department of Education. April 24, 2009.
- ^ Pennsylvania Department of Education (2004). "Act 511 Tax Report".
- ^ Pennsylvania Department of Education (2010). "Real Estate Tax Millage by School District,".
- ^ Pennsylvania Department of Education (2009). "Real Estate Tax Millage by School District,". Archived from the original on October 21, 2014.
- ^ Real Estate Tax Millage by School District, Pennsylvania Department of Revenue. 2009
- ^ Pennsylvania Department of Education (2008). "Real Estate Tax Millage by School District,".
- ^ Pennsylvania Department of Education, Real Estate Tax Millage by School District, 2006
- ^ Pennsylvania Department of Education, Real Estate Tax Millage by School District, 2005
- ^ Tax-rates.org., The 2013 Tax Resource County Property Taxes 2012, 2012
- ^ Pennsylvania Department of Education, Pennsylvania School Finances - Summaries of Annual Financial Report Data 2010-11, 2011
- ^ New Census Data on Property Taxes on Homeowners, Tax Foundation, September 22, 2009.
- ^ Pennsylvania Department of Education 2010–11 Act 1 of 2006 Referendum Exception Guidelines.
- ^ Pennsylvania Department of Education (May 2010). "Special Session Act 1 of 2006 School District Adjusted Index for 2006–2007 through 2011–2012,".
- ^ Pennsylvania Department of Education, 2012-2013 School District Adjusted Index, September 2011
- ^ Pennsylvania Department of Education, 2013-2014 School District Adjusted Index, September 2012
- ^ Pennsylvania Department of Education, 2014-2015 School District Adjusted Index, September 2013
- ^ Pennsylvania Department of Education, Report on Referendum Exceptions For School Year 2013-2014, April 2013
- ^ Pennsylvania Department of Education, Report on Referendum Exceptions For School Year 2012-2013, March 30, 2012
- ^ Pennsylvania Department of Education (2011). "Special Session Act 1 of 2006 the Taxpayer Relief Act information".
- ^ Pennsylvania Department of Education (April 2011). "Report on Exceptions".
- ^ Pennsylvania Department of Education (April 2010). "Pennsylvania SSAct1_Act1 Exceptions Report 2010-2011 April 2010". Archived from the original on October 8, 2014.
- ^ Pennsylvania Department of Education (April 2009). "Pennsylvania SSAct1 Exception requests Report_2009-2010_May 2009". Archived from the original on October 15, 2013.
- ^ Scarcella, Frank and Pursell, Tricia, Local school tax assessments exceed state averages. The Daily Item, May 25, 2010
- ^ Pennsylvania Department of Education (May 1, 2012). "2012-2013 Estimated State Property Tax Relief per Homestead".
- ^ Pennsylvania Department of Education (May 3, 2010). "Tax Relief per Homestead".
- ^ Pennsylvania Auditor General Office (February 23, 2010). "Special Report Pennsylvania Property Tax Relief" (PDF).
- ^ Armstrong School District Administration, Final Budget Report 2014-2014, June 2014
- ^ Armstrong School District Business Office, Armstrong School District Budget Report 2013-14, 2013
- ^ Armstrong School Board (February 27, 2006). "Co-curriculars Activities Policy122". Archived from the original on March 20, 2014.
- ^ Armstrong School Board (September 26, 2011). "Interscholastic Athletics Policy 123" (PDF).[permanent dead link]
- ^ Pennsylvania Office of the Governor Press Release (November 10, 2005). "Home-Schooled, Charter School Children Can Participate in School District Extracurricular Activities,".
- ^ PA General Assembly (July 1, 2012). "Senate Bill 200 of Session 2011 Safety in Youth Sports Act".
- ^ UMPC Sports Medicine (2014). "Managing Concussions in Student Athletes: The Safety in Youth Sports Act". Archived from the original on May 5, 2014. Retrieved October 22, 2014.
External links[]
- Armstrong School District
- Former Armstrong School District website
- ASD Foundation
- ARIN IU 28 [3]
- Lenape Tech School [4]
| Authority control |
|
|---|
- Kittanning, Pennsylvania
- School districts established in 1966
- Education in Pittsburgh area
- School districts in Armstrong County, Pennsylvania
- School districts in Indiana County, Pennsylvania
- 1966 establishments in Pennsylvania