Baingoin County
This article needs additional citations for verification. (October 2018) |
Baingoin County
班戈县 • དཔལ་མགོན་རྫོང་། | |
|---|---|
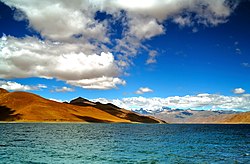 Nam Tso | |
 Location of Baingoin County (red) in Nagqu City (yellow) and the Tibet Autonomous Region | |
 Baingoin Location of the seat in the Tibet Autonomous Region | |
| Coordinates: 31°23′33″N 90°00′36″E / 31.3924°N 90.0100°ECoordinates: 31°23′33″N 90°00′36″E / 31.3924°N 90.0100°E | |
| Country | People's Republic of China |
| Autonomous region | Tibet |
| Prefecture-level city | Nagqu |
| Area | |
| • Total | 28,383 km2 (10,959 sq mi) |
| Population (2010) | |
| • Total | 36,842 |
| Time zone | UTC+8 (China Standard) |

| Baingoin County | |||
|---|---|---|---|
| Chinese name | |||
| Simplified Chinese | 班戈县 | ||
| Traditional Chinese | 班戈縣 | ||
| |||
| Tibetan name | |||
| Tibetan | དཔལ་མགོན་རྫོང་། | ||
| |||
Baingoin County (Tibetan: དཔལ་མགོན་རྫོང་།; Chinese: 班戈县) is a county within Nagqu of the Tibet Autonomous Region.
County got the name from the lake Drang-khog (Tibetan: བྲང་ཁོག་མཚོ, Wylie: brang khog mtsho) which is in center of county. County lies between lakes Namtso and Siling.
The county is divided into ten towns and townships:
- (ཕུག་པ་, Pubao-zhen 普保镇) 31°24′N 90°00′E / 31.4°N 90.0°E
- Baoji Township (སྤོ་ཆེ་, Baoji-xiang 保吉乡) 31°00′N 90°12′E / 31.0°N 90.2°E
- (བལ་ལ་, Beila-zhen 北拉镇) 31°24′N 90°48′E / 31.4°N 90.8°E
- Jiaqiong Town (བྱ་ཁྱུང་, Jiaqiong-zhen 佳琼镇) 31°36′N 90°36′E / 31.6°N 90.6°E
- Dechen Town (བདེ་ཆེན་, Deqing-zhen 德庆镇) 30°30′N 90°06′E / 30.5°N 90.1°E
- (རྨ་ཆེན་, Maqian-xiang 马前乡) 31°36′N 90°12′E / 31.6°N 90.2°E
- Mentang Raktsek Township (མན་ཐང་རགས་རྩེག་, Mendang-xiang 门当乡) 31°24′N 89°42′E / 31.4°N 89.7°E
- Qinglong Township (ཕྱིང་ལུང་, Qinglong-xiang 青龙乡) 31°12′N 90°36′E / 31.2°N 90.6°E
- Xênkyêr Township (ཤི་འཁྱེར་, Xinjixiang 新吉乡) 30°36′N 89°48′E / 30.6°N 89.8°E
- Nyima Township (ཉི་མ་, Nima-xiang 尼玛乡) 31°06′N 91°00′E / 31.1°N 91.0°E
Climate[]
| hideClimate data for Baingoin County, 4701 m asl (1981–2010 normals) | |||||||||||||
|---|---|---|---|---|---|---|---|---|---|---|---|---|---|
| Month | Jan | Feb | Mar | Apr | May | Jun | Jul | Aug | Sep | Oct | Nov | Dec | Year |
| Record high °C (°F) | 9.4 (48.9) |
9.5 (49.1) |
14.0 (57.2) |
14.2 (57.6) |
19.7 (67.5) |
23.2 (73.8) |
22.5 (72.5) |
20.6 (69.1) |
19.9 (67.8) |
17.2 (63.0) |
11.6 (52.9) |
15.1 (59.2) |
23.2 (73.8) |
| Average high °C (°F) | −4.0 (24.8) |
−2.6 (27.3) |
1.3 (34.3) |
5.2 (41.4) |
9.7 (49.5) |
14.2 (57.6) |
14.9 (58.8) |
14.0 (57.2) |
12.0 (53.6) |
6.4 (43.5) |
0.4 (32.7) |
−2.3 (27.9) |
5.8 (42.4) |
| Daily mean °C (°F) | −10.5 (13.1) |
−8.7 (16.3) |
−4.6 (23.7) |
−0.9 (30.4) |
3.5 (38.3) |
8.2 (46.8) |
9.5 (49.1) |
8.8 (47.8) |
6.6 (43.9) |
0.6 (33.1) |
−5.9 (21.4) |
−9.1 (15.6) |
−0.2 (31.6) |
| Average low °C (°F) | −16.8 (1.8) |
−14.7 (5.5) |
−10.4 (13.3) |
−6.9 (19.6) |
−2.7 (27.1) |
2.0 (35.6) |
4.1 (39.4) |
3.5 (38.3) |
1.1 (34.0) |
−5.2 (22.6) |
−12.3 (9.9) |
−15.8 (3.6) |
−6.2 (20.9) |
| Record low °C (°F) | −42.9 (−45.2) |
−37.6 (−35.7) |
−30.5 (−22.9) |
−19.6 (−3.3) |
−15.2 (4.6) |
−7.7 (18.1) |
−6.6 (20.1) |
−4.6 (23.7) |
−9.2 (15.4) |
−21.7 (−7.1) |
−39.4 (−38.9) |
−42.7 (−44.9) |
−42.9 (−45.2) |
| Average precipitation mm (inches) | 2.3 (0.09) |
2.4 (0.09) |
3.6 (0.14) |
6.9 (0.27) |
23.5 (0.93) |
56.6 (2.23) |
82.9 (3.26) |
84.4 (3.32) |
55.5 (2.19) |
13.5 (0.53) |
3.0 (0.12) |
2.7 (0.11) |
337.3 (13.28) |
| Average precipitation days | 0.7 | 0.6 | 1.0 | 2.1 | 6.0 | 10.6 | 14.6 | 14.9 | 11.5 | 2.8 | 0.7 | 0.8 | 66.3 |
| Source: Météo Climat[1][2] | |||||||||||||
References[]
- ^ "Chine climate normals 1981-2010" (in French). Retrieved 11 November 2019.
- ^ "Weather extremes for Baingoin". Météo Climat. Retrieved 11 November 2019.

This Nagqu Prefecture, Tibet location article is a stub. You can help Wikipedia by . |
Categories:
- Counties of Tibet
- Nagqu
- Nagqu geography stubs