Blekinge County (Riksdag constituency)
| Blekinge County | |
|---|---|
| Blekinge Län | |
| Constituency for the Riksdag | |
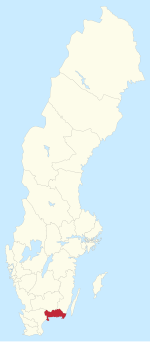 Location of Blekinge County within Sweden | |
| County | Blekinge |
| Population | 159,606 (2019)[1] |
| Electorate | 119,376 (2018) |
| Current constituency | |
| Created | 1970 |
| Seats | List
|
| Member of the Riksdag[2] | List |
| Regional council | Blekinge Regional Council |
| Created from | |
Blekinge County (Swedish: Blekinge Län) is one of the 29 multi-member constituencies of the Riksdag, the national legislature of Sweden. The constituency was established in 1970 when the Riksdag changed from a bicameral legislature to a unicameral legislature. It is conterminous with the county of Blekinge.
Blekinge County currently elects five of the 349 members of the Riksdag using the modified Sainte-Laguë method open party-list proportional representation electoral system. Parties that receive at least 4% of the vote nationally and other parties that receive at least 12% of the vote in the constituency compete for constituency seats. Supplementary leveling seats may also be allocated at the constituency level to parties that reach the 4% national threshold. At the 2018 general election the constituency had 119,376 registered electors.
Election results[]
Summary[]
| Election | Left V/VPK |
Social Democrats S |
Greens MP |
Liberals L/FP/F |
Centre C |
Moderates M |
Christian Democrats KD/KDS |
Sweden Democrats SD | ||||||||||||||||
|---|---|---|---|---|---|---|---|---|---|---|---|---|---|---|---|---|---|---|---|---|---|---|---|---|
| Votes | % | Seats | Votes | % | Seats | Votes | % | Seats | Votes | % | Seats | Votes | % | Seats | Votes | % | Seats | Votes | % | Seats | Votes | % | Seats | |
| 2018 | 5,699 | 5.45% | 0 | 32,824 | 31.41% | 2 | 3,025 | 2.89% | 0 | 4,197 | 4.02% | 0 | 7,094 | 6.79% | 0 | 18,038 | 17.26% | 1 | 5,954 | 5.70% | 0 | 26,342 | 25.20% | 2 |
| 2014 | 4,746 | 4.64% | 0 | 37,981 | 37.15% | 3 | 4,969 | 4.86% | 0 | 3,984 | 3.90% | 0 | 5,792 | 5.67% | 0 | 19,824 | 19.39% | 1 | 3,483 | 3.41% | 0 | 18,960 | 18.55% | 1 |
| 2010 | 5,075 | 5.07% | 0 | 36,520 | 36.46% | 3 | 5,289 | 5.28% | 0 | 5,431 | 5.42% | 0 | 5,771 | 5.76% | 0 | 27,387 | 27.34% | 2 | 3,973 | 3.97% | 0 | 9,830 | 9.81% | 0 |
| 2006 | 5,193 | 5.42% | 0 | 40,532 | 42.32% | 3 | 3,505 | 3.66% | 0 | 6,105 | 6.37% | 0 | 6,855 | 7.16% | 0 | 21,109 | 22.04% | 2 | 4,964 | 5.18% | 0 | 5,945 | 6.21% | 0 |
| 2002 | 7,827 | 8.28% | 0 | 43,178 | 45.66% | 3 | 3,631 | 3.84% | 0 | 10,470 | 11.07% | 1 | 5,777 | 6.11% | 0 | 12,467 | 13.18% | 1 | 8,319 | 8.80% | 0 | 2,634 | 2.79% | 0 |
| 1998 | 12,282 | 13.10% | 1 | 39,762 | 42.41% | 3 | 3,672 | 3.92% | 0 | 3,401 | 3.63% | 0 | 4,923 | 5.25% | 0 | 18,040 | 19.24% | 1 | 10,330 | 11.02% | 1 | |||
| 1994 | 6,505 | 6.49% | 0 | 53,000 | 52.88% | 4 | 4,430 | 4.42% | 0 | 5,178 | 5.17% | 0 | 7,629 | 7.61% | 0 | 18,573 | 18.53% | 2 | 3,285 | 3.28% | 0 | |||
| 1991 | 4,114 | 4.15% | 0 | 45,679 | 46.04% | 4 | 2,808 | 2.83% | 0 | 7,403 | 7.46% | 0 | 8,975 | 9.05% | 1 | 17,986 | 18.13% | 1 | 6,170 | 6.22% | 0 | |||
| 1988 | 4,713 | 4.79% | 0 | 51,412 | 52.24% | 4 | 5,235 | 5.32% | 0 | 9,466 | 9.62% | 0 | 11,120 | 11.30% | 1 | 13,573 | 13.79% | 1 | 2,746 | 2.79% | 0 | |||
| 1985 | 4,550 | 4.43% | 0 | 53,026 | 51.61% | 3 | 1,365 | 1.33% | 0 | 12,778 | 12.44% | 1 | 12,791 | 12.45% | 1 | 18,067 | 17.58% | 1 | ||||||
| 1982 | 4,151 | 4.02% | 0 | 54,462 | 52.74% | 4 | 1,194 | 1.16% | 0 | 5,802 | 5.62% | 0 | 16,134 | 15.62% | 1 | 19,457 | 18.84% | 1 | 1,961 | 1.90% | 0 | |||
| 1979 | 4,023 | 3.90% | 0 | 51,443 | 49.93% | 3 | 11,638 | 11.29% | 1 | 16,967 | 16.47% | 1 | 17,134 | 16.63% | 1 | 1,448 | 1.41% | 0 | ||||||
| 1976 | 3,435 | 3.33% | 0 | 51,122 | 49.51% | 3 | 10,852 | 10.51% | 1 | 22,674 | 21.96% | 1 | 13,024 | 12.61% | 1 | 1,545 | 1.50% | 0 | ||||||
| 1973 | 4,082 | 4.15% | 0 | 48,778 | 49.56% | 3 | 9,264 | 9.41% | 0 | 22,515 | 22.88% | 2 | 11,784 | 11.97% | 1 | 1,744 | 1.77% | 0 | ||||||
| 1970 | 3,963 | 4.15% | 0 | 48,021 | 50.24% | 4 | 14,550 | 15.22% | 1 | 17,908 | 18.74% | 1 | 9,458 | 9.90% | 0 | 1,545 | 1.62% | 0 | ||||||
(Excludes leveling seats)
Detailed[]
2018[]
Results of the 2018 general election held on 9 September 2018:[3][4]
| Party | Votes per municipality | Total Votes | % | Seats | |||||||
|---|---|---|---|---|---|---|---|---|---|---|---|
| Karls -hamn |
Karls -krona |
Olof -ström |
Ronne -by |
Sölves -borg |
Con. | Lev. | Tot. | ||||
| Swedish Social Democratic Party | 7,073 | 13,845 | 3,054 | 5,573 | 3,279 | 32,824 | 31.41% | 2 | 0 | 2 | |
| Sweden Democrats | 5,218 | 9,553 | 2,407 | 5,483 | 3,681 | 26,342 | 25.20% | 2 | 0 | 2 | |
| Moderate Party | 3,632 | 8,134 | 1,002 | 3,024 | 2,246 | 18,038 | 17.26% | 1 | 0 | 1 | |
| Centre Party | 1,392 | 3,177 | 542 | 1,313 | 670 | 7,094 | 6.79% | 0 | 0 | 0 | |
| Christian Democrats | 1,095 | 2,758 | 410 | 969 | 722 | 5,954 | 5.70% | 0 | 0 | 0 | |
| Left Party | 1,306 | 2,458 | 472 | 1,027 | 436 | 5,699 | 5.45% | 0 | 0 | 0 | |
| Liberals | 727 | 2,304 | 192 | 603 | 371 | 4,197 | 4.02% | 0 | 0 | 0 | |
| Green Party | 718 | 1,503 | 160 | 398 | 246 | 3,025 | 2.89% | 0 | 0 | 0 | |
| Feminist Initiative | 95 | 139 | 20 | 61 | 36 | 351 | 0.34% | 0 | 0 | 0 | |
| Alternative for Sweden | 66 | 103 | 28 | 64 | 24 | 285 | 0.27% | 0 | 0 | 0 | |
| Citizens' Coalition | 18 | 112 | 7 | 33 | 13 | 183 | 0.18% | 0 | 0 | 0 | |
| Pirate Party | 34 | 71 | 6 | 21 | 15 | 147 | 0.14% | 0 | 0 | 0 | |
| Direct Democrats | 21 | 49 | 9 | 31 | 5 | 115 | 0.11% | 0 | 0 | 0 | |
| Unity | 11 | 36 | 4 | 13 | 4 | 68 | 0.07% | 0 | 0 | 0 | |
| Independent Rural Party | 14 | 8 | 9 | 7 | 19 | 57 | 0.05% | 0 | 0 | 0 | |
| Christian Values Party | 7 | 23 | 2 | 1 | 11 | 44 | 0.04% | 0 | 0 | 0 | |
| Nordic Resistance Movement | 2 | 9 | 3 | 7 | 3 | 24 | 0.02% | 0 | 0 | 0 | |
| Animal Party | 3 | 9 | 3 | 6 | 1 | 22 | 0.02% | 0 | 0 | 0 | |
| Basic Income Party | 2 | 7 | 1 | 0 | 3 | 13 | 0.01% | 0 | 0 | 0 | |
| Classical Liberal Party | 1 | 6 | 2 | 0 | 2 | 11 | 0.01% | 0 | 0 | 0 | |
| Initiative | 2 | 8 | 0 | 0 | 0 | 10 | 0.01% | 0 | 0 | 0 | |
| Scania Party | 0 | 1 | 0 | 0 | 0 | 1 | 0.00% | 0 | 0 | 0 | |
| Security Party | 0 | 0 | 1 | 0 | 0 | 1 | 0.00% | 0 | 0 | 0 | |
| Parties not on the ballot | 2 | 4 | 3 | 0 | 0 | 9 | 0.01% | 0 | 0 | 0 | |
| Valid Votes | 21,439 | 44,317 | 8,337 | 18,634 | 11,787 | 104,514 | 100.00% | 5 | 0 | 5 | |
| Invalid votes - unregistered parties | 5 | 11 | 6 | 3 | 4 | 29 | 0.03% | ||||
| Blank votes | 226 | 401 | 96 | 158 | 131 | 1,012 | 0.96% | ||||
| Invalid votes – other | 10 | 24 | 4 | 15 | 8 | 61 | 0.06% | ||||
| Total Polled | 21,680 | 44,753 | 8,443 | 18,810 | 11,930 | 105,616 | 88.47% | ||||
| Registered Electors | 24,694 | 49,784 | 9,930 | 21,450 | 13,518 | 119,376 | |||||
| Turnout | 87.79% | 89.89% | 85.03% | 87.69% | 88.25% | 88.47% | |||||
The following candidates were elected:[5] Angelika Bengtsson (SD), 5 votes; Heléne Björklund (S), 2,232 votes; Annicka Engblom (M), 1,501 votes; Richard Jomshof (SD), 252 votes; and Magnus Manhammar (S), 1,741 votes.
2014[]
Results of the 2014 general election held on 14 September 2014:[6][7]
| Party | Votes per municipality | Total Votes | % | Seats | |||||||
|---|---|---|---|---|---|---|---|---|---|---|---|
| Karls -hamn |
Karls -krona |
Olof -ström |
Ronne -by |
Sölves -borg |
Con. | Lev. | Tot. | ||||
| Swedish Social Democratic Party | 8,114 | 15,522 | 3,839 | 6,731 | 3,775 | 37,981 | 37.15% | 3 | 0 | 3 | |
| Moderate Party | 3,923 | 8,848 | 1,123 | 3,335 | 2,595 | 19,824 | 19.39% | 1 | 0 | 1 | |
| Sweden Democrats | 3,867 | 6,603 | 1,602 | 4,028 | 2,860 | 18,960 | 18.55% | 1 | 0 | 1 | |
| Centre Party | 1,015 | 2,493 | 473 | 1,289 | 522 | 5,792 | 5.67% | 0 | 0 | 0 | |
| Green Party | 1,192 | 2,309 | 295 | 732 | 441 | 4,969 | 4.86% | 0 | 0 | 0 | |
| Left Party | 1,044 | 1,954 | 413 | 972 | 363 | 4,746 | 4.64% | 0 | 0 | 0 | |
| Liberal People's Party | 616 | 2,225 | 168 | 653 | 322 | 3,984 | 3.90% | 0 | 0 | 0 | |
| Christian Democrats | 647 | 1,674 | 287 | 534 | 341 | 3,483 | 3.41% | 0 | 0 | 0 | |
| Feminist Initiative | 430 | 755 | 97 | 274 | 145 | 1,701 | 1.66% | 0 | 0 | 0 | |
| Pirate Party | 69 | 182 | 25 | 62 | 29 | 367 | 0.36% | 0 | 0 | 0 | |
| Unity | 20 | 54 | 10 | 30 | 7 | 121 | 0.12% | 0 | 0 | 0 | |
| Animal Party | 28 | 17 | 3 | 25 | 8 | 81 | 0.08% | 0 | 0 | 0 | |
| Party of the Swedes | 6 | 44 | 11 | 9 | 9 | 79 | 0.08% | 0 | 0 | 0 | |
| Christian Values Party | 3 | 10 | 12 | 1 | 8 | 34 | 0.03% | 0 | 0 | 0 | |
| Independent Rural Party | 3 | 2 | 2 | 8 | 4 | 19 | 0.02% | 0 | 0 | 0 | |
| Classical Liberal Party | 5 | 9 | 2 | 0 | 1 | 17 | 0.02% | 0 | 0 | 0 | |
| Direct Democrats | 1 | 5 | 1 | 7 | 2 | 16 | 0.02% | 0 | 0 | 0 | |
| Swedish Senior Citizen Interest Party | 1 | 2 | 0 | 2 | 3 | 8 | 0.01% | 0 | 0 | 0 | |
| Progressive Party | 0 | 0 | 4 | 0 | 0 | 4 | 0.00% | 0 | 0 | 0 | |
| Health Party | 0 | 0 | 2 | 0 | 0 | 2 | 0.00% | 0 | 0 | 0 | |
| Communist Party of Sweden | 0 | 0 | 0 | 1 | 0 | 1 | 0.00% | 0 | 0 | 0 | |
| Parties not on the ballot | 8 | 19 | 3 | 2 | 4 | 36 | 0.04% | 0 | 0 | 0 | |
| Valid Votes | 20,992 | 42,727 | 8,372 | 18,695 | 11,439 | 102,225 | 100.00% | 5 | 0 | 5 | |
| Blank votes | 218 | 364 | 111 | 169 | 112 | 974 | 0.94% | ||||
| Invalid votes | 3 | 4 | 7 | 5 | 2 | 21 | 0.02% | ||||
| Total Polled | 21,213 | 43,095 | 8,490 | 18,869 | 11,553 | 103,220 | 86.84% | ||||
| Registered Electors | 24,702 | 49,012 | 10,131 | 21,746 | 13,273 | 118,864 | |||||
| Turnout | 85.88% | 87.93% | 83.80% | 86.77% | 87.04% | 86.84% | |||||
The following candidates were elected:[8] Annicka Engblom (M), 4,693 votes; Peter Jeppsson (S), 1,599 votes; Richard Jomshof (SD), 321 votes; Magnus Manhammar (S), 2,937 votes; and Suzanne Svensson (S), 783 votes.
2010[]
Results of the 2010 general election held on 19 September 2010:[9][10]
| Party | Votes per municipality | Total Votes | % | Seats | |||||||
|---|---|---|---|---|---|---|---|---|---|---|---|
| Karls -hamn |
Karls -krona |
Olof -ström |
Ronne -by |
Sölves -borg |
Con. | Lev. | Tot. | ||||
| Swedish Social Democratic Party | 7,709 | 14,651 | 3,859 | 6,478 | 3,823 | 36,520 | 36.46% | 3 | 0 | 3 | |
| Moderate Party | 5,426 | 11,905 | 1,552 | 5,006 | 3,498 | 27,387 | 27.34% | 2 | 0 | 2 | |
| Sweden Democrats | 1,947 | 3,682 | 802 | 2,042 | 1,357 | 9,830 | 9.81% | 0 | 1 | 1 | |
| Centre Party | 1,023 | 2,304 | 502 | 1,407 | 535 | 5,771 | 5.76% | 0 | 0 | 0 | |
| Liberal People's Party | 1,099 | 2,695 | 300 | 878 | 459 | 5,431 | 5.42% | 0 | 0 | 0 | |
| Green Party | 1,299 | 2,312 | 299 | 929 | 450 | 5,289 | 5.28% | 0 | 0 | 0 | |
| Left Party | 1,253 | 1,814 | 462 | 1,098 | 448 | 5,075 | 5.07% | 0 | 0 | 0 | |
| Christian Democrats | 722 | 1,777 | 373 | 662 | 439 | 3,973 | 3.97% | 0 | 0 | 0 | |
| Pirate Party | 130 | 223 | 46 | 118 | 71 | 588 | 0.59% | 0 | 0 | 0 | |
| Feminist Initiative | 34 | 104 | 11 | 48 | 17 | 214 | 0.21% | 0 | 0 | 0 | |
| Unity | 7 | 4 | 1 | 1 | 1 | 14 | 0.01% | 0 | 0 | 0 | |
| Sweden's National Democratic Party | 6 | 0 | 1 | 0 | 0 | 7 | 0.01% | 0 | 0 | 0 | |
| Freedom Party | 3 | 0 | 0 | 1 | 2 | 6 | 0.01% | 0 | 0 | 0 | |
| National Democrats | 1 | 1 | 2 | 1 | 1 | 6 | 0.01% | 0 | 0 | 0 | |
| Party of the Swedes | 1 | 3 | 0 | 2 | 0 | 6 | 0.01% | 0 | 0 | 0 | |
| Classical Liberal Party | 1 | 2 | 1 | 0 | 1 | 5 | 0.00% | 0 | 0 | 0 | |
| Swedish Senior Citizen Interest Party | 0 | 1 | 1 | 1 | 1 | 4 | 0.00% | 0 | 0 | 0 | |
| Socialist Justice Party | 0 | 0 | 0 | 2 | 0 | 2 | 0.00% | 0 | 0 | 0 | |
| Spirits Party | 0 | 1 | 1 | 0 | 0 | 2 | 0.00% | 0 | 0 | 0 | |
| Communist Party of Sweden | 0 | 1 | 0 | 0 | 0 | 1 | 0.00% | 0 | 0 | 0 | |
| European Workers Party | 0 | 1 | 0 | 0 | 0 | 1 | 0.00% | 0 | 0 | 0 | |
| Freedom of the Justice Party | 0 | 1 | 0 | 0 | 0 | 1 | 0.00% | 0 | 0 | 0 | |
| Health Care Party | 1 | 0 | 0 | 0 | 0 | 1 | 0.00% | 0 | 0 | 0 | |
| Parties not on the ballot | 4 | 10 | 4 | 4 | 6 | 28 | 0.03% | 0 | 0 | 0 | |
| Valid Votes | 20,666 | 41,492 | 8,217 | 18,678 | 11,109 | 100,162 | 100.00% | 5 | 1 | 6 | |
| Blank votes | 272 | 535 | 108 | 240 | 150 | 1,305 | 1.29% | ||||
| Invalid votes | 7 | 14 | 8 | 4 | 4 | 37 | 0.04% | ||||
| Total Polled | 20,945 | 42,041 | 8,333 | 18,922 | 11,263 | 101,504 | 85.82% | ||||
| Registered Electors | 24,606 | 48,178 | 10,130 | 22,114 | 13,251 | 118,279 | |||||
| Turnout | 85.12% | 87.26% | 82.26% | 85.57% | 85.00% | 85.82% | |||||
The following candidates were elected:[11] Jonas Åkerlund (SD), 17 votes; Annicka Engblom (M), 2,554 votes; Kerstin Haglö (S), 827 votes; Peter Jeppsson (S), 1,426 votes; (M), 700 votes; and Suzanne Svensson (S), 991 votes.
2006[]
Results of the 2006 general election held on 17 September 2006:[12][13]
| Party | Votes per municipality | Total Votes | % | Seats | |||||||
|---|---|---|---|---|---|---|---|---|---|---|---|
| Karls -hamn |
Karls -krona |
Olof -ström |
Ronne -by |
Sölves -borg |
Con. | Lev. | Tot. | ||||
| Swedish Social Democratic Party | 8,827 | 15,782 | 4,059 | 7,570 | 4,294 | 40,532 | 42.32% | 3 | 0 | 3 | |
| Moderate Party | 3,912 | 9,330 | 1,142 | 3,888 | 2,837 | 21,109 | 22.04% | 2 | 0 | 2 | |
| Centre Party | 1,288 | 2,810 | 543 | 1,634 | 580 | 6,855 | 7.16% | 0 | 0 | 0 | |
| Liberal People's Party | 1,179 | 2,956 | 416 | 1,067 | 487 | 6,105 | 6.37% | 0 | 0 | 0 | |
| Sweden Democrats | 1,252 | 2,325 | 482 | 1,065 | 821 | 5,945 | 6.21% | 0 | 0 | 0 | |
| Left Party | 1,332 | 1,761 | 496 | 1,128 | 476 | 5,193 | 5.42% | 0 | 0 | 0 | |
| Christian Democrats | 898 | 2,297 | 410 | 824 | 535 | 4,964 | 5.18% | 0 | 0 | 0 | |
| Green Party | 834 | 1,623 | 192 | 618 | 238 | 3,505 | 3.66% | 0 | 0 | 0 | |
| Feminist Initiative | 118 | 199 | 44 | 90 | 53 | 504 | 0.53% | 0 | 0 | 0 | |
| Pirate Party | 68 | 199 | 24 | 118 | 64 | 473 | 0.49% | 0 | 0 | 0 | |
| June List | 57 | 124 | 38 | 117 | 25 | 361 | 0.38% | 0 | 0 | 0 | |
| Swedish Senior Citizen Interest Party | 20 | 38 | 14 | 14 | 12 | 98 | 0.10% | 0 | 0 | 0 | |
| National Socialist Front | 1 | 24 | 0 | 23 | 5 | 53 | 0.06% | 0 | 0 | 0 | |
| Unity | 8 | 7 | 3 | 2 | 2 | 22 | 0.02% | 0 | 0 | 0 | |
| Health Care Party | 3 | 2 | 1 | 6 | 3 | 15 | 0.02% | 0 | 0 | 0 | |
| People's Will | 3 | 1 | 0 | 0 | 7 | 11 | 0.01% | 0 | 0 | 0 | |
| Classical Liberal Party | 6 | 2 | 0 | 0 | 2 | 10 | 0.01% | 0 | 0 | 0 | |
| National Democrats | 1 | 5 | 0 | 1 | 0 | 7 | 0.01% | 0 | 0 | 0 | |
| New Future | 0 | 3 | 0 | 0 | 0 | 3 | 0.00% | 0 | 0 | 0 | |
| Freedom of the Justice Party | 0 | 1 | 0 | 0 | 0 | 1 | 0.00% | 0 | 0 | 0 | |
| Unique Party | 0 | 1 | 0 | 0 | 0 | 1 | 0.00% | 0 | 0 | 0 | |
| Partiet.se | 0 | 1 | 0 | 0 | 0 | 1 | 0.00% | 0 | 0 | 0 | |
| Rikshushållarna | 1 | 0 | 0 | 0 | 0 | 1 | 0.00% | 0 | 0 | 0 | |
| Other parties | 1 | 6 | 1 | 3 | 1 | 12 | 0.01% | 0 | 0 | 0 | |
| Valid Votes | 19,809 | 39,497 | 7,865 | 18,168 | 10,442 | 95,781 | 100.00% | 5 | 0 | 5 | |
| Blank votes | 450 | 725 | 166 | 351 | 224 | 1,916 | 1.96% | ||||
| Invalid votes | 6 | 15 | 5 | 6 | 5 | 37 | 0.04% | ||||
| Total Polled | 20,265 | 40,237 | 8,036 | 18,525 | 10,671 | 97,734 | 83.08% | ||||
| Registered Electors | 24,616 | 47,554 | 10,081 | 22,398 | 12,994 | 117,643 | |||||
| Turnout | 82.32% | 84.61% | 79.71% | 82.71% | 82.12% | 83.08% | |||||
The following candidates were elected:[14] Kerstin Andersson (S), 1,116 votes; Jan Björkman (S), 1,513 votes; Annicka Engblom (M), 1,866 votes; Peter Jeppsson (S), 1,470 votes; and Jeppe Johnsson (M), 2,632 votes.
2002[]
Results of the 2002 general election held on 15 September 2002:[15][16]
| Party | Votes per municipality | Total Votes | % | Seats | |||||||
|---|---|---|---|---|---|---|---|---|---|---|---|
| Karls -hamn |
Karls -krona |
Olof -ström |
Ronne -by |
Sölves -borg |
Con. | Lev. | Tot. | ||||
| Swedish Social Democratic Party | 9,176 | 17,172 | 4,127 | 8,188 | 4,515 | 43,178 | 45.66% | 3 | 0 | 3 | |
| Moderate Party | 2,235 | 5,426 | 652 | 2,287 | 1,867 | 12,467 | 13.18% | 1 | 0 | 1 | |
| Liberal People's Party | 2,000 | 4,876 | 747 | 1,910 | 937 | 10,470 | 11.07% | 1 | 0 | 1 | |
| Christian Democrats | 1,442 | 3,884 | 719 | 1,399 | 875 | 8,319 | 8.80% | 0 | 1 | 1 | |
| Left Party | 1,994 | 2,820 | 690 | 1,614 | 709 | 7,827 | 8.28% | 0 | 0 | 0 | |
| Centre Party | 1,052 | 2,393 | 503 | 1,321 | 508 | 5,777 | 6.11% | 0 | 0 | 0 | |
| Green Party | 881 | 1,557 | 220 | 675 | 298 | 3,631 | 3.84% | 0 | 0 | 0 | |
| Sweden Democrats | 532 | 1,040 | 255 | 537 | 270 | 2,634 | 2.79% | 0 | 0 | 0 | |
| New Future | 4 | 6 | 15 | 2 | 15 | 42 | 0.04% | 0 | 0 | 0 | |
| Popular Democrats | 0 | 10 | 0 | 2 | 0 | 12 | 0.01% | 0 | 0 | 0 | |
| Unity | 0 | 4 | 0 | 2 | 1 | 7 | 0.01% | 0 | 0 | 0 | |
| Norrbotten Party | 0 | 4 | 0 | 1 | 0 | 5 | 0.01% | 0 | 0 | 0 | |
| Socialist Party | 0 | 3 | 0 | 0 | 1 | 4 | 0.00% | 0 | 0 | 0 | |
| Rikshushållarna | 0 | 1 | 0 | 0 | 0 | 1 | 0.00% | 0 | 0 | 0 | |
| Other parties | 30 | 81 | 18 | 36 | 19 | 184 | 0.19% | 0 | 0 | 0 | |
| Valid Votes | 19,346 | 39,277 | 7,946 | 17,974 | 10,015 | 94,558 | 100.00% | 5 | 1 | 6 | |
| Invalid votes | 383 | 549 | 119 | 342 | 215 | 1,608 | 1.67% | ||||
| Total Polled | 19,729 | 39,826 | 8,065 | 18,316 | 10,230 | 96,166 | 82.35% | ||||
| Registered Electors | 24,259 | 47,127 | 10,181 | 22,449 | 12,760 | 116,776 | |||||
| Turnout | 81.33% | 84.51% | 79.22% | 81.59% | 80.17% | 82.35% | |||||
The following candidates were elected:[17] Kerstin Andersson (S), 1,186 votes; Heli Berg (FP), 622 votes; Jan Björkman (S), 2,057 votes; Johnny Gylling (KD), 1,372 votes; Jeppe Johnsson (M), 2,514 votes; and (S), 1,421 votes.
1998[]
Results of the 1998 general election held on 20 September 1998:[18][19]
| Party | Votes per municipality | Total Votes | % | Seats | |||||||
|---|---|---|---|---|---|---|---|---|---|---|---|
| Karls -hamn |
Karls -krona |
Olof -ström |
Ronne -by |
Sölves -borg |
Con. | Lev. | Tot. | ||||
| Swedish Social Democratic Party | 8,664 | 15,232 | 3,988 | 7,569 | 4,309 | 39,762 | 42.41% | 3 | 0 | 3 | |
| Moderate Party | 3,263 | 8,032 | 1,063 | 3,504 | 2,178 | 18,040 | 19.24% | 1 | 0 | 1 | |
| Left Party | 2,983 | 4,565 | 1,126 | 2,496 | 1,112 | 12,282 | 13.10% | 1 | 0 | 1 | |
| Christian Democrats | 1,906 | 4,662 | 854 | 1,875 | 1,033 | 10,330 | 11.02% | 1 | 0 | 1 | |
| Centre Party | 870 | 1,966 | 465 | 1,190 | 432 | 4,923 | 5.25% | 0 | 0 | 0 | |
| Green Party | 907 | 1,453 | 355 | 673 | 284 | 3,672 | 3.92% | 0 | 0 | 0 | |
| Liberal People's Party | 618 | 1,621 | 256 | 651 | 255 | 3,401 | 3.63% | 0 | 0 | 0 | |
| Other parties | 253 | 598 | 97 | 188 | 210 | 1,346 | 1.44% | 0 | 0 | 0 | |
| Valid Votes | 19,464 | 38,129 | 8,204 | 18,146 | 9,813 | 93,756 | 100.00% | 6 | 0 | 6 | |
| Invalid votes | 512 | 963 | 202 | 450 | 292 | 2,419 | 2.52% | ||||
| Total Polled | 19,976 | 39,092 | 8,406 | 18,596 | 10,105 | 96,175 | 82.30% | ||||
| Registered Electors | 24,344 | 46,644 | 10,663 | 22,574 | 12,636 | 116,861 | |||||
| Turnout | 82.06% | 83.81% | 78.83% | 82.38% | 79.97% | 82.30% | |||||
The following candidates were elected:[20] Jan Björkman (S), 1,830 votes; Johnny Gylling (KD), 401 votes; Jeppe Johnsson (M), 2,150 votes; (S), 790 votes; (S), 1,267 votes; and (V), 631 votes.
1994[]
Results of the 1994 general election held on 18 September 1994:[21][22]
| Party | Votes per municipality | Total Votes | % | Seats | |||||||
|---|---|---|---|---|---|---|---|---|---|---|---|
| Karls -hamn |
Karls -krona |
Olof -ström |
Ronne -by |
Sölves -borg |
Con. | Lev. | Tot. | ||||
| Swedish Social Democratic Party | 11,963 | 19,651 | 5,318 | 10,368 | 5,700 | 53,000 | 52.88% | 4 | 0 | 4 | |
| Moderate Party | 3,306 | 8,295 | 1,203 | 3,592 | 2,177 | 18,573 | 18.53% | 2 | 0 | 2 | |
| Centre Party | 1,267 | 3,215 | 625 | 1,813 | 709 | 7,629 | 7.61% | 0 | 0 | 0 | |
| Left Party | 1,589 | 2,523 | 624 | 1,224 | 545 | 6,505 | 6.49% | 0 | 0 | 0 | |
| Liberal People's Party | 1,047 | 2,359 | 439 | 885 | 448 | 5,178 | 5.17% | 0 | 0 | 0 | |
| Green Party | 1,067 | 1,787 | 393 | 779 | 404 | 4,430 | 4.42% | 0 | 0 | 0 | |
| Christian Democratic Unity | 629 | 1,497 | 348 | 450 | 361 | 3,285 | 3.28% | 0 | 0 | 0 | |
| New Democracy | 199 | 464 | 74 | 159 | 165 | 1,061 | 1.06% | 0 | 0 | 0 | |
| Other parties | 96 | 230 | 76 | 99 | 73 | 574 | 0.57% | 0 | 0 | 0 | |
| Valid Votes | 21,163 | 40,021 | 9,100 | 19,369 | 10,582 | 100,235 | 100.00% | 6 | 0 | 6 | |
| Invalid votes | 358 | 669 | 157 | 260 | 188 | 1,632 | 1.60% | ||||
| Total Polled | 21,521 | 40,690 | 9,257 | 19,629 | 10,770 | 101,867 | 87.58% | ||||
| Registered Electors | 24,464 | 46,147 | 10,836 | 22,413 | 12,447 | 116,307 | |||||
| Turnout | 87.97% | 88.17% | 85.43% | 87.58% | 86.53% | 87.58% | |||||
1991[]
Results of the 1991 general election held on 15 September 1991:[23][24]
| Party | Votes per municipality | Total Votes | % | Seats | |||||||
|---|---|---|---|---|---|---|---|---|---|---|---|
| Karls -hamn |
Karls -krona |
Olof -ström |
Ronne -by |
Sölves -borg |
Con. | Lev. | Tot. | ||||
| Swedish Social Democratic Party | 10,329 | 16,742 | 4,703 | 9,101 | 4,804 | 45,679 | 46.04% | 4 | 0 | 4 | |
| Moderate Party | 3,315 | 7,970 | 1,228 | 3,288 | 2,185 | 17,986 | 18.13% | 1 | 0 | 1 | |
| Centre Party | 1,527 | 3,650 | 834 | 2,172 | 792 | 8,975 | 9.05% | 1 | 0 | 1 | |
| Liberal People's Party | 1,438 | 3,395 | 613 | 1,300 | 657 | 7,403 | 7.46% | 0 | 0 | 0 | |
| Christian Democratic Unity | 1,244 | 2,717 | 610 | 967 | 632 | 6,170 | 6.22% | 0 | 0 | 0 | |
| New Democracy | 890 | 1,857 | 327 | 882 | 645 | 4,601 | 4.64% | 0 | 0 | 0 | |
| Left Party | 1,083 | 1,589 | 415 | 738 | 289 | 4,114 | 4.15% | 0 | 0 | 0 | |
| Green Party | 688 | 1,058 | 270 | 500 | 292 | 2,808 | 2.83% | 0 | 0 | 0 | |
| Other parties | 386 | 598 | 76 | 297 | 115 | 1,472 | 1.48% | 0 | 0 | 0 | |
| Valid Votes | 20,900 | 39,576 | 9,076 | 19,245 | 10,411 | 99,208 | 100.00% | 6 | 0 | 6 | |
| Invalid votes | 419 | 637 | 188 | 263 | 184 | 1,691 | 1.68% | ||||
| Total Polled | 21,319 | 40,213 | 9,264 | 19,508 | 10,595 | 100,899 | 87.48% | ||||
| Registered Electors | 24,435 | 45,611 | 10,881 | 22,222 | 12,185 | 115,334 | |||||
| Turnout | 87.25% | 88.17% | 85.14% | 87.79% | 86.95% | 87.48% | |||||
1988[]
Results of the 1988 general election held on 18 September 1988:[25][26]
| Party | Votes per municipality | Total Votes | % | Seats | |||||||
|---|---|---|---|---|---|---|---|---|---|---|---|
| Karls -hamn |
Karls -krona |
Olof -ström |
Ronne -by |
Sölves -borg |
Con. | Lev. | Tot. | ||||
| Swedish Social Democratic Party | 11,381 | 19,329 | 5,325 | 10,124 | 5,253 | 51,412 | 52.24% | 4 | 0 | 4 | |
| Moderate Party | 2,506 | 5,994 | 889 | 2,408 | 1,776 | 13,573 | 13.79% | 1 | 0 | 1 | |
| Centre Party | 1,938 | 4,462 | 978 | 2,639 | 1,103 | 11,120 | 11.30% | 1 | 0 | 1 | |
| Liberal People's Party | 1,877 | 4,310 | 738 | 1,654 | 887 | 9,466 | 9.62% | 0 | 0 | 0 | |
| Green Party | 1,160 | 1,989 | 452 | 1,013 | 621 | 5,235 | 5.32% | 0 | 0 | 0 | |
| Left Party – Communists | 1,294 | 1,836 | 479 | 803 | 301 | 4,713 | 4.79% | 0 | 0 | 0 | |
| Christian Democratic Unity | 583 | 1,217 | 335 | 332 | 279 | 2,746 | 2.79% | 0 | 0 | 0 | |
| Other parties | 26 | 93 | 8 | 19 | 13 | 159 | 0.16% | 0 | 0 | 0 | |
| Valid Votes | 20,765 | 39,230 | 9,204 | 18,992 | 10,233 | 98,424 | 100.00% | 6 | 0 | 6 | |
| Invalid votes | 267 | 418 | 128 | 208 | 127 | 1,148 | 1.15% | ||||
| Total Polled | 21,032 | 39,648 | 9,332 | 19,200 | 10,360 | 99,572 | 87.02% | ||||
| Registered Electors | 24,321 | 45,284 | 10,823 | 22,025 | 11,977 | 114,430 | |||||
| Turnout | 86.48% | 87.55% | 86.22% | 87.17% | 86.50% | 87.02% | |||||
1985[]
Results of the 1985 general election held on 15 September 1985:[27][28]
| Party | Votes per municipality | Total Votes | % | Seats | |||||||
|---|---|---|---|---|---|---|---|---|---|---|---|
| Karls -hamn |
Karls -krona |
Olof -ström |
Ronne -by |
Sölves -borg |
Con. | Lev. | Tot. | ||||
| Swedish Social Democratic Party | 11,704 | 20,193 | 5,301 | 10,462 | 5,366 | 53,026 | 51.61% | 3 | 0 | 3 | |
| Moderate Party | 3,401 | 7,844 | 1,249 | 3,296 | 2,277 | 18,067 | 17.58% | 1 | 0 | 1 | |
| Centre Party | 2,359 | 5,077 | 1,273 | 2,821 | 1,261 | 12,791 | 12.45% | 1 | 0 | 1 | |
| Liberal People's Party | 2,503 | 5,708 | 1,071 | 2,240 | 1,256 | 12,778 | 12.44% | 1 | 0 | 1 | |
| Left Party – Communists | 1,259 | 1,721 | 474 | 769 | 327 | 4,550 | 4.43% | 0 | 0 | 0 | |
| Green Party | 286 | 515 | 115 | 304 | 145 | 1,365 | 1.33% | 0 | 0 | 0 | |
| Other parties | 31 | 77 | 13 | 31 | 22 | 174 | 0.17% | 0 | 0 | 0 | |
| Valid Votes | 21,543 | 41,135 | 9,496 | 19,923 | 10,654 | 102,751 | 100.00% | 6 | 0 | 6 | |
| Invalid votes | 185 | 336 | 76 | 140 | 90 | 827 | 0.80% | ||||
| Total Polled | 21,728 | 41,471 | 9,572 | 20,063 | 10,744 | 103,578 | 89.91% | ||||
| Registered Electors | 24,336 | 45,977 | 10,731 | 22,240 | 11,921 | 115,205 | |||||
| Turnout | 89.28% | 90.20% | 89.20% | 90.21% | 90.13% | 89.91% | |||||
1982[]
Results of the 1982 general election held on 19 September 1982:[29][30]
| Party | Votes per municipality | Total Votes | % | Seats | |||||||
|---|---|---|---|---|---|---|---|---|---|---|---|
| Karls -hamn |
Karls -krona |
Olof -ström |
Ronne -by |
Sölves -borg |
Con. | Lev. | Tot. | ||||
| Swedish Social Democratic Party | 11,797 | 20,848 | 5,405 | 10,923 | 5,489 | 54,462 | 52.74% | 4 | 0 | 4 | |
| Moderate Party | 3,763 | 8,429 | 1,365 | 3,488 | 2,412 | 19,457 | 18.84% | 1 | 0 | 1 | |
| Centre Party | 2,981 | 6,279 | 1,549 | 3,728 | 1,597 | 16,134 | 15.62% | 1 | 0 | 1 | |
| Liberal People's Party | 1,068 | 2,748 | 487 | 908 | 591 | 5,802 | 5.62% | 0 | 0 | 0 | |
| Left Party – Communists | 1,145 | 1,569 | 415 | 702 | 320 | 4,151 | 4.02% | 0 | 0 | 0 | |
| Christian Democratic Unity | 474 | 892 | 248 | 169 | 178 | 1,961 | 1.90% | 0 | 0 | 0 | |
| Green Party | 273 | 479 | 96 | 251 | 95 | 1,194 | 1.16% | 0 | 0 | 0 | |
| K-Party | 2 | 7 | 20 | 3 | 1 | 33 | 0.03% | 0 | 0 | 0 | |
| Other parties | 22 | 20 | 7 | 12 | 7 | 68 | 0.07% | 0 | 0 | 0 | |
| Valid Votes | 21,525 | 41,271 | 9,592 | 20,184 | 10,690 | 103,262 | 100.00% | 6 | 0 | 6 | |
| Invalid votes | 168 | 362 | 56 | 145 | 82 | 813 | 0.78% | ||||
| Total Polled | 21,693 | 41,633 | 9,648 | 20,329 | 10,772 | 104,075 | 91.50% | ||||
| Registered Electors | 23,896 | 45,489 | 10,521 | 22,080 | 11,762 | 113,748 | |||||
| Turnout | 90.78% | 91.52% | 91.70% | 92.07% | 91.58% | 91.50% | |||||
1979[]
Results of the 1979 general election held on 16 September 1979:[31][32]
| Party | Votes per municipality | Total Votes | % | Seats | |||||||
|---|---|---|---|---|---|---|---|---|---|---|---|
| Karls -hamn |
Karls -krona |
Olof -ström |
Ronne -by |
Sölves -borg |
Con. | Lev. | Tot. | ||||
| Swedish Social Democratic Party | 10,994 | 19,885 | 5,061 | 10,361 | 5,142 | 51,443 | 49.93% | 3 | 0 | 3 | |
| Moderate Party | 3,254 | 7,446 | 1,230 | 2,988 | 2,216 | 17,134 | 16.63% | 1 | 0 | 1 | |
| Centre Party | 3,208 | 6,496 | 1,576 | 4,049 | 1,638 | 16,967 | 16.47% | 1 | 0 | 1 | |
| Liberal People's Party | 2,200 | 5,547 | 959 | 1,796 | 1,136 | 11,638 | 11.29% | 1 | 0 | 1 | |
| Left Party – Communists | 1,178 | 1,428 | 409 | 674 | 334 | 4,023 | 3.90% | 0 | 0 | 0 | |
| Christian Democratic Unity | 309 | 663 | 192 | 122 | 162 | 1,448 | 1.41% | 0 | 0 | 0 | |
| Communist Party of Sweden | 48 | 45 | 20 | 31 | 0 | 144 | 0.14% | 0 | 0 | 0 | |
| Workers' Party – The Communists | 5 | 4 | 33 | 4 | 3 | 49 | 0.05% | 0 | 0 | 0 | |
| Other parties | 32 | 88 | 13 | 39 | 19 | 191 | 0.19% | 0 | 0 | 0 | |
| Valid Votes | 21,228 | 41,602 | 9,493 | 20,064 | 10,650 | 103,037 | 100.00% | 6 | 0 | 6 | |
| Invalid votes | 128 | 183 | 34 | 84 | 43 | 472 | 0.46% | ||||
| Total Polled | 21,356 | 41,785 | 9,527 | 20,148 | 10,693 | 103,509 | 91.20% | ||||
| Registered Electors | 23,612 | 45,772 | 10,401 | 22,011 | 11,695 | 113,491 | |||||
| Turnout | 90.45% | 91.29% | 91.60% | 91.54% | 91.43% | 91.20% | |||||
1976[]
Results of the 1976 general election held on 19 September 1976:[33][34]
| Party | Votes per municipality | Total Votes | % | Seats | |||||||
|---|---|---|---|---|---|---|---|---|---|---|---|
| Karls -hamn |
Karls -krona |
Olof -ström |
Ronne -by |
Sölves -borg |
Con. | Lev. | Tot. | ||||
| Swedish Social Democratic Party | 10,854 | 19,993 | 4,920 | 10,164 | 5,191 | 51,122 | 49.51% | 3 | 0 | 3 | |
| Centre Party | 4,418 | 8,513 | 2,251 | 5,215 | 2,277 | 22,674 | 21.96% | 1 | 1 | 2 | |
| Moderate Party | 2,451 | 5,691 | 974 | 2,282 | 1,626 | 13,024 | 12.61% | 1 | 0 | 1 | |
| People's Party | 1,895 | 5,412 | 800 | 1,685 | 1,060 | 10,852 | 10.51% | 1 | 0 | 1 | |
| Left Party – Communists | 1,026 | 1,157 | 381 | 575 | 296 | 3,435 | 3.33% | 0 | 0 | 0 | |
| Christian Democratic Unity | 414 | 616 | 219 | 166 | 130 | 1,545 | 1.50% | 0 | 0 | 0 | |
| Communist Party of Sweden | 63 | 95 | 31 | 67 | 2 | 258 | 0.25% | 0 | 0 | 0 | |
| Other parties | 7 | 316 | 7 | 4 | 4 | 338 | 0.33% | 0 | 0 | 0 | |
| Valid Votes | 21,128 | 41,793 | 9,583 | 20,158 | 10,586 | 103,248 | 100.00% | 6 | 1 | 7 | |
| Invalid votes | 69 | 113 | 27 | 71 | 29 | 309 | 0.30% | ||||
| Total Polled | 21,197 | 41,906 | 9,610 | 20,229 | 10,615 | 103,557 | 91.95% | ||||
| Registered Electors | 23,297 | 45,504 | 10,366 | 21,963 | 11,492 | 112,622 | |||||
| Turnout | 90.99% | 92.09% | 92.71% | 92.10% | 92.37% | 91.95% | |||||
1973[]
Results of the 1973 general election held on 16 September 1973:[35][36]
| Party | Votes per municipality | Total Votes | % | Seats | |||||||
|---|---|---|---|---|---|---|---|---|---|---|---|
| Karls -hamn |
Karls -krona |
Olof -ström |
Ronne -by |
Sölves -borg |
Con. | Lev. | Tot. | ||||
| Swedish Social Democratic Party | 10,435 | 19,207 | 4,737 | 9,578 | 4,821 | 48,778 | 49.56% | 3 | 0 | 3 | |
| Centre Party | 4,403 | 8,601 | 2,171 | 5,124 | 2,216 | 22,515 | 22.88% | 2 | 0 | 2 | |
| Moderate Party | 2,325 | 5,068 | 870 | 2,056 | 1,465 | 11,784 | 11.97% | 1 | 0 | 1 | |
| People's Party | 1,433 | 4,737 | 703 | 1,411 | 980 | 9,264 | 9.41% | 0 | 1 | 1 | |
| Left Party – Communists | 1,237 | 1,317 | 413 | 760 | 355 | 4,082 | 4.15% | 0 | 0 | 0 | |
| Christian Democratic Unity | 347 | 785 | 268 | 183 | 161 | 1,744 | 1.77% | 0 | 0 | 0 | |
| Communist Party of Sweden | 56 | 40 | 33 | 30 | 3 | 162 | 0.16% | 0 | 0 | 0 | |
| Communist League Marxist–Leninists (the revolutionaries) | 31 | 19 | 14 | 21 | 3 | 88 | 0.09% | 0 | 0 | 0 | |
| Other parties | 3 | 0 | 5 | 0 | 0 | 8 | 0.01% | 0 | 0 | 0 | |
| Valid Votes | 20,270 | 39,774 | 9,214 | 19,163 | 10,004 | 98,425 | 100.00% | 6 | 1 | 7 | |
| Invalid votes | 14 | 34 | 12 | 29 | 14 | 103 | 0.10% | ||||
| Total Polled | 20,284 | 39,808 | 9,226 | 19,192 | 10,018 | 98,528 | 90.84% | ||||
| Registered Electors | 22,455 | 43,911 | 10,097 | 21,055 | 10,946 | 108,464 | |||||
| Turnout | 90.33% | 90.66% | 91.37% | 91.15% | 91.52% | 90.84% | |||||
1970[]
Results of the 1970 general election held on 20 September 1970:[37][38]
| Party | Votes per municipality | Total Votes | % | Seats | |||||||||||||
|---|---|---|---|---|---|---|---|---|---|---|---|---|---|---|---|---|---|
| Fridlev -stad |
Hasslö | Jämjö | Karls -hamn |
Karls -krona |
Nättra -by |
Olof -ström |
Röde -by |
Ronne -by |
Sölves -borg |
Postal Votes |
Con. | Lev. | Tot. | ||||
| Swedish Social Democratic Party | 1,171 | 550 | 2,550 | 9,528 | 9,981 | 979 | 4,270 | 1,094 | 8,711 | 4,303 | 4,884 | 48,021 | 50.24% | 4 | 0 | 4 | |
| Centre Party | 1,109 | 118 | 1,546 | 3,087 | 2,223 | 362 | 1,548 | 625 | 3,960 | 1,527 | 1,803 | 17,908 | 18.74% | 1 | 0 | 1 | |
| People's Party | 213 | 48 | 684 | 1,898 | 3,915 | 280 | 897 | 336 | 1,809 | 1,215 | 3,255 | 14,550 | 15.22% | 1 | 0 | 1 | |
| Moderate Party | 308 | 9 | 601 | 1,427 | 1,571 | 165 | 628 | 202 | 1,259 | 1,056 | 2,232 | 9,458 | 9.90% | 0 | 0 | 0 | |
| Left Party – Communists | 72 | 80 | 67 | 1,075 | 772 | 76 | 440 | 35 | 650 | 297 | 399 | 3,963 | 4.15% | 0 | 0 | 0 | |
| Christian Democratic Unity | 58 | 56 | 106 | 238 | 287 | 9 | 211 | 43 | 122 | 149 | 266 | 1,545 | 1.62% | 0 | 0 | 0 | |
| Communist League Marxists-Leninists | 0 | 0 | 3 | 57 | 16 | 0 | 2 | 0 | 9 | 5 | 28 | 120 | 0.13% | 0 | 0 | 0 | |
| Other parties | 0 | 0 | 0 | 1 | 0 | 0 | 2 | 0 | 0 | 0 | 8 | 11 | 0.01% | 0 | 0 | 0 | |
| Valid Votes | 2,931 | 861 | 5,557 | 17,311 | 18,765 | 1,871 | 7,998 | 2,335 | 16,520 | 8,552 | 12,875 | 95,576 | 100.00% | 6 | 0 | 6 | |
| Invalid votes | 0 | 0 | 2 | 7 | 15 | 2 | 3 | 2 | 13 | 4 | 55 | 103 | 0.11% | ||||
| Total Polled exc. Postal Votes | 2,931 | 861 | 5,559 | 17,318 | 18,780 | 1,873 | 8,001 | 2,337 | 16,533 | 8,556 | 12,930 | 95,679 | |||||
| Postal Votes | 257 | 40 | 548 | 2,419 | 5,047 | 258 | 929 | 230 | 2,145 | 999 | -12,930 | -58 | |||||
| Total Polled inc. Postal Votes | 3,188 | 901 | 6,107 | 19,737 | 23,827 | 2,131 | 8,930 | 2,567 | 18,678 | 9,555 | 0 | 95,621 | 88.39% | ||||
| Registered Electors | 3,672 | 1,037 | 6,796 | 22,458 | 27,384 | 2,324 | 10,030 | 2,829 | 20,939 | 10,706 | 108,175 | ||||||
| Turnout | 86.82% | 86.89% | 89.86% | 87.88% | 87.01% | 91.70% | 89.03% | 90.74% | 89.20% | 89.25% | 88.39% | ||||||
References[]
- ^ "Population in the country, counties and municipalities on December 31, 2019 and population change in October–December 2019". Stockholm, Sweden: Statistics Sweden. Retrieved 6 April 2020.
- ^ "Members and parties". Stockholm, Sweden: Riksdag. Retrieved 6 April 2020.
- ^ "Valpresentationen 2018: Val till riksdagen - Röster - riksdagsvalkrets Blekinge län" (in Swedish). Solna, Sweden: Election Authority. Retrieved 6 April 2020.
- ^ "Val till riksdagen 2018-09-09: Röster och mandat för partierna" (PDF) (in Swedish). Solna, Sweden: Election Authority. p. 6. Retrieved 17 July 2020.
- ^ "Valpresentationen 2018: Val till riksdagen - Personröster - riksdagsvalkrets Blekinge län" (in Swedish). Solna, Sweden: Election Authority. Retrieved 6 April 2020.
- ^ "2014: Val till riksdagen - Röster - Blekinge län" (in Swedish). Solna, Sweden: Election Authority. Retrieved 6 April 2020.
- ^ "Val till riksdagen 2014-09-14: Röster och mandat för partierna" (PDF) (in Swedish). Solna, Sweden: Election Authority. p. 6. Retrieved 14 March 2020.
- ^ "2014: Val till riksdagen - Personröster - Blekinge län" (in Swedish). Solna, Sweden: Election Authority. Retrieved 6 April 2020.
- ^ "2010: Val till riksdagen - Röster - Blekinge län" (in Swedish). Solna, Sweden: Election Authority. Retrieved 6 April 2020.
- ^ Allmänna valen 2010: Del 1. - Riksdagen den 19 september 2010 (PDF) (in Swedish). Stockholm, Sweden: Statistics Sweden. 30 March 2011. p. 337. ISSN 1654-1006. Retrieved 6 April 2020.
- ^ Allmänna valen 2010: Del 1. - Riksdagen den 19 september 2010 (PDF) (in Swedish). Stockholm, Sweden: Statistics Sweden. 30 March 2011. pp. 362–363. ISSN 1654-1006. Retrieved 6 April 2020.
- ^ "Allmänna val 17 september 2006: Val till riksdagen - Riksdagsvalkrets Blekinge län" (in Swedish). Solna, Sweden: Election Authority. Retrieved 6 April 2020.
- ^ Allmänna valen 2006 Del 1. Riksdagen den 17 september 2006 (PDF) (in Swedish). Stockholm, Sweden: Statistics Sweden. 2007. p. 272. ISBN 978-91-618-1362-9. ISSN 1654-1006. Retrieved 6 April 2020.
- ^ Allmänna valen 2006 Del 1. Riksdagen den 17 september 2006 (PDF) (in Swedish). Stockholm, Sweden: Statistics Sweden. 2007. p. 290. ISBN 978-91-618-1362-9. ISSN 1654-1006. Retrieved 6 April 2020.
- ^ "Blekinge län - Riksdagsval" (in Swedish). Solna, Sweden: Election Authority. Retrieved 6 April 2020.
- ^ Allmänna valen 2002 Del 1. Riksdagen den 15 september 2002 (PDF) (in Swedish). Stockholm, Sweden: Statistics Sweden. 2003. p. 28. ISBN 978-91-618-1362-9. ISSN 1654-1006. Retrieved 6 April 2020.
- ^ Allmänna valen 2002 Del 1. Riksdagen den 15 september 2002 (PDF) (in Swedish). Stockholm, Sweden: Statistics Sweden. 2003. pp. 276–277. ISBN 978-91-618-1362-9. ISSN 1654-1006. Retrieved 6 April 2020.
- ^ Allmänna valen 1998. Del 1, Riksdagen den 20 september 1998 (PDF) (in Swedish). Stockholm, Sweden: Statistics Sweden. 1999. pp. 126–129. ISBN 91-618-1001-0. Retrieved 6 April 2020.
- ^ Allmänna valen 1998. Del 1, Riksdagen den 20 september 1998 (PDF) (in Swedish). Stockholm, Sweden: Statistics Sweden. 1999. p. 30. ISBN 91-618-1001-0. Retrieved 6 April 2020.
- ^ Allmänna valen 1998. Del 1, Riksdagen den 20 september 1998 (PDF) (in Swedish). Stockholm, Sweden: Statistics Sweden. 1999. pp. 281–282. ISBN 91-618-1001-0. Retrieved 6 April 2020.
- ^ Allmänna valen 1994. Del 1, Riksdagsvalet den 18 september 1994 (PDF) (in Swedish). Stockholm, Sweden: Statistics Sweden. 1995. pp. 125–128. ISBN 91-618-0748-6. ISSN 0347-8084. Retrieved 6 April 2020.
- ^ Allmänna valen 1994. Del 1, Riksdagsvalet den 18 september 1994 (PDF) (in Swedish). Stockholm, Sweden: Statistics Sweden. 1995. p. 34. ISBN 91-618-0748-6. ISSN 0347-8084. Retrieved 6 April 2020.
- ^ Allmänna valen 1991. Del 1, Riksdagsvalet den 15 september 1991 (PDF) (in Swedish). Stockholm, Sweden: Statistics Sweden. 1992. pp. 110–113. ISBN 91-618-0508-4. ISSN 0347-8084. Retrieved 6 April 2020.
- ^ Allmänna valen 1991. Del 1, Riksdagsvalet den 15 september 1991 (PDF) (in Swedish). Stockholm, Sweden: Statistics Sweden. 1992. p. 20. ISBN 91-618-0508-4. ISSN 0347-8084. Retrieved 6 April 2020.
- ^ Allmänna valen 1988. Del 1, Riksdagsvalet den 18 september 1988 (PDF) (in Swedish). Stockholm, Sweden: Statistics Sweden. 1989. pp. 73–75. ISBN 91-618-0298-0. ISSN 0347-8084. Retrieved 6 April 2020.
- ^ Allmänna valen 1988. Del 1, Riksdagsvalet den 18 september 1988 (PDF) (in Swedish). Stockholm, Sweden: Statistics Sweden. 1989. p. 21. ISBN 91-618-0298-0. ISSN 0347-8084. Retrieved 6 April 2020.
- ^ Allmänna valen 1985. Del 1, Riksdagsvalet den 15 september 1985 (PDF) (in Swedish). Stockholm, Sweden: Statistics Sweden. 1986. pp. 81–83. ISBN 91-618-0107-0. ISSN 0347-8084. Retrieved 6 April 2020.
- ^ Allmänna valen 1985. Del 1, Riksdagsvalet den 15 september 1985 (PDF) (in Swedish). Stockholm, Sweden: Statistics Sweden. 1986. p. 23. ISBN 91-618-0107-0. ISSN 0347-8084. Retrieved 6 April 2020.
- ^ Allmänna valen 1982. Del 1, Riksdagsvalet den 19 september 1982 (PDF) (in Swedish). Stockholm, Sweden: Statistics Sweden. 1983. pp. 79–81. ISBN 91-38-07261-0. ISSN 0347-8084. Retrieved 6 April 2020.
- ^ Allmänna valen 1982. Del 1, Riksdagsvalet den 19 september 1982 (PDF) (in Swedish). Stockholm, Sweden: Statistics Sweden. 1983. p. 23. ISBN 91-38-07261-0. ISSN 0347-8084. Retrieved 6 April 2020.
- ^ Allmänna valen 1979. Del 1, Riksdagsvalet den 16 september 1979 (PDF) (in Swedish). Stockholm, Sweden: Statistics Sweden. 1983. pp. 79–81. ISBN 91-38-05351-9. Retrieved 6 April 2020.
- ^ Allmänna valen 1979. Del 1, Riksdagsvalet den 16 september 1979 (PDF) (in Swedish). Stockholm, Sweden: Statistics Sweden. 1983. p. 23. ISBN 91-38-05351-9. Retrieved 6 April 2020.
- ^ Allmänna valen 1976. Del 1, Riksdagsvalet den 19 september 1976 (PDF) (in Swedish). Stockholm, Sweden: Statistics Sweden. 1977. pp. 66–68. ISBN 91-38-03530-8. Retrieved 6 April 2020.
- ^ Allmänna valen 1976. Del 1, Riksdagsvalet den 19 september 1976 (PDF) (in Swedish). Stockholm, Sweden: Statistics Sweden. 1977. p. 15. ISBN 91-38-03530-8. Retrieved 6 April 2020.
- ^ Allmänna valen 1973. Del 1, Riksdagsvalet den 26 september 1973 (PDF) (in Swedish). Stockholm, Sweden: Statistics Sweden. 1974. pp. 68–70. ISBN 91-38-01908-6. Retrieved 6 April 2020.
- ^ Allmänna valen 1973. Del 1, Riksdagsvalet den 26 september 1973 (PDF) (in Swedish). Stockholm, Sweden: Statistics Sweden. 1974. p. 17. ISBN 91-38-01908-6. Retrieved 6 April 2020.
- ^ Allmänna valen 1970. Del 1, Riksdagsvalet den 20 september 1970 (PDF) (in Swedish). Stockholm, Sweden: Statistics Sweden. 1971. pp. 88–90. Retrieved 6 April 2020.
- ^ Allmänna valen 1970. Del 1, Riksdagsvalet den 20 september 1970 (PDF) (in Swedish). Stockholm, Sweden: Statistics Sweden. 1971. p. 24. Retrieved 6 April 2020.
- Blekinge County
- Riksdag constituencies
- Riksdag constituencies established in 1970