Jämtland County (Riksdag constituency)
| Jämtland County | |
|---|---|
| Jämtlands Län | |
| Constituency for the Riksdag | |
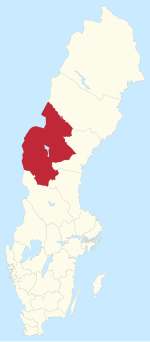 Location of Jämtland County within Sweden | |
| County | Jämtland |
| Population | 130,810 (2019)[1] |
| Electorate | 99,012 (2018) |
| Current constituency | |
| Created | 1970 |
| Seats | List
|
| Member of the Riksdag[2] | List
|
| Regional council | |
| Created from | |
Jämtland County (Swedish: Jämtlands Län) is one of the 29 multi-member constituencies of the Riksdag, the national legislature of Sweden. The constituency was established in 1970 when the Riksdag changed from a bicameral legislature to a unicameral legislature. It is conterminous with the county of Jämtland.
Jämtland County currently elects four of the 349 members of the Riksdag using the modified Sainte-Laguë method open party-list proportional representation electoral system. Parties that receive at least 4% of the vote nationally and other parties that receive at least 12% of the vote in the constituency compete for constituency seats. Supplementary leveling seats may also be allocated at the constituency level to parties that reach the 4% national threshold. At the 2018 general election the constituency had 99,012 registered electors.
Election results[]
Summary[]
| Election | Left V/VPK |
Social Democrats S |
Greens MP |
Liberals L/FP/F |
Centre C |
Moderates M |
Christian Democrats KD/KDS |
Sweden Democrats SD | ||||||||||||||||
|---|---|---|---|---|---|---|---|---|---|---|---|---|---|---|---|---|---|---|---|---|---|---|---|---|
| Votes | % | Seats | Votes | % | Seats | Votes | % | Seats | Votes | % | Seats | Votes | % | Seats | Votes | % | Seats | Votes | % | Seats | Votes | % | Seats | |
| 2018 | 7,179 | 8.42% | 0 | 28,632 | 33.60% | 1 | 3,049 | 3.58% | 0 | 2,439 | 2.86% | 0 | 13,086 | 15.36% | 1 | 12,218 | 14.34% | 1 | 4,118 | 4.83% | 0 | 13,257 | 15.56% | 1 |
| 2014 | 5,252 | 6.27% | 0 | 33,303 | 39.78% | 2 | 4,760 | 5.69% | 0 | 2,370 | 2.83% | 0 | 9,487 | 11.33% | 1 | 14,513 | 17.34% | 1 | 2,119 | 2.53% | 0 | 9,224 | 11.02% | 0 |
| 2010 | 5,340 | 6.52% | 0 | 33,013 | 40.29% | 2 | 5,339 | 6.52% | 0 | 3,155 | 3.85% | 0 | 10,487 | 12.80% | 1 | 18,193 | 22.20% | 1 | 2,340 | 2.86% | 0 | 3,122 | 3.81% | 0 |
| 2006 | 6,484 | 8.31% | 0 | 31,322 | 40.15% | 3 | 3,907 | 5.01% | 0 | 3,226 | 4.13% | 0 | 13,111 | 16.81% | 1 | 13,753 | 17.63% | 1 | 2,914 | 3.74% | 0 | 1,224 | 1.57% | 0 |
| 2002 | 8,469 | 11.02% | 1 | 34,256 | 44.57% | 3 | 3,967 | 5.16% | 0 | 5,569 | 7.25% | 0 | 11,705 | 15.23% | 1 | 7,592 | 9.88% | 0 | 3,874 | 5.04% | 0 | 219 | 0.28% | 0 |
| 1998 | 12,318 | 15.20% | 1 | 33,436 | 41.27% | 2 | 4,592 | 5.67% | 0 | 2,245 | 2.77% | 0 | 9,807 | 12.10% | 1 | 11,156 | 13.77% | 1 | 6,188 | 7.64% | 0 | |||
| 1994 | 6,009 | 6.79% | 0 | 45,434 | 51.34% | 3 | 5,137 | 5.81% | 0 | 3,940 | 4.45% | 0 | 13,270 | 15.00% | 1 | 11,524 | 13.02% | 1 | 2,087 | 2.36% | 0 | |||
| 1991 | 4,057 | 4.65% | 0 | 39,201 | 44.88% | 3 | 2,912 | 3.33% | 0 | 5,849 | 6.70% | 0 | 14,699 | 16.83% | 1 | 11,641 | 13.33% | 1 | 4,054 | 4.64% | 0 | |||
| 1988 | 4,752 | 5.49% | 0 | 43,271 | 50.02% | 3 | 4,306 | 4.98% | 0 | 4,752 | 5.49% | 0 | 15,763 | 18.22% | 1 | 9,106 | 10.53% | 1 | 1,683 | 1.95% | 0 | |||
| 1985 | 4,251 | 4.63% | 0 | 47,107 | 51.32% | 3 | 1,311 | 1.43% | 0 | 8,449 | 9.20% | 0 | 18,046 | 19.66% | 1 | 12,509 | 13.63% | 1 | ||||||
| 1982 | 4,282 | 4.62% | 0 | 48,230 | 52.00% | 3 | 1,497 | 1.61% | 0 | 3,643 | 3.93% | 0 | 20,971 | 22.61% | 1 | 12,625 | 13.61% | 1 | 1,431 | 1.54% | 0 | |||
| 1979 | 4,067 | 4.47% | 0 | 45,898 | 50.41% | 3 | 5,688 | 6.25% | 0 | 23,828 | 26.17% | 2 | 9,809 | 10.77% | 0 | 1,231 | 1.35% | 0 | ||||||
| 1976 | 3,485 | 3.81% | 0 | 43,850 | 47.94% | 3 | 6,395 | 6.99% | 0 | 28,952 | 31.65% | 2 | 7,235 | 7.91% | 0 | 1,232 | 1.35% | 0 | ||||||
| 1973 | 3,609 | 4.16% | 0 | 41,791 | 48.16% | 3 | 6,336 | 7.30% | 0 | 26,389 | 30.41% | 2 | 6,971 | 8.03% | 0 | 1,267 | 1.46% | 0 | ||||||
| 1970 | 2,583 | 3.22% | 0 | 39,995 | 49.80% | 3 | 9,199 | 11.45% | 0 | 19,749 | 24.59% | 2 | 7,059 | 8.79% | 0 | 1,363 | 1.70% | 0 | ||||||
(Excludes leveling seats)
Detailed[]
2018[]
Results of the 2018 general election held on 9 September 2018:[3][4]
| Party | Votes per municipality | Total Votes | % | Seats | ||||||||||
|---|---|---|---|---|---|---|---|---|---|---|---|---|---|---|
| Åre | Berg | Bräcke | Härje -dalen |
Kro -kom |
Öster -sund |
Rag -unda |
Ström -sund |
Con. | Lev. | Tot. | ||||
| Swedish Social Democratic Party | 1,911 | 1,475 | 1,576 | 2,339 | 2,920 | 14,047 | 1,293 | 3,071 | 28,632 | 33.60% | 1 | 1 | 2 | |
| Sweden Democrats | 960 | 906 | 793 | 1,258 | 1,463 | 5,605 | 720 | 1,552 | 13,257 | 15.56% | 1 | 0 | 1 | |
| Centre Party | 1,577 | 779 | 586 | 933 | 1,757 | 5,998 | 510 | 946 | 13,086 | 15.36% | 1 | 0 | 1 | |
| Moderate Party | 1,127 | 704 | 514 | 936 | 1,325 | 6,576 | 272 | 764 | 12,218 | 14.34% | 1 | 0 | 1 | |
| Left Party | 602 | 290 | 307 | 476 | 781 | 3,829 | 318 | 576 | 7,179 | 8.42% | 0 | 0 | 0 | |
| Christian Democrats | 348 | 210 | 161 | 288 | 528 | 2,139 | 137 | 307 | 4,118 | 4.83% | 0 | 0 | 0 | |
| Green Party | 451 | 103 | 58 | 126 | 293 | 1,858 | 53 | 107 | 3,049 | 3.58% | 0 | 0 | 0 | |
| Liberals | 197 | 77 | 60 | 186 | 218 | 1,564 | 57 | 80 | 2,439 | 2.86% | 0 | 0 | 0 | |
| Feminist Initiative | 31 | 17 | 16 | 25 | 23 | 227 | 17 | 18 | 374 | 0.44% | 0 | 0 | 0 | |
| Independent Rural Party | 25 | 20 | 17 | 86 | 20 | 21 | 39 | 8 | 236 | 0.28% | 0 | 0 | 0 | |
| Alternative for Sweden | 17 | 9 | 11 | 26 | 28 | 106 | 13 | 15 | 225 | 0.26% | 0 | 0 | 0 | |
| Citizens' Coalition | 16 | 4 | 7 | 0 | 9 | 76 | 2 | 3 | 117 | 0.14% | 0 | 0 | 0 | |
| Unity | 9 | 10 | 6 | 2 | 7 | 39 | 2 | 5 | 80 | 0.09% | 0 | 0 | 0 | |
| Direct Democrats | 4 | 2 | 13 | 3 | 10 | 29 | 3 | 2 | 66 | 0.08% | 0 | 0 | 0 | |
| Pirate Party | 6 | 0 | 3 | 1 | 5 | 29 | 4 | 11 | 59 | 0.07% | 0 | 0 | 0 | |
| Christian Values Party | 8 | 0 | 0 | 1 | 1 | 8 | 0 | 4 | 22 | 0.03% | 0 | 0 | 0 | |
| Animal Party | 3 | 4 | 2 | 1 | 0 | 6 | 1 | 1 | 18 | 0.02% | 0 | 0 | 0 | |
| Nordic Resistance Movement | 2 | 0 | 1 | 1 | 0 | 8 | 1 | 0 | 13 | 0.02% | 0 | 0 | 0 | |
| Classical Liberal Party | 0 | 0 | 0 | 3 | 1 | 4 | 0 | 2 | 10 | 0.01% | 0 | 0 | 0 | |
| Basic Income Party | 0 | 0 | 0 | 0 | 1 | 0 | 2 | 2 | 5 | 0.01% | 0 | 0 | 0 | |
| Communist Party of Sweden | 0 | 0 | 0 | 3 | 0 | 1 | 0 | 0 | 4 | 0.00% | 0 | 0 | 0 | |
| Initiative | 0 | 0 | 0 | 0 | 1 | 3 | 0 | 0 | 4 | 0.00% | 0 | 0 | 0 | |
| European Workers Party | 1 | 0 | 0 | 0 | 0 | 0 | 0 | 0 | 1 | 0.00% | 0 | 0 | 0 | |
| Security Party | 0 | 0 | 0 | 0 | 0 | 1 | 0 | 0 | 1 | 0.00% | 0 | 0 | 0 | |
| Parties not on the ballot | 2 | 0 | 0 | 3 | 0 | 2 | 2 | 1 | 10 | 0.01% | 0 | 0 | 0 | |
| Valid Votes | 7,297 | 4,610 | 4,131 | 6,697 | 9,391 | 42,176 | 3,446 | 7,475 | 85,223 | 100.00% | 4 | 1 | 5 | |
| Invalid votes – unregistered parties | 3 | 1 | 2 | 0 | 1 | 14 | 0 | 2 | 23 | 0.03% | ||||
| Blank votes | 82 | 46 | 51 | 73 | 123 | 378 | 47 | 103 | 903 | 1.05% | ||||
| Invalid votes – other | 2 | 2 | 1 | 2 | 4 | 29 | 1 | 6 | 47 | 0.05% | ||||
| Total Polled | 7,384 | 4,659 | 4,185 | 6,772 | 9,519 | 42,597 | 3,494 | 7,586 | 86,196 | 87.06% | ||||
| Registered Electors | 8,330 | 5,443 | 4,921 | 8,016 | 10,751 | 48,471 | 4,091 | 8,989 | 99,012 | |||||
| Turnout | 88.64% | 85.60% | 85.04% | 84.48% | 88.54% | 87.88% | 85.41% | 84.39% | 87.06% | |||||
The following candidates were elected:[5] Per Åsling (C), 2,069 votes; (S), 2,941 votes; Saila Quicklund (M), 1,632 votes; Anna-Caren Sätherberg (S), 1,367 votes; and Cassandra Sundin (SD), 70 votes.
2014[]
Results of the 2014 general election held on 14 September 2014:[6][7]
| Party | Votes per municipality | Total Votes | % | Seats | ||||||||||
|---|---|---|---|---|---|---|---|---|---|---|---|---|---|---|
| Åre | Berg | Bräcke | Härje -dalen |
Kro -kom |
Öster -sund |
Rag -unda |
Ström -sund |
Con. | Lev. | Tot. | ||||
| Swedish Social Democratic Party | 2,151 | 1,855 | 2,002 | 2,903 | 3,421 | 15,394 | 1,719 | 3,858 | 33,303 | 39.78% | 2 | 0 | 2 | |
| Moderate Party | 1,467 | 809 | 551 | 1,160 | 1,631 | 7,670 | 333 | 892 | 14,513 | 17.34% | 1 | 0 | 1 | |
| Centre Party | 932 | 742 | 492 | 707 | 1,443 | 3,929 | 454 | 788 | 9,487 | 11.33% | 1 | 0 | 1 | |
| Sweden Democrats | 640 | 671 | 533 | 1,027 | 988 | 3,782 | 491 | 1,092 | 9,224 | 11.02% | 0 | 0 | 0 | |
| Left Party | 332 | 216 | 260 | 349 | 615 | 2,669 | 255 | 556 | 5,252 | 6.27% | 0 | 0 | 0 | |
| Green Party | 601 | 179 | 120 | 200 | 432 | 2,960 | 97 | 171 | 4,760 | 5.69% | 0 | 0 | 0 | |
| Liberal People's Party | 208 | 84 | 86 | 142 | 216 | 1,508 | 43 | 83 | 2,370 | 2.83% | 0 | 0 | 0 | |
| Christian Democrats | 270 | 82 | 57 | 130 | 259 | 1,103 | 58 | 160 | 2,119 | 2.53% | 0 | 0 | 0 | |
| Feminist Initiative | 163 | 84 | 54 | 100 | 185 | 1,283 | 64 | 102 | 2,035 | 2.43% | 0 | 0 | 0 | |
| Pirate Party | 20 | 20 | 18 | 12 | 27 | 180 | 9 | 21 | 307 | 0.37% | 0 | 0 | 0 | |
| Independent Rural Party | 3 | 5 | 35 | 17 | 7 | 12 | 20 | 11 | 110 | 0.13% | 0 | 0 | 0 | |
| Unity | 6 | 2 | 7 | 6 | 13 | 37 | 3 | 4 | 78 | 0.09% | 0 | 0 | 0 | |
| Party of the Swedes | 1 | 4 | 5 | 1 | 3 | 11 | 1 | 7 | 33 | 0.04% | 0 | 0 | 0 | |
| Animal Party | 1 | 0 | 0 | 6 | 4 | 11 | 2 | 4 | 28 | 0.03% | 0 | 0 | 0 | |
| Christian Values Party | 1 | 1 | 0 | 1 | 5 | 16 | 0 | 3 | 27 | 0.03% | 0 | 0 | 0 | |
| Classical Liberal Party | 6 | 1 | 0 | 2 | 0 | 9 | 2 | 0 | 20 | 0.02% | 0 | 0 | 0 | |
| Direct Democrats | 1 | 0 | 2 | 1 | 2 | 4 | 0 | 0 | 10 | 0.01% | 0 | 0 | 0 | |
| Socialist Justice Party | 0 | 0 | 2 | 0 | 0 | 5 | 0 | 0 | 7 | 0.01% | 0 | 0 | 0 | |
| Progressive Party | 0 | 0 | 0 | 0 | 0 | 3 | 0 | 0 | 3 | 0.00% | 0 | 0 | 0 | |
| Communist Party of Sweden | 0 | 0 | 0 | 0 | 0 | 2 | 0 | 0 | 2 | 0.00% | 0 | 0 | 0 | |
| European Workers Party | 1 | 0 | 0 | 0 | 0 | 0 | 0 | 0 | 1 | 0.00% | 0 | 0 | 0 | |
| Health Party | 0 | 0 | 0 | 0 | 1 | 0 | 0 | 0 | 1 | 0.00% | 0 | 0 | 0 | |
| Swedish Senior Citizen Interest Party | 0 | 0 | 0 | 0 | 0 | 0 | 0 | 1 | 1 | 0.00% | 0 | 0 | 0 | |
| Parties not on the ballot | 2 | 2 | 2 | 1 | 1 | 13 | 0 | 2 | 23 | 0.03% | 0 | 0 | 0 | |
| Valid Votes | 6,806 | 4,757 | 4,226 | 6,765 | 9,253 | 40,601 | 3,551 | 7,755 | 83,714 | 100.00% | 4 | 0 | 4 | |
| Blank votes | 86 | 41 | 49 | 73 | 99 | 396 | 46 | 98 | 888 | 1.05% | ||||
| Invalid votes | 1 | 1 | 1 | 4 | 1 | 13 | 2 | 1 | 24 | 0.03% | ||||
| Total Polled | 6,893 | 4,799 | 4,276 | 6,842 | 9,353 | 41,010 | 3,599 | 7,854 | 84,626 | 85.32% | ||||
| Registered Electors | 8,003 | 5,653 | 5,097 | 8,264 | 10,910 | 47,588 | 4,311 | 9,366 | 99,192 | |||||
| Turnout | 86.13% | 84.89% | 83.89% | 82.79% | 85.73% | 86.18% | 83.48% | 83.86% | 85.32% | |||||
The following candidates were elected:[8] Per Åsling (C), 2,378 votes; (S), 3,523 votes; Saila Quicklund (M), 2,264 votes; and Anna-Caren Sätherberg (S), 2,400 votes.
2010[]
Results of the 2010 general election held on 19 September 2010:[9][10]
| Party | Votes per municipality | Total Votes | % | Seats | ||||||||||
|---|---|---|---|---|---|---|---|---|---|---|---|---|---|---|
| Åre | Berg | Bräcke | Härje -dalen |
Kro -kom |
Öster -sund |
Rag -unda |
Ström -sund |
Con. | Lev. | Tot. | ||||
| Swedish Social Democratic Party | 2,052 | 1,842 | 2,178 | 3,004 | 3,302 | 14,844 | 1,799 | 3,992 | 33,013 | 40.29% | 2 | 0 | 2 | |
| Moderate Party | 1,732 | 998 | 767 | 1,498 | 1,905 | 9,384 | 523 | 1,386 | 18,193 | 22.20% | 1 | 0 | 1 | |
| Centre Party | 949 | 819 | 530 | 634 | 1,619 | 4,598 | 491 | 847 | 10,487 | 12.80% | 1 | 0 | 1 | |
| Left Party | 315 | 247 | 298 | 404 | 570 | 2,575 | 283 | 648 | 5,340 | 6.52% | 0 | 0 | 0 | |
| Green Party | 564 | 248 | 167 | 256 | 557 | 3,193 | 125 | 229 | 5,339 | 6.52% | 0 | 0 | 0 | |
| Liberal People's Party | 338 | 125 | 149 | 258 | 287 | 1,753 | 63 | 182 | 3,155 | 3.85% | 0 | 0 | 0 | |
| Sweden Democrats | 204 | 217 | 172 | 470 | 311 | 1,231 | 136 | 381 | 3,122 | 3.81% | 0 | 0 | 0 | |
| Christian Democrats | 257 | 120 | 59 | 158 | 289 | 1,234 | 55 | 168 | 2,340 | 2.86% | 0 | 0 | 0 | |
| Pirate Party | 40 | 24 | 27 | 28 | 44 | 252 | 17 | 24 | 456 | 0.56% | 0 | 0 | 0 | |
| Feminist Initiative | 23 | 4 | 7 | 8 | 23 | 155 | 12 | 5 | 237 | 0.29% | 0 | 0 | 0 | |
| Norrland Coalition Party | 2 | 2 | 5 | 8 | 12 | 42 | 45 | 20 | 136 | 0.17% | 0 | 0 | 0 | |
| Rural Democrats | 7 | 19 | 5 | 5 | 0 | 1 | 0 | 3 | 40 | 0.05% | 0 | 0 | 0 | |
| Socialist Justice Party | 1 | 0 | 3 | 0 | 0 | 10 | 0 | 0 | 14 | 0.02% | 0 | 0 | 0 | |
| Freedom Party | 0 | 3 | 0 | 1 | 4 | 2 | 0 | 0 | 10 | 0.01% | 0 | 0 | 0 | |
| Classical Liberal Party | 1 | 0 | 0 | 0 | 1 | 6 | 0 | 0 | 8 | 0.01% | 0 | 0 | 0 | |
| National Democrats | 1 | 0 | 0 | 0 | 0 | 2 | 0 | 5 | 8 | 0.01% | 0 | 0 | 0 | |
| European Workers Party | 1 | 0 | 0 | 0 | 1 | 1 | 0 | 1 | 4 | 0.00% | 0 | 0 | 0 | |
| Party of the Swedes | 0 | 0 | 0 | 0 | 1 | 2 | 0 | 1 | 4 | 0.00% | 0 | 0 | 0 | |
| Unity | 0 | 0 | 0 | 2 | 0 | 2 | 0 | 0 | 4 | 0.00% | 0 | 0 | 0 | |
| Communist Party of Sweden | 0 | 0 | 0 | 1 | 1 | 1 | 0 | 0 | 3 | 0.00% | 0 | 0 | 0 | |
| Spirits Party | 0 | 0 | 0 | 0 | 0 | 2 | 1 | 0 | 3 | 0.00% | 0 | 0 | 0 | |
| Swedish Senior Citizen Interest Party | 0 | 0 | 0 | 0 | 0 | 1 | 0 | 0 | 1 | 0.00% | 0 | 0 | 0 | |
| Parties not on the ballot | 0 | 2 | 1 | 4 | 0 | 6 | 2 | 4 | 19 | 0.02% | 0 | 0 | 0 | |
| Valid Votes | 6,487 | 4,670 | 4,368 | 6,739 | 8,927 | 39,297 | 3,552 | 7,896 | 81,936 | 100.00% | 4 | 0 | 4 | |
| Blank votes | 124 | 78 | 59 | 117 | 161 | 496 | 71 | 145 | 1,251 | 1.50% | ||||
| Invalid votes | 1 | 1 | 1 | 1 | 2 | 6 | 2 | 2 | 16 | 0.02% | ||||
| Total Polled | 6,612 | 4,749 | 4,428 | 6,857 | 9,090 | 39,799 | 3,625 | 8,043 | 83,203 | 83.08% | ||||
| Registered Electors | 7,926 | 5,901 | 5,391 | 8,510 | 10,931 | 47,215 | 4,506 | 9,764 | 100,144 | |||||
| Turnout | 83.42% | 80.48% | 82.14% | 80.58% | 83.16% | 84.29% | 80.45% | 82.37% | 83.08% | |||||
The following candidates were elected:[11] Per Åsling (C), 3,488 votes; Marie Nordén (S), 3,059 votes; Saila Quicklund (M), 2,023 votes; and Gunnar Sandberg (S), 1,727 votes.
2006[]
Results of the 2006 general election held on 17 September 2006:[12][13]
| Party | Votes per municipality | Total Votes | % | Seats | ||||||||||
|---|---|---|---|---|---|---|---|---|---|---|---|---|---|---|
| Åre | Berg | Bräcke | Härje -dalen |
Kro -kom |
Öster -sund |
Rag -unda |
Ström -sund |
Con. | Lev. | Tot. | ||||
| Swedish Social Democratic Party | 1,883 | 1,631 | 2,034 | 3,023 | 3,169 | 14,052 | 1,597 | 3,933 | 31,322 | 40.15% | 3 | 0 | 3 | |
| Moderate Party | 1,380 | 745 | 632 | 1,137 | 1,319 | 6,985 | 432 | 1,123 | 13,753 | 17.63% | 1 | 0 | 1 | |
| Centre Party | 1,117 | 1,104 | 629 | 852 | 1,832 | 5,787 | 625 | 1,165 | 13,111 | 16.81% | 1 | 0 | 1 | |
| Left Party | 376 | 349 | 410 | 542 | 603 | 2,979 | 396 | 829 | 6,484 | 8.31% | 0 | 0 | 0 | |
| Green Party | 402 | 197 | 134 | 153 | 469 | 2,273 | 99 | 180 | 3,907 | 5.01% | 0 | 0 | 0 | |
| Liberal People's Party | 257 | 99 | 128 | 312 | 294 | 1,823 | 92 | 221 | 3,226 | 4.13% | 0 | 0 | 0 | |
| Christian Democrats | 298 | 189 | 95 | 251 | 340 | 1,405 | 99 | 237 | 2,914 | 3.74% | 0 | 0 | 0 | |
| Sweden Democrats | 90 | 76 | 54 | 179 | 132 | 471 | 67 | 155 | 1,224 | 1.57% | 0 | 0 | 0 | |
| June List | 62 | 101 | 54 | 81 | 103 | 341 | 46 | 113 | 901 | 1.15% | 0 | 0 | 0 | |
| Pirate Party | 45 | 25 | 30 | 39 | 58 | 302 | 20 | 53 | 572 | 0.73% | 0 | 0 | 0 | |
| Feminist Initiative | 19 | 16 | 6 | 18 | 40 | 197 | 7 | 13 | 316 | 0.41% | 0 | 0 | 0 | |
| New Future | 8 | 3 | 11 | 12 | 13 | 38 | 3 | 15 | 103 | 0.13% | 0 | 0 | 0 | |
| Swedish Senior Citizen Interest Party | 3 | 2 | 2 | 7 | 5 | 7 | 3 | 18 | 47 | 0.06% | 0 | 0 | 0 | |
| Unity | 0 | 2 | 2 | 1 | 4 | 26 | 3 | 1 | 39 | 0.05% | 0 | 0 | 0 | |
| Health Care Party | 5 | 2 | 1 | 1 | 4 | 15 | 0 | 1 | 29 | 0.04% | 0 | 0 | 0 | |
| People's Will | 0 | 0 | 0 | 4 | 0 | 15 | 0 | 6 | 25 | 0.03% | 0 | 0 | 0 | |
| Socialist Justice Party | 0 | 0 | 2 | 0 | 0 | 10 | 0 | 0 | 12 | 0.02% | 0 | 0 | 0 | |
| National Socialist Front | 2 | 0 | 0 | 1 | 0 | 2 | 1 | 2 | 8 | 0.01% | 0 | 0 | 0 | |
| Freedom of the Justice Party | 4 | 0 | 0 | 0 | 0 | 0 | 0 | 0 | 4 | 0.01% | 0 | 0 | 0 | |
| The Communists | 1 | 1 | 0 | 0 | 0 | 1 | 0 | 0 | 3 | 0.00% | 0 | 0 | 0 | |
| National Democrats | 0 | 0 | 0 | 0 | 0 | 2 | 0 | 0 | 2 | 0.00% | 0 | 0 | 0 | |
| Unique Party | 0 | 1 | 0 | 0 | 0 | 1 | 0 | 0 | 2 | 0.00% | 0 | 0 | 0 | |
| Kvinnokraft | 0 | 0 | 0 | 0 | 0 | 1 | 0 | 0 | 1 | 0.00% | 0 | 0 | 0 | |
| Other parties | 0 | 1 | 0 | 0 | 2 | 8 | 1 | 1 | 13 | 0.02% | 0 | 0 | 0 | |
| Valid Votes | 5,952 | 4,544 | 4,224 | 6,613 | 8,387 | 36,741 | 3,491 | 8,066 | 78,018 | 100.00% | 5 | 0 | 5 | |
| Blank votes | 149 | 91 | 88 | 130 | 185 | 809 | 91 | 144 | 1,687 | 2.12% | ||||
| Invalid votes | 0 | 5 | 2 | 3 | 1 | 8 | 0 | 4 | 23 | 0.03% | ||||
| Total Polled | 6,101 | 4,640 | 4,314 | 6,746 | 8,573 | 37,558 | 3,582 | 8,214 | 79,728 | 79.82% | ||||
| Registered Electors | 7,664 | 6,015 | 5,563 | 8,698 | 10,709 | 46,354 | 4,650 | 10,235 | 99,888 | |||||
| Turnout | 79.61% | 77.14% | 77.55% | 77.56% | 80.05% | 81.02% | 77.03% | 80.25% | 79.82% | |||||
The following candidates were elected:[14] Berit Andnor (S), 2,277 votes; Per Åsling (C), 2,883 votes; Marie Nordén (S), 1,363 votes; Gunnar Sandberg (S), 1,535 votes; and Ola Sundell (M), 1,686 votes.
2002[]
Results of the 2002 general election held on 15 September 2002:[15][16]
| Party | Votes per municipality | Total Votes | % | Seats | ||||||||||
|---|---|---|---|---|---|---|---|---|---|---|---|---|---|---|
| Åre | Berg | Bräcke | Härje -dalen |
Kro -kom |
Öster -sund |
Rag -unda |
Ström -sund |
Con. | Lev. | Tot. | ||||
| Swedish Social Democratic Party | 2,106 | 1,845 | 2,237 | 3,341 | 3,414 | 15,378 | 1,742 | 4,193 | 34,256 | 44.57% | 3 | 0 | 3 | |
| Centre Party | 965 | 1,046 | 639 | 771 | 1,685 | 4,698 | 634 | 1,267 | 11,705 | 15.23% | 1 | 0 | 1 | |
| Left Party | 488 | 474 | 490 | 809 | 781 | 3,903 | 422 | 1,102 | 8,469 | 11.02% | 1 | 0 | 1 | |
| Moderate Party | 690 | 405 | 356 | 650 | 743 | 3,942 | 270 | 536 | 7,592 | 9.88% | 0 | 1 | 1 | |
| Liberal People's Party | 436 | 255 | 236 | 404 | 439 | 3,271 | 141 | 387 | 5,569 | 7.25% | 0 | 0 | 0 | |
| Green Party | 377 | 253 | 140 | 245 | 522 | 2,065 | 112 | 253 | 3,967 | 5.16% | 0 | 0 | 0 | |
| Christian Democrats | 394 | 321 | 111 | 310 | 421 | 1,850 | 114 | 353 | 3,874 | 5.04% | 0 | 0 | 0 | |
| New Future | 60 | 57 | 50 | 80 | 113 | 259 | 71 | 98 | 788 | 1.03% | 0 | 0 | 0 | |
| Sweden Democrats | 8 | 14 | 5 | 20 | 24 | 119 | 6 | 23 | 219 | 0.28% | 0 | 0 | 0 | |
| Voice of the Free People | 99 | 39 | 2 | 4 | 3 | 59 | 1 | 0 | 207 | 0.27% | 0 | 0 | 0 | |
| Swedish Senior Citizen Interest Party | 7 | 6 | 6 | 3 | 0 | 17 | 4 | 6 | 49 | 0.06% | 0 | 0 | 0 | |
| Norrbotten Party | 1 | 2 | 0 | 5 | 7 | 9 | 3 | 6 | 33 | 0.04% | 0 | 0 | 0 | |
| Socialist Justice Party | 0 | 0 | 2 | 0 | 0 | 3 | 0 | 0 | 5 | 0.01% | 0 | 0 | 0 | |
| Unity | 0 | 0 | 0 | 0 | 0 | 4 | 0 | 0 | 4 | 0.01% | 0 | 0 | 0 | |
| The Communists | 0 | 0 | 0 | 0 | 0 | 0 | 0 | 1 | 1 | 0.00% | 0 | 0 | 0 | |
| Rikshushållarna | 0 | 0 | 0 | 0 | 0 | 0 | 0 | 1 | 1 | 0.00% | 0 | 0 | 0 | |
| Other parties | 9 | 12 | 9 | 8 | 8 | 44 | 6 | 30 | 126 | 0.16% | 0 | 0 | 0 | |
| Valid Votes | 5,640 | 4,729 | 4,283 | 6,650 | 8,160 | 35,621 | 3,526 | 8,256 | 76,865 | 100.00% | 5 | 1 | 6 | |
| Invalid votes | 85 | 58 | 39 | 88 | 121 | 536 | 54 | 96 | 1,077 | 1.38% | ||||
| Total Polled | 5,725 | 4,787 | 4,322 | 6,738 | 8,281 | 36,157 | 3,580 | 8,352 | 77,942 | 77.85% | ||||
| Registered Electors | 7,225 | 6,202 | 5,763 | 8,998 | 10,526 | 45,963 | 4,797 | 10,650 | 100,124 | |||||
| Turnout | 79.24% | 77.18% | 75.00% | 74.88% | 78.67% | 78.67% | 74.63% | 78.42% | 77.85% | |||||
The following candidates were elected:[17] Berit Andnor (S), 570 votes; (S), 1,063 votes; Håkan Larsson (C), 2,652 votes; Camilla Sköld Jansson (V), 1,151 votes; Ola Sundell (M), 1,904 votes; and Margareta Winberg (S), 6,155 votes.
1998[]
Results of the 1998 general election held on 20 September 1998:[18][19]
| Party | Votes per municipality | Total Votes | % | Seats | ||||||||||
|---|---|---|---|---|---|---|---|---|---|---|---|---|---|---|
| Åre | Berg | Bräcke | Härje -dalen |
Kro -kom |
Öster -sund |
Rag -unda |
Ström -sund |
Con. | Lev. | Tot. | ||||
| Swedish Social Democratic Party | 1,978 | 1,820 | 2,296 | 3,333 | 3,397 | 14,316 | 1,840 | 4,456 | 33,436 | 41.27% | 2 | 0 | 2 | |
| Left Party | 809 | 691 | 825 | 1,210 | 1,180 | 5,277 | 700 | 1,626 | 12,318 | 15.20% | 1 | 0 | 1 | |
| Moderate Party | 898 | 574 | 494 | 913 | 1,076 | 6,027 | 400 | 774 | 11,156 | 13.77% | 1 | 0 | 1 | |
| Centre Party | 933 | 1,006 | 556 | 578 | 1,358 | 3,688 | 577 | 1,111 | 9,807 | 12.10% | 1 | 0 | 1 | |
| Christian Democrats | 562 | 394 | 194 | 475 | 673 | 3,185 | 169 | 536 | 6,188 | 7.64% | 0 | 0 | 0 | |
| Green Party | 408 | 285 | 212 | 281 | 573 | 2,330 | 187 | 316 | 4,592 | 5.67% | 0 | 0 | 0 | |
| Liberal People's Party | 209 | 97 | 100 | 198 | 174 | 1,193 | 62 | 212 | 2,245 | 2.77% | 0 | 0 | 0 | |
| Other parties | 77 | 102 | 83 | 141 | 112 | 536 | 106 | 126 | 1,283 | 1.58% | 0 | 0 | 0 | |
| Valid Votes | 5,874 | 4,969 | 4,760 | 7,129 | 8,543 | 36,552 | 4,041 | 9,157 | 81,025 | 100.00% | 5 | 0 | 5 | |
| Invalid votes | 122 | 64 | 53 | 101 | 140 | 693 | 61 | 120 | 1,354 | 1.64% | ||||
| Total Polled | 5,996 | 5,033 | 4,813 | 7,230 | 8,683 | 37,245 | 4,102 | 9,277 | 82,379 | 80.50% | ||||
| Registered Electors | 7,320 | 6,443 | 6,110 | 9,342 | 10,701 | 45,880 | 5,075 | 11,469 | 102,340 | |||||
| Turnout | 81.91% | 78.12% | 78.77% | 77.39% | 81.14% | 81.18% | 80.83% | 80.89% | 80.50% | |||||
The following candidates were elected:[20] (S), 1,072 votes; (C), 1,846 votes; Camilla Sköld (V), 1,849 votes; Ola Sundell (M), 1,953 votes; and Margareta Winberg (S), 6,015 votes.
1994[]
Results of the 1994 general election held on 18 September 1994:[21][22]
| Party | Votes per municipality | Total Votes | % | Seats | ||||||||||
|---|---|---|---|---|---|---|---|---|---|---|---|---|---|---|
| Åre | Berg | Bräcke | Härje -dalen |
Kro -kom |
Öster -sund |
Rag -unda |
Ström -sund |
Con. | Lev. | Tot. | ||||
| Swedish Social Democratic Party | 2,748 | 2,530 | 3,257 | 4,664 | 4,529 | 19,220 | 2,517 | 5,969 | 45,434 | 51.34% | 3 | 0 | 3 | |
| Centre Party | 1,320 | 1,378 | 801 | 872 | 1,761 | 4,832 | 728 | 1,578 | 13,270 | 15.00% | 1 | 0 | 1 | |
| Moderate Party | 916 | 585 | 543 | 947 | 1,091 | 6,196 | 418 | 828 | 11,524 | 13.02% | 1 | 0 | 1 | |
| Left Party | 359 | 302 | 364 | 577 | 570 | 2,679 | 381 | 777 | 6,009 | 6.79% | 0 | 0 | 0 | |
| Green Party | 458 | 255 | 255 | 400 | 598 | 2,522 | 245 | 404 | 5,137 | 5.81% | 0 | 0 | 0 | |
| Liberal People's Party | 296 | 148 | 144 | 314 | 334 | 2,257 | 94 | 353 | 3,940 | 4.45% | 0 | 0 | 0 | |
| Christian Democratic Unity | 188 | 120 | 62 | 135 | 269 | 1,039 | 70 | 204 | 2,087 | 2.36% | 0 | 0 | 0 | |
| New Democracy | 32 | 29 | 16 | 53 | 45 | 238 | 14 | 47 | 474 | 0.54% | 0 | 0 | 0 | |
| Other parties | 53 | 57 | 26 | 62 | 83 | 238 | 26 | 68 | 613 | 0.69% | 0 | 0 | 0 | |
| Valid Votes | 6,370 | 5,404 | 5,468 | 8,024 | 9,280 | 39,221 | 4,493 | 10,228 | 88,488 | 100.00% | 5 | 0 | 5 | |
| Invalid votes | 72 | 53 | 48 | 92 | 101 | 503 | 37 | 92 | 998 | 1.12% | ||||
| Total Polled | 6,442 | 5,457 | 5,516 | 8,116 | 9,381 | 39,724 | 4,530 | 10,320 | 89,486 | 85.56% | ||||
| Registered Electors | 7,473 | 6,570 | 6,480 | 9,789 | 10,835 | 46,076 | 5,269 | 12,099 | 104,591 | |||||
| Turnout | 86.20% | 83.06% | 85.12% | 82.91% | 86.58% | 86.21% | 85.97% | 85.30% | 85.56% | |||||
1991[]
Results of the 1991 general election held on 15 September 1991:[23][24]
| Party | Votes per municipality | Total Votes | % | Seats | ||||||||||
|---|---|---|---|---|---|---|---|---|---|---|---|---|---|---|
| Åre | Berg | Bräcke | Härje -dalen |
Kro -kom |
Öster -sund |
Rag -unda |
Ström -sund |
Con. | Lev. | Tot. | ||||
| Swedish Social Democratic Party | 2,318 | 2,241 | 2,905 | 4,124 | 3,733 | 15,923 | 2,364 | 5,593 | 39,201 | 44.88% | 3 | 0 | 3 | |
| Centre Party | 1,329 | 1,531 | 906 | 1,029 | 1,943 | 5,264 | 883 | 1,814 | 14,699 | 16.83% | 1 | 0 | 1 | |
| Moderate Party | 939 | 582 | 579 | 976 | 1,078 | 6,268 | 389 | 830 | 11,641 | 13.33% | 1 | 0 | 1 | |
| Liberal People's Party | 461 | 206 | 244 | 445 | 457 | 3,377 | 145 | 514 | 5,849 | 6.70% | 0 | 0 | 0 | |
| New Democracy | 443 | 345 | 262 | 498 | 418 | 1,807 | 202 | 404 | 4,379 | 5.01% | 0 | 0 | 0 | |
| Left Party | 249 | 190 | 283 | 397 | 371 | 1,777 | 210 | 580 | 4,057 | 4.65% | 0 | 0 | 0 | |
| Christian Democratic Unity | 341 | 258 | 160 | 240 | 497 | 1,936 | 198 | 424 | 4,054 | 4.64% | 0 | 0 | 0 | |
| Green Party | 269 | 140 | 133 | 216 | 334 | 1,443 | 129 | 248 | 2,912 | 3.33% | 0 | 0 | 0 | |
| Other parties | 30 | 19 | 28 | 134 | 30 | 179 | 70 | 55 | 545 | 0.62% | 0 | 0 | 0 | |
| Valid Votes | 6,379 | 5,512 | 5,500 | 8,059 | 8,861 | 37,974 | 4,590 | 10,462 | 87,337 | 100.00% | 5 | 0 | 5 | |
| Invalid votes | 106 | 61 | 69 | 115 | 147 | 659 | 53 | 136 | 1,346 | 1.52% | ||||
| Total Polled | 6,485 | 5,573 | 5,569 | 8,174 | 9,008 | 38,633 | 4,643 | 10,598 | 88,683 | 84.70% | ||||
| Registered Electors | 7,583 | 6,750 | 6,641 | 9,851 | 10,621 | 45,260 | 5,485 | 12,509 | 104,700 | |||||
| Turnout | 85.52% | 82.56% | 83.86% | 82.98% | 84.81% | 85.36% | 84.65% | 84.72% | 84.70% | |||||
1988[]
Results of the 1988 general election held on 18 September 1988:[25][26]
| Party | Votes per municipality | Total Votes | % | Seats | ||||||||||
|---|---|---|---|---|---|---|---|---|---|---|---|---|---|---|
| Åre | Berg | Bräcke | Härje -dalen |
Kro -kom |
Öster -sund |
Rag -unda |
Ström -sund |
Con. | Lev. | Tot. | ||||
| Swedish Social Democratic Party | 2,641 | 2,450 | 3,232 | 4,550 | 4,081 | 17,416 | 2,662 | 6,239 | 43,271 | 50.02% | 3 | 0 | 3 | |
| Centre Party | 1,442 | 1,678 | 980 | 1,131 | 2,102 | 5,506 | 959 | 1,965 | 15,763 | 18.22% | 1 | 0 | 1 | |
| Moderate Party | 689 | 541 | 467 | 728 | 850 | 4,810 | 297 | 724 | 9,106 | 10.53% | 1 | 0 | 1 | |
| Liberal People's Party | 687 | 316 | 296 | 601 | 569 | 4,224 | 227 | 609 | 7,529 | 8.70% | 0 | 0 | 0 | |
| Left Party – Communists | 293 | 200 | 310 | 488 | 392 | 2,244 | 247 | 578 | 4,752 | 5.49% | 0 | 0 | 0 | |
| Green Party | 374 | 241 | 239 | 391 | 420 | 1,981 | 241 | 419 | 4,306 | 4.98% | 0 | 0 | 0 | |
| Christian Democratic Unity | 151 | 119 | 51 | 103 | 228 | 735 | 75 | 221 | 1,683 | 1.95% | 0 | 0 | 0 | |
| Other parties | 11 | 3 | 6 | 15 | 5 | 51 | 4 | 8 | 103 | 0.12% | 0 | 0 | 0 | |
| Valid Votes | 6,288 | 5,548 | 5,581 | 8,007 | 8,647 | 36,967 | 4,712 | 10,763 | 86,513 | 100.00% | 5 | 0 | 5 | |
| Invalid votes | 55 | 40 | 50 | 74 | 78 | 459 | 29 | 72 | 857 | 0.98% | ||||
| Total Polled | 6,343 | 5,588 | 5,631 | 8,081 | 8,725 | 37,426 | 4,741 | 10,835 | 87,370 | 84.21% | ||||
| Registered Electors | 7,524 | 6,723 | 6,625 | 9,959 | 10,286 | 44,287 | 5,579 | 12,764 | 103,747 | |||||
| Turnout | 84.30% | 83.12% | 85.00% | 81.14% | 84.82% | 84.51% | 84.98% | 84.89% | 84.21% | |||||
1985[]
Results of the 1985 general election held on 15 September 1985:[27][28]
| Party | Votes per municipality | Total Votes | % | Seats | ||||||||||
|---|---|---|---|---|---|---|---|---|---|---|---|---|---|---|
| Åre | Berg | Bräcke | Härje -dalen |
Kro -kom |
Öster -sund |
Rag -unda |
Ström -sund |
Con. | Lev. | Tot. | ||||
| Swedish Social Democratic Party | 2,909 | 2,580 | 3,608 | 5,107 | 4,275 | 18,699 | 3,025 | 6,904 | 47,107 | 51.32% | 3 | 0 | 3 | |
| Centre Party | 1,623 | 1,909 | 1,174 | 1,347 | 2,474 | 6,129 | 1,082 | 2,308 | 18,046 | 19.66% | 1 | 0 | 1 | |
| Moderate Party | 1,000 | 766 | 648 | 1,063 | 1,173 | 6,300 | 446 | 1,113 | 12,509 | 13.63% | 1 | 0 | 1 | |
| Liberal People's Party | 715 | 389 | 343 | 630 | 726 | 4,707 | 309 | 630 | 8,449 | 9.20% | 0 | 0 | 0 | |
| Left Party – Communists | 266 | 200 | 318 | 398 | 379 | 1,927 | 234 | 529 | 4,251 | 4.63% | 0 | 0 | 0 | |
| Green Party | 118 | 51 | 51 | 118 | 149 | 625 | 82 | 117 | 1,311 | 1.43% | 0 | 0 | 0 | |
| Other parties | 13 | 4 | 4 | 8 | 11 | 58 | 7 | 15 | 120 | 0.13% | 0 | 0 | 0 | |
| Valid Votes | 6,644 | 5,899 | 6,146 | 8,671 | 9,187 | 38,445 | 5,185 | 11,616 | 91,793 | 100.00% | 5 | 0 | 5 | |
| Invalid votes | 70 | 28 | 31 | 63 | 59 | 366 | 43 | 57 | 717 | 0.78% | ||||
| Total Polled | 6,714 | 5,927 | 6,177 | 8,734 | 9,246 | 38,811 | 5,228 | 11,673 | 92,510 | 88.34% | ||||
| Registered Electors | 7,637 | 6,884 | 6,916 | 10,195 | 10,405 | 43,655 | 5,830 | 13,200 | 104,722 | |||||
| Turnout | 87.91% | 86.10% | 89.31% | 85.67% | 88.86% | 88.90% | 89.67% | 88.43% | 88.34% | |||||
1982[]
Results of the 1982 general election held on 19 September 1982:[29][30]
| Party | Votes per municipality | Total Votes | % | Seats | ||||||||||
|---|---|---|---|---|---|---|---|---|---|---|---|---|---|---|
| Åre | Berg | Bräcke | Härje -dalen |
Kro -kom |
Öster -sund |
Rag -unda |
Ström -sund |
Con. | Lev. | Tot. | ||||
| Swedish Social Democratic Party | 2,857 | 2,762 | 3,835 | 5,218 | 4,286 | 18,944 | 3,132 | 7,196 | 48,230 | 52.00% | 3 | 0 | 3 | |
| Centre Party | 1,789 | 2,067 | 1,293 | 1,637 | 2,671 | 7,641 | 1,242 | 2,631 | 20,971 | 22.61% | 1 | 0 | 1 | |
| Moderate Party | 1,006 | 760 | 682 | 999 | 1,124 | 6,595 | 433 | 1,026 | 12,625 | 13.61% | 1 | 0 | 1 | |
| Left Party – Communists | 265 | 212 | 304 | 464 | 311 | 1,940 | 199 | 587 | 4,282 | 4.62% | 0 | 0 | 0 | |
| Liberal People's Party | 368 | 176 | 172 | 312 | 315 | 1,840 | 140 | 320 | 3,643 | 3.93% | 0 | 0 | 0 | |
| Green Party | 111 | 81 | 69 | 97 | 143 | 697 | 120 | 179 | 1,497 | 1.61% | 0 | 0 | 0 | |
| Christian Democratic Unity | 139 | 90 | 62 | 95 | 200 | 583 | 66 | 196 | 1,431 | 1.54% | 0 | 0 | 0 | |
| K-Party | 0 | 0 | 0 | 0 | 0 | 0 | 0 | 0 | 0 | 0.00% | 0 | 0 | 0 | |
| Other parties | 6 | 2 | 1 | 6 | 6 | 39 | 5 | 14 | 79 | 0.09% | 0 | 0 | 0 | |
| Valid Votes | 6,541 | 6,150 | 6,418 | 8,828 | 9,056 | 38,279 | 5,337 | 12,149 | 92,758 | 100.00% | 5 | 0 | 5 | |
| Invalid votes | 55 | 22 | 22 | 64 | 35 | 307 | 33 | 71 | 609 | 0.65% | ||||
| Total Polled | 6,596 | 6,172 | 6,440 | 8,892 | 9,091 | 38,586 | 5,370 | 12,220 | 93,367 | 90.00% | ||||
| Registered Electors | 7,373 | 7,020 | 7,043 | 10,185 | 10,066 | 42,637 | 5,860 | 13,555 | 103,739 | |||||
| Turnout | 89.46% | 87.92% | 91.44% | 87.30% | 90.31% | 90.50% | 91.64% | 90.15% | 90.00% | |||||
1979[]
Results of the 1979 general election held on 16 September 1979:[31][32]
| Party | Votes per municipality | Total Votes | % | Seats | ||||||||||
|---|---|---|---|---|---|---|---|---|---|---|---|---|---|---|
| Åre | Berg | Bräcke | Härje -dalen |
Kro -kom |
Öster -sund |
Rag -unda |
Ström -sund |
Con. | Lev. | Tot. | ||||
| Swedish Social Democratic Party | 2,717 | 2,529 | 3,765 | 5,125 | 4,186 | 17,571 | 3,055 | 6,950 | 45,898 | 50.41% | 3 | 0 | 3 | |
| Centre Party | 1,990 | 2,344 | 1,507 | 1,930 | 2,832 | 8,744 | 1,423 | 3,058 | 23,828 | 26.17% | 2 | 0 | 2 | |
| Moderate Party | 762 | 598 | 514 | 710 | 857 | 5,125 | 378 | 865 | 9,809 | 10.77% | 0 | 0 | 0 | |
| Liberal People's Party | 507 | 266 | 261 | 456 | 527 | 2,964 | 212 | 495 | 5,688 | 6.25% | 0 | 0 | 0 | |
| Left Party – Communists | 210 | 236 | 263 | 464 | 290 | 1,870 | 218 | 516 | 4,067 | 4.47% | 0 | 0 | 0 | |
| Christian Democratic Unity | 113 | 80 | 45 | 85 | 164 | 501 | 63 | 180 | 1,231 | 1.35% | 0 | 0 | 0 | |
| Communist Party of Sweden | 6 | 5 | 2 | 14 | 3 | 77 | 2 | 24 | 133 | 0.15% | 0 | 0 | 0 | |
| Workers' Party – The Communists | 1 | 1 | 9 | 0 | 0 | 28 | 3 | 27 | 69 | 0.08% | 0 | 0 | 0 | |
| Other parties | 29 | 19 | 7 | 15 | 72 | 135 | 20 | 28 | 325 | 0.36% | 0 | 0 | 0 | |
| Valid Votes | 6,335 | 6,078 | 6,373 | 8,799 | 8,931 | 37,015 | 5,374 | 12,143 | 91,048 | 100.00% | 5 | 0 | 5 | |
| Invalid votes | 24 | 16 | 30 | 32 | 34 | 223 | 21 | 48 | 428 | 0.47% | ||||
| Total Polled | 6,359 | 6,094 | 6,403 | 8,831 | 8,965 | 37,238 | 5,395 | 12,191 | 91,476 | 89.04% | ||||
| Registered Electors | 7,130 | 7,019 | 7,059 | 10,202 | 10,013 | 41,754 | 5,957 | 13,597 | 102,731 | |||||
| Turnout | 89.19% | 86.82% | 90.71% | 86.56% | 89.53% | 89.18% | 90.57% | 89.66% | 89.04% | |||||
1976[]
Results of the 1976 general election held on 19 September 1976:[33][34]
| Party | Votes per municipality | Total Votes | % | Seats | ||||||||||
|---|---|---|---|---|---|---|---|---|---|---|---|---|---|---|
| Åre | Berg | Bräcke | Härje -dalen |
Kro -kom |
Öster -sund |
Rag -unda |
Ström -sund |
Con. | Lev. | Tot. | ||||
| Swedish Social Democratic Party | 2,667 | 2,382 | 3,694 | 4,957 | 4,011 | 16,352 | 3,015 | 6,772 | 43,850 | 47.94% | 3 | 0 | 3 | |
| Centre Party | 2,245 | 2,572 | 1,927 | 2,300 | 3,234 | 11,308 | 1,662 | 3,704 | 28,952 | 31.65% | 2 | 0 | 2 | |
| Moderate Party | 598 | 449 | 367 | 489 | 650 | 3,793 | 284 | 605 | 7,235 | 7.91% | 0 | 0 | 0 | |
| People's Party | 581 | 347 | 295 | 496 | 585 | 3,358 | 217 | 516 | 6,395 | 6.99% | 0 | 0 | 0 | |
| Left Party – Communists | 162 | 193 | 277 | 400 | 222 | 1,435 | 203 | 593 | 3,485 | 3.81% | 0 | 0 | 0 | |
| Christian Democratic Unity | 143 | 75 | 41 | 97 | 163 | 471 | 77 | 165 | 1,232 | 1.35% | 0 | 0 | 0 | |
| Communist Party of Sweden | 13 | 7 | 10 | 27 | 22 | 172 | 6 | 46 | 303 | 0.33% | 0 | 0 | 0 | |
| Other parties | 3 | 2 | 1 | 2 | 3 | 10 | 0 | 1 | 22 | 0.02% | 0 | 0 | 0 | |
| Valid Votes | 6,412 | 6,027 | 6,612 | 8,768 | 8,890 | 36,899 | 5,464 | 12,402 | 91,474 | 100.00% | 5 | 0 | 5 | |
| Invalid votes | 14 | 11 | 18 | 17 | 23 | 126 | 15 | 21 | 245 | 0.27% | ||||
| Total Polled | 6,426 | 6,038 | 6,630 | 8,785 | 8,913 | 37,025 | 5,479 | 12,423 | 91,719 | 90.42% | ||||
| Registered Electors | 7,065 | 6,898 | 7,181 | 10,062 | 9,858 | 40,800 | 5,951 | 13,627 | 101,442 | |||||
| Turnout | 90.96% | 87.53% | 92.33% | 87.31% | 90.41% | 90.75% | 92.07% | 91.16% | 90.42% | |||||
1973[]
Results of the 1973 general election held on 16 September 1973:[35][36]
| Party | Votes per municipality | Total Votes | % | Seats | ||||||||||
|---|---|---|---|---|---|---|---|---|---|---|---|---|---|---|
| Åre | Berg | Bräcke | Härje -dalen |
Kro -kom |
Öster -sund |
Rag -unda |
Ström -sund |
Con. | Lev. | Tot. | ||||
| Swedish Social Democratic Party | 2,586 | 2,326 | 3,720 | 4,610 | 3,808 | 14,980 | 3,034 | 6,727 | 41,791 | 48.16% | 3 | 0 | 3 | |
| Centre Party | 2,015 | 2,436 | 1,785 | 2,096 | 2,958 | 10,142 | 1,516 | 3,441 | 26,389 | 30.41% | 2 | 0 | 2 | |
| Moderate Party | 538 | 472 | 415 | 446 | 649 | 3,444 | 384 | 623 | 6,971 | 8.03% | 0 | 0 | 0 | |
| People's Party | 703 | 409 | 302 | 507 | 651 | 2,967 | 217 | 580 | 6,336 | 7.30% | 0 | 0 | 0 | |
| Left Party – Communists | 189 | 213 | 292 | 509 | 261 | 1,236 | 247 | 662 | 3,609 | 4.16% | 0 | 0 | 0 | |
| Christian Democratic Unity | 122 | 92 | 56 | 93 | 205 | 454 | 66 | 179 | 1,267 | 1.46% | 0 | 0 | 0 | |
| Communist Party of Sweden | 10 | 24 | 10 | 32 | 13 | 150 | 3 | 62 | 304 | 0.35% | 0 | 0 | 0 | |
| Communist League Marxist–Leninists (the revolutionaries) | 1 | 6 | 2 | 5 | 14 | 59 | 1 | 8 | 96 | 0.11% | 0 | 0 | 0 | |
| Other parties | 0 | 0 | 0 | 0 | 0 | 7 | 0 | 4 | 11 | 0.01% | 0 | 0 | 0 | |
| Valid Votes | 6,164 | 5,978 | 6,582 | 8,298 | 8,559 | 33,439 | 5,468 | 12,286 | 86,774 | 100.00% | 5 | 0 | 5 | |
| Invalid votes | 9 | 7 | 5 | 22 | 6 | 48 | 8 | 9 | 114 | 0.13% | ||||
| Total Polled | 6,173 | 5,985 | 6,587 | 8,320 | 8,565 | 33,487 | 5,476 | 12,295 | 86,888 | 89.51% | ||||
| Registered Electors | 6,814 | 6,863 | 7,150 | 9,694 | 9,633 | 37,397 | 5,980 | 13,538 | 97,069 | |||||
| Turnout | 90.59% | 87.21% | 92.13% | 85.83% | 88.91% | 89.54% | 91.57% | 90.82% | 89.51% | |||||
1970[]
Results of the 1970 general election held on 20 September 1970:[37][38]
| Party | Votes per municipality | Total Votes | % | Seats | ||||||||||||||||||||||||||||
|---|---|---|---|---|---|---|---|---|---|---|---|---|---|---|---|---|---|---|---|---|---|---|---|---|---|---|---|---|---|---|---|---|
| Alsen | Åre | Berg | Bräcke | Fors | Föl -linge |
Frost -viken |
Hag -dal |
Hallen | Hammer -dal |
Hede | Käl -arne |
Kali | Lillhär -dal |
Mörsil | Offer -dal |
Öster -sund |
Rag -unda |
Rev -sund |
Rodon | Ström | Stugun | Sveg | Tännäs | Under -soker |
Postal Votes |
Con. | Lev. | Tot. | ||||
| Swedish Social Democratic Party | 368 | 573 | 2,198 | 1,072 | 714 | 750 | 686 | 686 | 217 | 1,125 | 848 | 992 | 261 | 447 | 573 | 670 | 12,135 | 1,251 | 1,319 | 1,598 | 2,468 | 864 | 1,609 | 537 | 754 | 5,280 | 39,995 | 49.80% | 3 | 0 | 3 | |
| Centre Party | 221 | 232 | 1,997 | 320 | 301 | 491 | 166 | 233 | 372 | 722 | 375 | 368 | 183 | 89 | 278 | 621 | 6,122 | 570 | 628 | 891 | 730 | 293 | 481 | 206 | 350 | 2,509 | 19,749 | 24.59% | 2 | 0 | 2 | |
| People's Party | 77 | 280 | 514 | 96 | 84 | 211 | 57 | 66 | 105 | 214 | 134 | 86 | 58 | 76 | 162 | 192 | 3,371 | 108 | 181 | 318 | 338 | 32 | 198 | 119 | 169 | 1,953 | 9,199 | 11.45% | 0 | 0 | 0 | |
| Moderate Party | 90 | 104 | 501 | 109 | 66 | 126 | 31 | 70 | 73 | 146 | 41 | 114 | 40 | 11 | 89 | 158 | 2,420 | 127 | 155 | 264 | 210 | 153 | 112 | 81 | 129 | 1,639 | 7,059 | 8.79% | 0 | 0 | 0 | |
| Left Party – Communists | 33 | 28 | 164 | 75 | 51 | 34 | 22 | 98 | 8 | 44 | 90 | 91 | 10 | 29 | 42 | 10 | 737 | 69 | 79 | 128 | 100 | 70 | 187 | 24 | 30 | 330 | 2,583 | 3.22% | 0 | 0 | 0 | |
| Christian Democratic Unity | 19 | 32 | 100 | 7 | 7 | 90 | 11 | 10 | 21 | 46 | 12 | 14 | 5 | 12 | 11 | 50 | 409 | 42 | 11 | 45 | 39 | 5 | 46 | 5 | 25 | 289 | 1,363 | 1.70% | 0 | 0 | 0 | |
| Communist League Marxists-Leninists | 4 | 5 | 23 | 2 | 1 | 3 | 6 | 12 | 4 | 8 | 3 | 3 | 0 | 2 | 3 | 4 | 89 | 4 | 6 | 9 | 26 | 8 | 12 | 1 | 1 | 125 | 364 | 0.45% | 0 | 0 | 0 | |
| Other parties | 0 | 0 | 0 | 0 | 0 | 0 | 0 | 0 | 0 | 0 | 0 | 0 | 0 | 0 | 0 | 0 | 0 | 0 | 0 | 0 | 0 | 0 | 0 | 0 | 0 | 7 | 7 | 0.01% | 0 | 0 | 0 | |
| Valid Votes | 812 | 1,254 | 5,497 | 1,681 | 1,224 | 1,705 | 979 | 1,175 | 800 | 2,305 | 1,503 | 1,668 | 557 | 666 | 1,158 | 1,705 | 25,283 | 2,171 | 2,379 | 3,253 | 3,911 | 1,425 | 2,645 | 973 | 1,458 | 12,132 | 80,319 | 100.00% | 5 | 0 | 5 | |
| Invalid votes | 3 | 0 | 4 | 3 | 1 | 2 | 0 | 0 | 1 | 1 | 1 | 0 | 1 | 0 | 5 | 0 | 20 | 0 | 3 | 2 | 2 | 0 | 0 | 0 | 0 | 28 | 77 | 0.10% | ||||
| Total Polled exc. Postal Votes | 815 | 1,254 | 5,501 | 1,684 | 1,225 | 1,707 | 979 | 1,175 | 801 | 2,306 | 1,504 | 1,668 | 558 | 666 | 1,163 | 1,705 | 25,303 | 2,171 | 2,382 | 3,255 | 3,913 | 1,425 | 2,645 | 973 | 1,458 | 12,160 | 80,396 | |||||
| Postal Votes | 68 | 264 | 528 | 380 | 300 | 260 | 194 | 91 | 83 | 280 | 136 | 226 | 60 | 69 | 253 | 163 | 5,736 | 308 | 343 | 483 | 643 | 226 | 403 | 280 | 377 | -12,160 | -6 | |||||
| Total Polled inc. Postal Votes | 883 | 1,518 | 6,029 | 2,064 | 1,525 | 1,967 | 1,173 | 1,266 | 884 | 2,586 | 1,640 | 1,894 | 618 | 735 | 1,416 | 1,868 | 31,039 | 2,479 | 2,725 | 3,738 | 4,556 | 1,651 | 3,048 | 1,253 | 1,835 | 0 | 80,390 | 86.82% | ||||
| Registered Electors | 1,033 | 1,741 | 7,196 | 2,298 | 1,762 | 2,299 | 1,369 | 1,557 | 1,068 | 2,856 | 2,022 | 2,080 | 757 | 894 | 1,586 | 2,206 | 35,595 | 2,761 | 3,048 | 4,328 | 5,120 | 1,800 | 3,642 | 1,516 | 2,063 | 92,597 | ||||||
| Turnout | 85.48% | 87.19% | 83.78% | 89.82% | 86.55% | 85.56% | 85.68% | 81.31% | 82.77% | 90.55% | 81.11% | 91.06% | 81.64% | 82.21% | 89.28% | 84.68% | 87.20% | 89.79% | 89.40% | 86.37% | 88.98% | 91.72% | 83.69% | 82.65% | 88.95% | 86.82% | ||||||
References[]
- ^ "Population in the country, counties and municipalities on December 31, 2019 and population change in October–December 2019". Stockholm, Sweden: Statistics Sweden. Retrieved 8 May 2020.
- ^ "Members and parties". Stockholm, Sweden: Riksdag. Retrieved 8 May 2020.
- ^ "Valpresentationen 2018: Val till riksdagen - Röster - riksdagsvalkrets Jämtlands län" (in Swedish). Solna, Sweden: Election Authority. Retrieved 8 May 2020.
- ^ "Val till riksdagen 2018-09-09: Röster och mandat för partierna" (PDF) (in Swedish). Solna, Sweden: Election Authority. p. 15. Retrieved 17 July 2020.
- ^ "Valpresentationen 2018: Val till riksdagen - Personröster - riksdagsvalkrets Jämtlands län" (in Swedish). Solna, Sweden: Election Authority. Retrieved 8 May 2020.
- ^ "2014: Val till riksdagen - Röster - Jämtlands län" (in Swedish). Solna, Sweden: Election Authority. Retrieved 8 May 2020.
- ^ "Val till riksdagen 2014-09-14: Röster och mandat för partierna" (PDF) (in Swedish). Solna, Sweden: Election Authority. p. 14. Retrieved 14 March 2020.
- ^ "2014: Val till riksdagen - Personröster - Jämtlands län" (in Swedish). Solna, Sweden: Election Authority. Retrieved 8 May 2020.
- ^ "2010: Val till riksdagen - Röster - Jämtlands län" (in Swedish). Solna, Sweden: Election Authority. Retrieved 8 May 2020.
- ^ "Allmänna valen 2010: Del 1. - Riksdagen den 19 september 2010" (PDF). Allmänna Valen. = del 1, Riksdagen [General Elections in ... Part 1, Election to the Riksdag in ...] (in Swedish). Stockholm, Sweden: Statistics Sweden: 337. 30 March 2011. ISSN 1654-1006. Retrieved 6 April 2020.CS1 maint: extra punctuation (link)
- ^ "Allmänna valen 2010: Del 1. - Riksdagen den 19 september 2010" (PDF). Allmänna Valen. = del 1, Riksdagen [General Elections in ... Part 1, Election to the Riksdag in ...] (in Swedish). Stockholm, Sweden: Statistics Sweden: 374. 30 March 2011. ISSN 1654-1006. Retrieved 6 April 2020.CS1 maint: extra punctuation (link)
- ^ "Allmänna val 17 september 2006: Val till riksdagen - Riksdagsvalkrets Jämtlands län" (in Swedish). Solna, Sweden: Election Authority. Retrieved 10 May 2020.
- ^ Allmänna valen 2006 Del 1. Riksdagen den 17 september 2006 (PDF) (in Swedish). Stockholm, Sweden: Statistics Sweden. 2007. p. 272. ISBN 978-91-618-1362-9. ISSN 1654-1006. Retrieved 6 April 2020.
- ^ Allmänna valen 2006 Del 1. Riksdagen den 17 september 2006 (PDF) (in Swedish). Stockholm, Sweden: Statistics Sweden. 2007. p. 299. ISBN 978-91-618-1362-9. ISSN 1654-1006. Retrieved 6 April 2020.
- ^ "Jämtlands län - Riksdagsval" (in Swedish). Solna, Sweden: Election Authority. Retrieved 18 April 2020.
- ^ Allmänna valen 2002 Del 1. Riksdagen den 15 september 2002 (PDF) (in Swedish). Stockholm, Sweden: Statistics Sweden. 2003. p. 28. ISBN 978-91-618-1362-9. ISSN 1654-1006. Retrieved 6 April 2020.
- ^ Allmänna valen 2002 Del 1. Riksdagen den 15 september 2002 (PDF) (in Swedish). Stockholm, Sweden: Statistics Sweden. 2003. p. 286. ISBN 978-91-618-1362-9. ISSN 1654-1006. Retrieved 6 April 2020.
- ^ Allmänna valen 1998. Del 1, Riksdagen den 20 september 1998 (PDF) (in Swedish). Stockholm, Sweden: Statistics Sweden. 1999. pp. 249–253. ISBN 91-618-1001-0. Retrieved 6 April 2020.
- ^ Allmänna valen 1998. Del 1, Riksdagen den 20 september 1998 (PDF) (in Swedish). Stockholm, Sweden: Statistics Sweden. 1999. p. 30. ISBN 91-618-1001-0. Retrieved 6 April 2020.
- ^ Allmänna valen 1998. Del 1, Riksdagen den 20 september 1998 (PDF) (in Swedish). Stockholm, Sweden: Statistics Sweden. 1999. pp. 291–292. ISBN 91-618-1001-0. Retrieved 6 April 2020.
- ^ Allmänna valen 1994. Del 1, Riksdagsvalet den 18 september 1994 (PDF) (in Swedish). Stockholm, Sweden: Statistics Sweden. 1995. pp. 246–250. ISBN 91-618-0748-6. ISSN 0347-8084. Retrieved 6 April 2020.
- ^ Allmänna valen 1994. Del 1, Riksdagsvalet den 18 september 1994 (PDF) (in Swedish). Stockholm, Sweden: Statistics Sweden. 1995. p. 34. ISBN 91-618-0748-6. ISSN 0347-8084. Retrieved 6 April 2020.
- ^ Allmänna valen 1991. Del 1, Riksdagsvalet den 15 september 1991 (PDF) (in Swedish). Stockholm, Sweden: Statistics Sweden. 1992. pp. 229–233. ISBN 91-618-0508-4. ISSN 0347-8084. Retrieved 6 April 2020.
- ^ Allmänna valen 1991. Del 1, Riksdagsvalet den 15 september 1991 (PDF) (in Swedish). Stockholm, Sweden: Statistics Sweden. 1992. p. 20. ISBN 91-618-0508-4. ISSN 0347-8084. Retrieved 6 April 2020.
- ^ Allmänna valen 1988. Del 1, Riksdagsvalet den 18 september 1988 (PDF) (in Swedish). Stockholm, Sweden: Statistics Sweden. 1989. pp. 148–150. ISBN 91-618-0298-0. ISSN 0347-8084. Retrieved 6 April 2020.
- ^ Allmänna valen 1988. Del 1, Riksdagsvalet den 18 september 1988 (PDF) (in Swedish). Stockholm, Sweden: Statistics Sweden. 1989. p. 21. ISBN 91-618-0298-0. ISSN 0347-8084. Retrieved 6 April 2020.
- ^ Allmänna valen 1985. Del 1, Riksdagsvalet den 15 september 1985 (PDF) (in Swedish). Stockholm, Sweden: Statistics Sweden. 1986. pp. 165–168. ISBN 91-618-0107-0. ISSN 0347-8084. Retrieved 6 April 2020.
- ^ Allmänna valen 1985. Del 1, Riksdagsvalet den 15 september 1985 (PDF) (in Swedish). Stockholm, Sweden: Statistics Sweden. 1986. p. 23. ISBN 91-618-0107-0. ISSN 0347-8084. Retrieved 6 April 2020.
- ^ Allmänna valen 1982. Del 1, Riksdagsvalet den 19 september 1982 (PDF) (in Swedish). Stockholm, Sweden: Statistics Sweden. 1983. pp. 164–167. ISBN 91-38-07261-0. ISSN 0347-8084. Retrieved 6 April 2020.
- ^ Allmänna valen 1982. Del 1, Riksdagsvalet den 19 september 1982 (PDF) (in Swedish). Stockholm, Sweden: Statistics Sweden. 1983. p. 23. ISBN 91-38-07261-0. ISSN 0347-8084. Retrieved 6 April 2020.
- ^ Allmänna valen 1979. Del 1, Riksdagsvalet den 16 september 1979 (PDF) (in Swedish). Stockholm, Sweden: Statistics Sweden. 1983. pp. 163–166. ISBN 91-38-05351-9. Retrieved 6 April 2020.
- ^ Allmänna valen 1979. Del 1, Riksdagsvalet den 16 september 1979 (PDF) (in Swedish). Stockholm, Sweden: Statistics Sweden. 1983. p. 23. ISBN 91-38-05351-9. Retrieved 6 April 2020.
- ^ Allmänna valen 1976. Del 1, Riksdagsvalet den 19 september 1976 (PDF) (in Swedish). Stockholm, Sweden: Statistics Sweden. 1977. pp. 140–143. ISBN 91-38-03530-8. Retrieved 6 April 2020.
- ^ Allmänna valen 1976. Del 1, Riksdagsvalet den 19 september 1976 (PDF) (in Swedish). Stockholm, Sweden: Statistics Sweden. 1977. p. 15. ISBN 91-38-03530-8. Retrieved 6 April 2020.
- ^ Allmänna valen 1973. Del 1, Riksdagsvalet den 26 september 1973 (PDF) (in Swedish). Stockholm, Sweden: Statistics Sweden. 1974. pp. 144–147. ISBN 91-38-01908-6. Retrieved 6 April 2020.
- ^ Allmänna valen 1973. Del 1, Riksdagsvalet den 26 september 1973 (PDF) (in Swedish). Stockholm, Sweden: Statistics Sweden. 1974. p. 17. ISBN 91-38-01908-6. Retrieved 6 April 2020.
- ^ Allmänna valen 1970. Del 1, Riksdagsvalet den 20 september 1970 (PDF) (in Swedish). Stockholm, Sweden: Statistics Sweden. 1971. pp. 187–192. Retrieved 6 April 2020.
- ^ Allmänna valen 1970. Del 1, Riksdagsvalet den 20 september 1970 (PDF) (in Swedish). Stockholm, Sweden: Statistics Sweden. 1971. p. 24. Retrieved 6 April 2020.
- Jämtland County
- Riksdag constituencies
- Riksdag constituencies established in 1970