Uppsala County (Riksdag constituency)
| Uppsala County | |
|---|---|
| Uppsala Län | |
| Constituency for the Riksdag | |
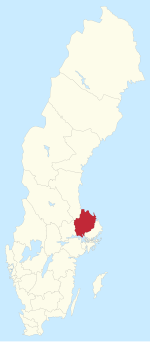 Location of Uppsala County within Sweden | |
| County | Uppsala |
| Population | 383,713 (2019)[1] |
| Electorate | 273,898 (2018) |
| Current constituency | |
| Created | 1970 |
| Seats | List
|
| Member of the Riksdag[2] | List
|
| Regional council | |
| Created from | |
Uppsala County (Swedish: Uppsala Län) is one of the 29 multi-member constituencies of the Riksdag, the national legislature of Sweden. The constituency was established in 1970 when the Riksdag changed from a bicameral legislature to a unicameral legislature. It is conterminous with the county of Uppsala.
Uppsala County currently elects 11 of the 349 members of the Riksdag using the modified Sainte-Laguë method open party-list proportional representation electoral system. Parties that receive at least 4% of the vote nationally and other parties that receive at least 12% of the vote in the constituency compete for constituency seats. Supplementary leveling seats may also be allocated at the constituency level to parties that reach the 4% national threshold. At the 2018 general election the constituency had 273,898 registered electors.
Election results[]
Summary[]
| Election | Left V/VPK |
Social Democrats S |
Greens MP |
Liberals L/FP/F |
Centre C |
Moderates M |
Christian Democrats KD/KDS |
Sweden Democrats SD | ||||||||||||||||
|---|---|---|---|---|---|---|---|---|---|---|---|---|---|---|---|---|---|---|---|---|---|---|---|---|
| Votes | % | Seats | Votes | % | Seats | Votes | % | Seats | Votes | % | Seats | Votes | % | Seats | Votes | % | Seats | Votes | % | Seats | Votes | % | Seats | |
| 2018 | 21,102 | 8.74% | 1 | 65,168 | 26.99% | 3 | 13,404 | 5.55% | 0 | 15,071 | 6.24% | 1 | 22,246 | 9.21% | 1 | 45,790 | 18.96% | 2 | 16,661 | 6.90% | 1 | 37,297 | 15.44% | 2 |
| 2014 | 14,363 | 6.29% | 1 | 65,926 | 28.87% | 3 | 19,080 | 8.36% | 1 | 14,141 | 6.19% | 1 | 15,827 | 6.93% | 1 | 52,071 | 22.80% | 3 | 10,776 | 4.72% | 0 | 24,091 | 10.55% | 1 |
| 2010 | 11,845 | 5.51% | 0 | 58,862 | 27.37% | 3 | 18,993 | 8.83% | 1 | 16,878 | 7.85% | 1 | 17,838 | 8.30% | 1 | 64,750 | 30.11% | 4 | 12,265 | 5.70% | 1 | 10,003 | 4.65% | 0 |
| 2006 | 11,240 | 5.72% | 0 | 60,674 | 30.89% | 4 | 12,312 | 6.27% | 1 | 17,929 | 9.13% | 1 | 19,340 | 9.85% | 1 | 52,016 | 26.49% | 3 | 12,976 | 6.61% | 1 | 4,483 | 2.28% | 0 |
| 2002 | 14,372 | 8.15% | 1 | 66,035 | 37.43% | 4 | 10,062 | 5.70% | 0 | 27,594 | 15.64% | 2 | 12,002 | 6.80% | 0 | 26,482 | 15.01% | 2 | 15,646 | 8.87% | 1 | 2,423 | 1.37% | 0 |
| 1998 | 18,620 | 10.95% | 1 | 58,503 | 34.39% | 4 | 9,658 | 5.68% | 0 | 10,616 | 6.24% | 1 | 9,855 | 5.79% | 0 | 40,546 | 23.84% | 3 | 18,135 | 10.66% | 1 | |||
| 1994 | 10,333 | 5.85% | 0 | 75,620 | 42.85% | 5 | 10,816 | 6.13% | 0 | 15,803 | 8.95% | 1 | 13,895 | 7.87% | 1 | 39,479 | 22.37% | 3 | 6,743 | 3.82% | 0 | |||
| 1991 | 7,560 | 4.52% | 0 | 58,981 | 35.26% | 4 | 7,257 | 4.34% | 0 | 18,771 | 11.22% | 1 | 15,107 | 9.03% | 1 | 36,878 | 22.05% | 2 | 9,633 | 5.76% | 0 | |||
| 1988 | 10,022 | 6.24% | 0 | 65,580 | 40.82% | 5 | 9,148 | 5.69% | 0 | 21,854 | 13.60% | 1 | 19,765 | 12.30% | 1 | 29,516 | 18.37% | 2 | 3,224 | 2.01% | 0 | |||
| 1985 | 9,070 | 5.57% | 0 | 70,602 | 43.32% | 4 | 2,850 | 1.75% | 0 | 25,133 | 15.42% | 2 | 20,629 | 12.66% | 1 | 33,377 | 20.48% | 2 | ||||||
| 1982 | 9,777 | 6.11% | 0 | 71,368 | 44.58% | 5 | 3,248 | 2.03% | 0 | 10,086 | 6.30% | 0 | 27,027 | 16.88% | 2 | 35,693 | 22.30% | 2 | 2,353 | 1.47% | 0 | |||
| 1979 | 10,156 | 6.60% | 0 | 65,153 | 42.34% | 4 | 16,415 | 10.67% | 1 | 30,614 | 19.90% | 2 | 28,863 | 18.76% | 2 | 1,756 | 1.14% | 0 | ||||||
| 1976 | 8,037 | 5.38% | 0 | 63,017 | 42.20% | 4 | 16,807 | 11.26% | 1 | 37,407 | 25.05% | 3 | 21,392 | 14.33% | 1 | 1,818 | 1.22% | 0 | ||||||
| 1973 | 7,677 | 5.49% | 0 | 60,090 | 42.96% | 4 | 13,318 | 9.52% | 1 | 37,581 | 26.87% | 2 | 18,037 | 12.90% | 1 | 2,257 | 1.61% | 0 | ||||||
| 1970 | 4,726 | 3.60% | 0 | 60,182 | 45.84% | 4 | 19,319 | 14.72% | 1 | 29,501 | 22.47% | 2 | 14,120 | 10.76% | 1 | 2,554 | 1.95% | 0 | ||||||
(Excludes leveling seats)
Detailed[]
2018[]
Results of the 2018 general election held on 9 September 2018:[3][4]
| Party | Votes per municipality | Total Votes | % | Seats | ||||||||||
|---|---|---|---|---|---|---|---|---|---|---|---|---|---|---|
| Älvkar -leby |
Enkö -ping |
Håbo | Heby | Kniv -sta |
Östham -mar |
Tierp | Upp -sala |
Con. | Lev. | Tot. | ||||
| Swedish Social Democratic Party | 2,360 | 7,422 | 2,831 | 2,641 | 2,349 | 4,579 | 4,676 | 38,310 | 65,168 | 26.99% | 3 | 1 | 4 | |
| Moderate Party | 700 | 6,523 | 3,558 | 1,249 | 2,628 | 2,580 | 1,903 | 26,649 | 45,790 | 18.96% | 2 | 0 | 2 | |
| Sweden Democrats | 1,607 | 5,791 | 3,237 | 2,074 | 1,908 | 3,128 | 2,890 | 16,662 | 37,297 | 15.44% | 2 | 0 | 2 | |
| Centre Party | 265 | 2,843 | 951 | 1,196 | 1,207 | 1,306 | 1,565 | 12,913 | 22,246 | 9.21% | 1 | 0 | 1 | |
| Left Party | 410 | 1,343 | 696 | 502 | 611 | 749 | 912 | 15,879 | 21,102 | 8.74% | 1 | 0 | 1 | |
| Christian Democrats | 257 | 1,869 | 872 | 726 | 964 | 1,250 | 747 | 9,976 | 16,661 | 6.90% | 1 | 0 | 1 | |
| Liberals | 206 | 1,304 | 717 | 270 | 816 | 604 | 430 | 10,724 | 15,071 | 6.24% | 1 | 0 | 1 | |
| Green Party | 133 | 885 | 375 | 213 | 613 | 378 | 376 | 10,431 | 13,404 | 5.55% | 0 | 1 | 1 | |
| Feminist Initiative | 15 | 107 | 23 | 54 | 58 | 44 | 59 | 1,096 | 1,456 | 0.60% | 0 | 0 | 0 | |
| Alternative for Sweden | 20 | 110 | 34 | 40 | 37 | 51 | 65 | 502 | 859 | 0.36% | 0 | 0 | 0 | |
| Independent Rural Party | 4 | 64 | 4 | 41 | 7 | 72 | 90 | 339 | 621 | 0.26% | 0 | 0 | 0 | |
| Citizens' Coalition | 2 | 59 | 22 | 16 | 29 | 14 | 21 | 389 | 552 | 0.23% | 0 | 0 | 0 | |
| Pirate Party | 3 | 44 | 9 | 12 | 15 | 11 | 14 | 183 | 291 | 0.12% | 0 | 0 | 0 | |
| Direct Democrats | 9 | 30 | 11 | 8 | 8 | 16 | 14 | 149 | 245 | 0.10% | 0 | 0 | 0 | |
| Unity | 6 | 29 | 25 | 11 | 6 | 14 | 18 | 86 | 195 | 0.08% | 0 | 0 | 0 | |
| Christian Values Party | 2 | 9 | 5 | 3 | 5 | 6 | 6 | 101 | 137 | 0.06% | 0 | 0 | 0 | |
| Nordic Resistance Movement | 6 | 11 | 13 | 2 | 4 | 2 | 6 | 43 | 87 | 0.04% | 0 | 0 | 0 | |
| Classical Liberal Party | 1 | 4 | 2 | 0 | 4 | 1 | 2 | 67 | 81 | 0.03% | 0 | 0 | 0 | |
| Communist Party of Sweden | 0 | 7 | 0 | 0 | 0 | 1 | 0 | 69 | 77 | 0.03% | 0 | 0 | 0 | |
| Animal Party | 3 | 3 | 4 | 5 | 5 | 4 | 5 | 45 | 74 | 0.03% | 0 | 0 | 0 | |
| Initiative | 0 | 3 | 0 | 1 | 0 | 1 | 0 | 15 | 20 | 0.01% | 0 | 0 | 0 | |
| Basic Income Party | 0 | 0 | 3 | 0 | 0 | 0 | 1 | 14 | 18 | 0.01% | 0 | 0 | 0 | |
| Freedom of the Justice Party | 0 | 0 | 1 | 0 | 0 | 0 | 0 | 2 | 3 | 0.00% | 0 | 0 | 0 | |
| European Workers Party | 0 | 0 | 0 | 0 | 1 | 0 | 0 | 1 | 2 | 0.00% | 0 | 0 | 0 | |
| Security Party | 0 | 0 | 0 | 0 | 0 | 0 | 0 | 1 | 1 | 0.00% | 0 | 0 | 0 | |
| Parties not on the ballot | 0 | 2 | 2 | 0 | 1 | 3 | 2 | 21 | 31 | 0.01% | 0 | 0 | 0 | |
| Valid Votes | 6,009 | 28,462 | 13,395 | 9,064 | 11,276 | 14,814 | 13,802 | 144,667 | 241,489 | 100.00% | 11 | 2 | 13 | |
| Invalid votes – unregistered parties | 0 | 9 | 2 | 3 | 4 | 4 | 7 | 43 | 72 | 0.03% | ||||
| Blank votes | 73 | 225 | 124 | 127 | 70 | 147 | 139 | 882 | 1,787 | 0.73% | ||||
| Invalid votes – other | 5 | 19 | 9 | 4 | 3 | 4 | 3 | 49 | 96 | 0.04% | ||||
| Total Polled | 6,087 | 28,715 | 13,530 | 9,198 | 11,353 | 14,969 | 13,951 | 145,641 | 243,444 | 88.88% | ||||
| Registered Electors | 6,955 | 32,735 | 15,185 | 10,607 | 12,429 | 17,275 | 15,945 | 162,767 | 273,898 | |||||
| Turnout | 87.52% | 87.72% | 89.10% | 86.72% | 91.34% | 86.65% | 87.49% | 89.48% | 88.88% | |||||
The following candidates were elected:[5] Paula Bieler (SD), 390 votes; Marlene Burwick (S), 1,466 votes; Maria Gardfjell (MP), 924 votes; (S), 864 votes; Pyry Niemi (S), 472 votes; Lina Nordquist (L), 1,023 votes; Marta Obminska (M), 1,582 votes; Mikael Oscarsson (KD), 1,486 votes; Jessika Roswall (M), 1,264 votes; Michael Rubbestad (SD), 65 votes; Ardalan Shekarabi (S), 3,104 votes; (V), 1,255 votes; and Solveig Zander (C), 942 votes.
2014[]
Results of the 2014 general election held on 14 September 2014:[6][7]
| Party | Votes per municipality | Total Votes | % | Seats | ||||||||||
|---|---|---|---|---|---|---|---|---|---|---|---|---|---|---|
| Älvkar -leby |
Enkö -ping |
Håbo | Heby | Kniv -sta |
Östham -mar |
Tierp | Upp -sala |
Con. | Lev. | Tot. | ||||
| Swedish Social Democratic Party | 2,840 | 8,067 | 3,247 | 3,132 | 2,111 | 5,478 | 5,669 | 35,382 | 65,926 | 28.87% | 3 | 0 | 3 | |
| Moderate Party | 774 | 7,068 | 4,262 | 1,443 | 2,977 | 3,017 | 2,010 | 30,520 | 52,071 | 22.80% | 3 | 0 | 3 | |
| Sweden Democrats | 1,198 | 3,607 | 1,874 | 1,454 | 1,048 | 1,894 | 1,898 | 11,118 | 24,091 | 10.55% | 1 | 0 | 1 | |
| Green Party | 229 | 1,462 | 707 | 315 | 774 | 527 | 553 | 14,513 | 19,080 | 8.36% | 1 | 0 | 1 | |
| Centre Party | 187 | 2,380 | 613 | 1,156 | 777 | 1,285 | 1,294 | 8,135 | 15,827 | 6.93% | 1 | 0 | 1 | |
| Left Party | 375 | 985 | 423 | 408 | 383 | 611 | 680 | 10,498 | 14,363 | 6.29% | 1 | 0 | 1 | |
| Liberal People's Party | 171 | 1,329 | 613 | 237 | 630 | 601 | 380 | 10,180 | 14,141 | 6.19% | 1 | 0 | 1 | |
| Christian Democrats | 132 | 1,071 | 537 | 427 | 653 | 458 | 390 | 7,108 | 10,776 | 4.72% | 0 | 1 | 1 | |
| Feminist Initiative | 85 | 464 | 197 | 162 | 254 | 278 | 259 | 7,618 | 9,317 | 4.08% | 0 | 0 | 0 | |
| Pirate Party | 31 | 149 | 62 | 47 | 51 | 43 | 72 | 859 | 1,314 | 0.58% | 0 | 0 | 0 | |
| Independent Rural Party | 0 | 22 | 0 | 15 | 12 | 103 | 43 | 314 | 509 | 0.22% | 0 | 0 | 0 | |
| Unity | 3 | 23 | 43 | 13 | 18 | 11 | 15 | 125 | 251 | 0.11% | 0 | 0 | 0 | |
| Party of the Swedes | 6 | 24 | 18 | 5 | 7 | 4 | 15 | 91 | 170 | 0.07% | 0 | 0 | 0 | |
| Animal Party | 2 | 8 | 8 | 6 | 5 | 5 | 11 | 98 | 143 | 0.06% | 0 | 0 | 0 | |
| Christian Values Party | 0 | 8 | 5 | 1 | 6 | 10 | 5 | 95 | 130 | 0.06% | 0 | 0 | 0 | |
| Classical Liberal Party | 1 | 8 | 0 | 0 | 2 | 1 | 3 | 46 | 61 | 0.03% | 0 | 0 | 0 | |
| Direct Democrats | 0 | 5 | 1 | 1 | 0 | 11 | 4 | 33 | 55 | 0.02% | 0 | 0 | 0 | |
| Health Party | 0 | 0 | 2 | 0 | 2 | 0 | 0 | 3 | 7 | 0.00% | 0 | 0 | 0 | |
| Communist Party of Sweden | 0 | 1 | 0 | 0 | 0 | 0 | 0 | 4 | 5 | 0.00% | 0 | 0 | 0 | |
| European Workers Party | 0 | 0 | 0 | 0 | 1 | 0 | 0 | 2 | 3 | 0.00% | 0 | 0 | 0 | |
| Socialist Justice Party | 0 | 2 | 0 | 0 | 0 | 0 | 0 | 1 | 3 | 0.00% | 0 | 0 | 0 | |
| Swedish Senior Citizen Interest Party | 1 | 0 | 0 | 0 | 0 | 0 | 0 | 2 | 3 | 0.00% | 0 | 0 | 0 | |
| Human Democrats | 0 | 0 | 0 | 0 | 0 | 0 | 0 | 2 | 2 | 0.00% | 0 | 0 | 0 | |
| Freedom of the Justice Party | 0 | 0 | 0 | 0 | 0 | 0 | 0 | 1 | 1 | 0.00% | 0 | 0 | 0 | |
| Peace Democrats | 0 | 0 | 0 | 0 | 0 | 0 | 0 | 1 | 1 | 0.00% | 0 | 0 | 0 | |
| Progressive Party | 0 | 0 | 0 | 0 | 0 | 0 | 0 | 1 | 1 | 0.00% | 0 | 0 | 0 | |
| Parties not on the ballot | 1 | 15 | 4 | 2 | 5 | 6 | 7 | 60 | 100 | 0.04% | 0 | 0 | 0 | |
| Valid Votes | 6,036 | 26,698 | 12,616 | 8,824 | 9,716 | 14,343 | 13,308 | 136,810 | 228,351 | 100.00% | 11 | 1 | 12 | |
| Blank votes | 58 | 307 | 136 | 141 | 109 | 173 | 166 | 927 | 2,017 | 0.88% | ||||
| Invalid votes | 2 | 12 | 6 | 3 | 4 | 9 | 3 | 33 | 72 | 0.03% | ||||
| Total Polled | 6,096 | 27,017 | 12,758 | 8,968 | 9,829 | 14,525 | 13,477 | 137,770 | 230,440 | 87.39% | ||||
| Registered Electors | 7,035 | 31,416 | 14,561 | 10,545 | 11,041 | 17,053 | 15,750 | 156,279 | 263,680 | |||||
| Turnout | 86.65% | 86.00% | 87.62% | 85.05% | 89.02% | 85.18% | 85.57% | 88.16% | 87.39% | |||||
The following candidates were elected:[8] Per Bill (M), 1,016 votes; Josef Fransson (SD), 14 votes; Agneta Gille (S), 2,476 votes; Ulrika Karlsson (M), 2,182 votes; Niclas Malmberg (MP), 586 votes; Pyry Niemi (S), 643 votes; Mikael Oscarsson (KD), 1,756 votes; Ardalan Shekarabi (S), 2,936 votes; Jessika Vilhelmsson (M), 1,459 votes; (V), 1,060 votes; (FP), 1,123 votes; and Solveig Zander (C), 1,024 votes.
2010[]
Results of the 2010 general election held on 19 September 2010:[9][10]
| Party | Votes per municipality | Total Votes | % | Seats | ||||||||||
|---|---|---|---|---|---|---|---|---|---|---|---|---|---|---|
| Älvkar -leby |
Enkö -ping |
Håbo | Heby | Kniv -sta |
Östham -mar |
Tierp | Upp -sala |
Con. | Lev. | Tot. | ||||
| Moderate Party | 1,136 | 8,755 | 5,097 | 1,979 | 3,435 | 3,888 | 2,658 | 37,802 | 64,750 | 30.11% | 4 | 0 | 4 | |
| Swedish Social Democratic Party | 2,875 | 7,325 | 2,983 | 2,818 | 1,720 | 4,861 | 5,536 | 30,744 | 58,862 | 27.37% | 3 | 0 | 3 | |
| Green Party | 304 | 1,511 | 653 | 354 | 664 | 610 | 606 | 14,291 | 18,993 | 8.83% | 1 | 0 | 1 | |
| Centre Party | 189 | 2,527 | 601 | 1,197 | 830 | 1,469 | 1,344 | 9,681 | 17,838 | 8.30% | 1 | 0 | 1 | |
| Liberal People's Party | 296 | 1,330 | 860 | 429 | 856 | 803 | 588 | 11,716 | 16,878 | 7.85% | 1 | 0 | 1 | |
| Christian Democrats | 149 | 1,164 | 564 | 460 | 636 | 573 | 471 | 8,248 | 12,265 | 5.70% | 1 | 0 | 1 | |
| Left Party | 401 | 896 | 368 | 402 | 311 | 619 | 690 | 8,158 | 11,845 | 5.51% | 0 | 1 | 1 | |
| Sweden Democrats | 466 | 1,370 | 701 | 578 | 399 | 763 | 810 | 4,916 | 10,003 | 4.65% | 0 | 1 | 1 | |
| Pirate Party | 38 | 184 | 101 | 58 | 85 | 80 | 85 | 1,239 | 1,870 | 0.87% | 0 | 0 | 0 | |
| Feminist Initiative | 12 | 65 | 25 | 34 | 42 | 31 | 34 | 1,077 | 1,320 | 0.61% | 0 | 0 | 0 | |
| Rural Democrats | 3 | 1 | 0 | 10 | 0 | 61 | 77 | 37 | 189 | 0.09% | 0 | 0 | 0 | |
| Classical Liberal Party | 0 | 2 | 0 | 0 | 1 | 1 | 1 | 26 | 31 | 0.01% | 0 | 0 | 0 | |
| Freedom Party | 0 | 5 | 3 | 0 | 0 | 0 | 1 | 21 | 30 | 0.01% | 0 | 0 | 0 | |
| National Democrats | 0 | 6 | 0 | 0 | 0 | 1 | 2 | 11 | 20 | 0.01% | 0 | 0 | 0 | |
| Party of the Swedes | 0 | 2 | 1 | 0 | 1 | 1 | 1 | 8 | 14 | 0.01% | 0 | 0 | 0 | |
| Unity | 0 | 5 | 0 | 0 | 0 | 2 | 1 | 6 | 14 | 0.01% | 0 | 0 | 0 | |
| Swedish Senior Citizen Interest Party | 2 | 0 | 0 | 1 | 0 | 2 | 0 | 8 | 13 | 0.01% | 0 | 0 | 0 | |
| Communist Party of Sweden | 0 | 1 | 0 | 0 | 0 | 1 | 0 | 9 | 11 | 0.01% | 0 | 0 | 0 | |
| Socialist Justice Party | 0 | 3 | 0 | 0 | 0 | 0 | 0 | 8 | 11 | 0.01% | 0 | 0 | 0 | |
| Health Care Party | 0 | 0 | 0 | 0 | 0 | 0 | 0 | 8 | 8 | 0.00% | 0 | 0 | 0 | |
| Spirits Party | 0 | 1 | 1 | 0 | 1 | 1 | 0 | 2 | 6 | 0.00% | 0 | 0 | 0 | |
| Active Democracy | 0 | 0 | 0 | 0 | 0 | 0 | 0 | 4 | 4 | 0.00% | 0 | 0 | 0 | |
| European Workers Party | 0 | 0 | 0 | 0 | 0 | 0 | 0 | 4 | 4 | 0.00% | 0 | 0 | 0 | |
| Norrländska Coalition | 1 | 1 | 0 | 0 | 0 | 0 | 0 | 2 | 4 | 0.00% | 0 | 0 | 0 | |
| Alliance Party / Citizen's Voice | 0 | 0 | 0 | 0 | 0 | 0 | 0 | 1 | 1 | 0.00% | 0 | 0 | 0 | |
| Parties not on the ballot | 2 | 7 | 1 | 2 | 0 | 0 | 2 | 32 | 46 | 0.02% | 0 | 0 | 0 | |
| Valid Votes | 5,874 | 25,161 | 11,959 | 8,322 | 8,981 | 13,767 | 12,907 | 128,059 | 215,030 | 100.00% | 11 | 2 | 13 | |
| Blank votes | 84 | 357 | 146 | 155 | 76 | 204 | 183 | 1,276 | 2,481 | 1.14% | ||||
| Invalid votes | 2 | 9 | 7 | 3 | 2 | 7 | 24 | 30 | 84 | 0.04% | ||||
| Total Polled | 5,960 | 25,527 | 12,112 | 8,480 | 9,059 | 13,978 | 13,114 | 129,365 | 217,595 | 85.75% | ||||
| Registered Electors | 7,030 | 30,281 | 14,062 | 10,385 | 10,256 | 16,819 | 15,616 | 149,316 | 253,765 | |||||
| Turnout | 84.78% | 84.30% | 86.13% | 81.66% | 88.33% | 83.11% | 83.98% | 86.64% | 85.75% | |||||
The following candidates were elected:[11] Per Bill (M), 1,463 votes; Agneta Gille (S), 1,435 votes; Lars Isovaara (SD), 6 votes; (V), 630 votes; (FP), 760 votes; Ulrika Karlsson (M), 3,676 votes; Helena Leander (MP), 1,230 votes; Pyry Niemi (S), 596 votes; Marta Obminska (M), 477 votes; Mikael Oscarsson (KD), 2,009 votes; Thomas Östros (S), 5,218 votes; Jessika Vilhelmsson (M), 1,970 votes; and Solveig Zander (C), 1,344 votes.
2006[]
Results of the 2006 general election held on 17 September 2006:[12][13]
| Party | Votes per municipality | Total Votes | % | Seats | ||||||||||
|---|---|---|---|---|---|---|---|---|---|---|---|---|---|---|
| Älvkar -leby |
Enkö -ping |
Håbo | Heby | Kniv -sta |
Östham -mar |
Tierp | Upp -sala |
Con. | Lev. | Tot. | ||||
| Swedish Social Democratic Party | 3,022 | 7,866 | 3,091 | 2,946 | 1,923 | 5,094 | 5,495 | 31,237 | 60,674 | 30.89% | 4 | 0 | 4 | |
| Moderate Party | 813 | 6,688 | 4,254 | 1,520 | 2,688 | 3,037 | 1,764 | 31,252 | 52,016 | 26.49% | 3 | 0 | 3 | |
| Centre Party | 254 | 2,874 | 639 | 1,360 | 796 | 1,693 | 1,722 | 10,002 | 19,340 | 9.85% | 1 | 0 | 1 | |
| Liberal People's Party | 276 | 1,202 | 735 | 404 | 786 | 781 | 666 | 13,079 | 17,929 | 9.13% | 1 | 0 | 1 | |
| Christian Democrats | 206 | 1,363 | 677 | 573 | 629 | 707 | 656 | 8,165 | 12,976 | 6.61% | 1 | 0 | 1 | |
| Green Party | 192 | 1,007 | 424 | 251 | 437 | 473 | 431 | 9,097 | 12,312 | 6.27% | 1 | 0 | 1 | |
| Left Party | 423 | 874 | 385 | 474 | 283 | 568 | 656 | 7,577 | 11,240 | 5.72% | 0 | 1 | 1 | |
| Sweden Democrats | 209 | 517 | 252 | 305 | 202 | 302 | 377 | 2,319 | 4,483 | 2.28% | 0 | 0 | 0 | |
| Feminist Initiative | 31 | 91 | 52 | 37 | 48 | 57 | 58 | 1,416 | 1,790 | 0.91% | 0 | 0 | 0 | |
| Pirate Party | 47 | 142 | 100 | 45 | 59 | 63 | 59 | 1,060 | 1,575 | 0.80% | 0 | 0 | 0 | |
| June List | 50 | 105 | 62 | 75 | 35 | 86 | 79 | 421 | 913 | 0.46% | 0 | 0 | 0 | |
| Swedish Senior Citizen Interest Party | 5 | 171 | 12 | 15 | 12 | 12 | 6 | 164 | 397 | 0.20% | 0 | 0 | 0 | |
| Health Care Party | 24 | 57 | 1 | 14 | 6 | 26 | 18 | 247 | 393 | 0.20% | 0 | 0 | 0 | |
| National Democrats | 1 | 38 | 47 | 1 | 6 | 5 | 2 | 40 | 140 | 0.07% | 0 | 0 | 0 | |
| Unity | 4 | 5 | 8 | 0 | 3 | 6 | 6 | 30 | 62 | 0.03% | 0 | 0 | 0 | |
| New Future | 0 | 1 | 0 | 0 | 0 | 1 | 5 | 20 | 27 | 0.01% | 0 | 0 | 0 | |
| National Socialist Front | 0 | 4 | 0 | 1 | 0 | 0 | 2 | 15 | 22 | 0.01% | 0 | 0 | 0 | |
| Freedom of the Justice Party | 0 | 0 | 1 | 0 | 0 | 0 | 0 | 9 | 10 | 0.01% | 0 | 0 | 0 | |
| People's Will | 0 | 2 | 1 | 0 | 0 | 0 | 0 | 6 | 9 | 0.00% | 0 | 0 | 0 | |
| The Communists | 0 | 0 | 0 | 0 | 0 | 0 | 1 | 5 | 6 | 0.00% | 0 | 0 | 0 | |
| Classical Liberal Party | 0 | 2 | 0 | 0 | 0 | 1 | 0 | 2 | 5 | 0.00% | 0 | 0 | 0 | |
| Socialist Justice Party | 0 | 3 | 0 | 0 | 0 | 0 | 0 | 2 | 5 | 0.00% | 0 | 0 | 0 | |
| European Workers Party | 0 | 0 | 0 | 1 | 0 | 0 | 0 | 3 | 4 | 0.00% | 0 | 0 | 0 | |
| Kvinnokraft | 0 | 0 | 0 | 0 | 0 | 0 | 0 | 2 | 2 | 0.00% | 0 | 0 | 0 | |
| Partiet.se | 0 | 0 | 0 | 0 | 0 | 0 | 1 | 1 | 2 | 0.00% | 0 | 0 | 0 | |
| Active Democracy | 0 | 0 | 0 | 0 | 0 | 0 | 0 | 1 | 1 | 0.00% | 0 | 0 | 0 | |
| Unique Party | 0 | 1 | 0 | 0 | 0 | 0 | 0 | 0 | 1 | 0.00% | 0 | 0 | 0 | |
| Other parties | 1 | 7 | 5 | 1 | 2 | 2 | 2 | 35 | 55 | 0.03% | 0 | 0 | 0 | |
| Valid Votes | 5,558 | 23,020 | 10,746 | 8,023 | 7,915 | 12,914 | 12,006 | 116,207 | 196,389 | 100.00% | 11 | 1 | 12 | |
| Blank votes | 118 | 534 | 161 | 210 | 127 | 294 | 249 | 1,798 | 3,491 | 1.75% | ||||
| Invalid votes | 4 | 17 | 25 | 1 | 1 | 3 | 1 | 31 | 83 | 0.04% | ||||
| Total Polled | 5,680 | 23,571 | 10,932 | 8,234 | 8,043 | 13,211 | 12,256 | 118,036 | 199,963 | 82.87% | ||||
| Registered Electors | 6,888 | 29,043 | 13,088 | 10,342 | 9,361 | 16,630 | 15,358 | 140,588 | 241,298 | |||||
| Turnout | 82.46% | 81.16% | 83.53% | 79.62% | 85.92% | 79.44% | 79.80% | 83.96% | 82.87% | |||||
The following candidates were elected:[14] (S), 391 votes; Per Bill (M), 2,252 votes; Agneta Gille (S), 834 votes; Lennart Hedquist (M), 1,254 votes; (V), 338 votes; Ulrika Karlsson (M), 1,254 votes; Helena Leander (MP), 618 votes; Mikael Oscarsson (KD), 1,777 votes; Thomas Östros (S), 3,130 votes; Tone Tingsgård (S), 176 votes; Cecilia Wikström (FP), 2,013 votes; and Solveig Zander (C), 1,294 votes.
2002[]
Results of the 2002 general election held on 15 September 2002:[15][16]
| Party | Votes per municipality | Total Votes | % | Seats | |||||||||
|---|---|---|---|---|---|---|---|---|---|---|---|---|---|
| Älvkar -leby |
Enkö -ping |
Håbo | Kniv -sta |
Östham -mar |
Tierp | Upp -sala |
Con. | Lev. | Tot. | ||||
| Swedish Social Democratic Party | 3,255 | 8,686 | 3,585 | 2,279 | 5,799 | 6,061 | 36,370 | 66,035 | 37.43% | 4 | 0 | 4 | |
| Liberal People's Party | 434 | 2,345 | 1,365 | 1,281 | 1,097 | 962 | 20,110 | 27,594 | 15.64% | 2 | 0 | 2 | |
| Moderate Party | 359 | 3,550 | 2,287 | 1,436 | 1,633 | 981 | 16,236 | 26,482 | 15.01% | 2 | 0 | 2 | |
| Christian Democrats | 257 | 2,088 | 1,068 | 755 | 1,002 | 914 | 9,562 | 15,646 | 8.87% | 1 | 0 | 1 | |
| Left Party | 534 | 1,167 | 493 | 391 | 823 | 878 | 10,086 | 14,372 | 8.15% | 1 | 0 | 1 | |
| Centre Party | 168 | 2,479 | 396 | 485 | 1,534 | 1,490 | 5,450 | 12,002 | 6.80% | 0 | 1 | 1 | |
| Green Party | 184 | 766 | 374 | 361 | 496 | 442 | 7,439 | 10,062 | 5.70% | 0 | 1 | 1 | |
| Sweden Democrats | 120 | 169 | 98 | 117 | 150 | 175 | 1,594 | 2,423 | 1.37% | 0 | 0 | 0 | |
| Swedish Senior Citizen Interest Party | 3 | 387 | 62 | 16 | 37 | 18 | 574 | 1,097 | 0.62% | 0 | 0 | 0 | |
| New Future | 0 | 21 | 7 | 10 | 7 | 11 | 82 | 138 | 0.08% | 0 | 0 | 0 | |
| New Democracy | 1 | 16 | 5 | 7 | 14 | 1 | 62 | 106 | 0.06% | 0 | 0 | 0 | |
| Socialist Party | 0 | 0 | 0 | 0 | 0 | 1 | 67 | 68 | 0.04% | 0 | 0 | 0 | |
| Unity | 0 | 1 | 0 | 4 | 1 | 0 | 6 | 12 | 0.01% | 0 | 0 | 0 | |
| The Communists | 0 | 1 | 1 | 0 | 1 | 0 | 8 | 11 | 0.01% | 0 | 0 | 0 | |
| European Workers Party | 0 | 0 | 2 | 0 | 0 | 0 | 5 | 7 | 0.00% | 0 | 0 | 0 | |
| Socialist Justice Party | 0 | 0 | 0 | 0 | 0 | 0 | 2 | 2 | 0.00% | 0 | 0 | 0 | |
| Other parties | 2 | 40 | 59 | 20 | 22 | 13 | 189 | 345 | 0.20% | 0 | 0 | 0 | |
| Valid Votes | 5,317 | 21,716 | 9,802 | 7,162 | 12,616 | 11,947 | 107,842 | 176,402 | 100.00% | 10 | 2 | 12 | |
| Invalid votes | 74 | 423 | 198 | 113 | 230 | 198 | 1,714 | 2,950 | 1.64% | ||||
| Total Polled | 5,391 | 22,139 | 10,000 | 7,275 | 12,846 | 12,145 | 109,556 | 179,352 | 80.85% | ||||
| Registered Electors | 6,779 | 27,955 | 12,357 | 8,772 | 16,420 | 15,394 | 134,154 | 221,831 | |||||
| Turnout | 79.53% | 79.20% | 80.93% | 82.93% | 78.23% | 78.89% | 81.66% | 80.85% | |||||
The following candidates were elected:[17] (S), 593 votes; Per Bill (M), 1,930 votes; Ingrid Burman (V), 710 votes; Åsa Domeij (MP), 1,471 votes; Agneta Gille (S), 876 votes; Lennart Hedquist (M), 659 votes; Mikael Oscarsson (KD), 1,710 votes; Thomas Östros (S), 4,798 votes; Rigmor Stenmark (C), 1,008 votes; Tone Tingsgård (S), 401 votes; Erik Ullenhag (FP), 2,137 votes; and Cecilia Wikström (FP), 1,657 votes.
1998[]
Results of the 1998 general election held on 20 September 1998:[18][19]
| Party | Votes per municipality | Total Votes | % | Seats | ||||||||
|---|---|---|---|---|---|---|---|---|---|---|---|---|
| Älvkar -leby |
Enkö -ping |
Håbo | Östham -mar |
Tierp | Upp -sala |
Con. | Lev. | Tot. | ||||
| Swedish Social Democratic Party | 3,104 | 7,758 | 3,217 | 5,371 | 5,857 | 33,196 | 58,503 | 34.39% | 4 | 0 | 4 | |
| Moderate Party | 568 | 5,420 | 3,242 | 2,325 | 1,498 | 27,493 | 40,546 | 23.84% | 3 | 0 | 3 | |
| Left Party | 917 | 1,720 | 714 | 1,329 | 1,267 | 12,673 | 18,620 | 10.95% | 1 | 0 | 1 | |
| Christian Democrats | 307 | 2,501 | 1,104 | 1,115 | 1,123 | 11,985 | 18,135 | 10.66% | 1 | 0 | 1 | |
| Liberal People's Party | 181 | 691 | 347 | 414 | 369 | 8,614 | 10,616 | 6.24% | 1 | 0 | 1 | |
| Centre Party | 118 | 2,064 | 304 | 1,244 | 1,310 | 4,815 | 9,855 | 5.79% | 0 | 1 | 1 | |
| Green Party | 179 | 908 | 370 | 524 | 473 | 7,204 | 9,658 | 5.68% | 0 | 1 | 1 | |
| Other parties | 86 | 258 | 205 | 319 | 199 | 3,096 | 4,163 | 2.45% | 0 | 0 | 0 | |
| Valid Votes | 5,460 | 21,320 | 9,503 | 12,641 | 12,096 | 109,076 | 170,096 | 100.00% | 10 | 2 | 12 | |
| Invalid votes | 113 | 564 | 216 | 374 | 300 | 2,675 | 4,242 | 2.43% | ||||
| Total Polled | 5,573 | 21,884 | 9,719 | 13,015 | 12,396 | 111,751 | 174,338 | 81.87% | ||||
| Registered Electors | 6,820 | 26,826 | 11,944 | 16,259 | 15,251 | 135,843 | 212,943 | |||||
| Turnout | 81.72% | 81.58% | 81.37% | 80.05% | 81.28% | 82.26% | 81.87% | |||||
The following candidates were elected:[20] (C), 1,472 votes; (S), 691 votes; (S), 567 votes; Per Bill (M), 3,581 votes; Ingrid Burman (V), 1,269 votes; Birgitta Dahl (S), 5,945 votes; (MP), 537 votes; Lennart Hedquist (M), 1,076 votes; (FP), 1,178 votes; Mikael Oscarsson (KD), 1,509 votes; Thomas Östros (S), 2,121 votes; and (M), 1,707 votes.
1994[]
Results of the 1994 general election held on 18 September 1994:[21][22]
| Party | Votes per municipality | Total Votes | % | Seats | ||||||||
|---|---|---|---|---|---|---|---|---|---|---|---|---|
| Älvkar -leby |
Enkö -ping |
Håbo | Östham -mar |
Tierp | Upp -sala |
Con. | Lev. | Tot. | ||||
| Swedish Social Democratic Party | 4,373 | 9,870 | 3,915 | 6,944 | 7,605 | 42,913 | 75,620 | 42.85% | 5 | 0 | 5 | |
| Moderate Party | 536 | 5,037 | 3,346 | 2,405 | 1,531 | 26,624 | 39,479 | 22.37% | 3 | 0 | 3 | |
| Liberal People's Party | 291 | 1,330 | 657 | 659 | 702 | 12,164 | 15,803 | 8.95% | 1 | 0 | 1 | |
| Centre Party | 172 | 2,765 | 458 | 1,746 | 1,768 | 6,986 | 13,895 | 7.87% | 1 | 0 | 1 | |
| Green Party | 186 | 1,051 | 398 | 728 | 491 | 7,962 | 10,816 | 6.13% | 0 | 1 | 1 | |
| Left Party | 377 | 868 | 436 | 637 | 587 | 7,428 | 10,333 | 5.85% | 0 | 1 | 1 | |
| Christian Democratic Unity | 72 | 719 | 278 | 281 | 381 | 5,012 | 6,743 | 3.82% | 0 | 0 | 0 | |
| New Democracy | 57 | 339 | 175 | 206 | 143 | 1,230 | 2,150 | 1.22% | 0 | 0 | 0 | |
| Other parties | 44 | 137 | 138 | 116 | 101 | 1,119 | 1,655 | 0.94% | 0 | 0 | 0 | |
| Valid Votes | 6,108 | 22,116 | 9,801 | 13,722 | 13,309 | 111,438 | 176,494 | 100.00% | 10 | 2 | 12 | |
| Invalid votes | 60 | 403 | 218 | 242 | 182 | 1,750 | 2,855 | 1.59% | ||||
| Total Polled | 6,168 | 22,519 | 10,019 | 13,964 | 13,491 | 113,188 | 179,349 | 87.38% | ||||
| Registered Electors | 6,951 | 26,686 | 11,418 | 16,329 | 15,342 | 128,524 | 205,250 | |||||
| Turnout | 88.74% | 84.39% | 87.75% | 85.52% | 87.94% | 88.07% | 87.38% | |||||
1991[]
Results of the 1991 general election held on 15 September 1991:[23][24]
| Party | Votes per municipality | Total Votes | % | Seats | ||||||||
|---|---|---|---|---|---|---|---|---|---|---|---|---|
| Älvkar -leby |
Enkö -ping |
Håbo | Östham -mar |
Tierp | Upp -sala |
Con. | Lev. | Tot. | ||||
| Swedish Social Democratic Party | 3,841 | 8,001 | 2,741 | 5,628 | 6,690 | 32,080 | 58,981 | 35.26% | 4 | 0 | 4 | |
| Moderate Party | 511 | 4,955 | 3,076 | 2,266 | 1,419 | 24,651 | 36,878 | 22.05% | 2 | 0 | 2 | |
| Liberal People's Party | 412 | 1,846 | 816 | 1,010 | 917 | 13,770 | 18,771 | 11.22% | 1 | 0 | 1 | |
| Centre Party | 246 | 2,982 | 457 | 2,012 | 2,029 | 7,381 | 15,107 | 9.03% | 1 | 0 | 1 | |
| New Democracy | 393 | 1,588 | 997 | 1,050 | 834 | 7,634 | 12,496 | 7.47% | 1 | 0 | 1 | |
| Christian Democratic Unity | 181 | 1,330 | 399 | 593 | 683 | 6,447 | 9,633 | 5.76% | 0 | 1 | 1 | |
| Left Party | 306 | 587 | 274 | 445 | 383 | 5,565 | 7,560 | 4.52% | 0 | 1 | 1 | |
| Green Party | 109 | 608 | 186 | 363 | 292 | 5,699 | 7,257 | 4.34% | 0 | 0 | 0 | |
| Other parties | 44 | 51 | 25 | 65 | 37 | 378 | 600 | 0.36% | 0 | 0 | 0 | |
| Valid Votes | 6,043 | 21,948 | 8,971 | 13,432 | 13,284 | 103,605 | 167,283 | 100.00% | 9 | 2 | 11 | |
| Invalid votes | 82 | 485 | 160 | 258 | 204 | 1,895 | 3,084 | 1.81% | ||||
| Total Polled | 6,125 | 22,433 | 9,131 | 13,690 | 13,488 | 105,500 | 170,367 | 86.95% | ||||
| Registered Electors | 6,949 | 26,144 | 10,359 | 16,012 | 15,446 | 121,018 | 195,928 | |||||
| Turnout | 88.14% | 85.81% | 88.15% | 85.50% | 87.32% | 87.18% | 86.95% | |||||
1988[]
Results of the 1988 general election held on 18 September 1988:[25][26]
| Party | Votes per municipality | Total Votes | % | Seats | ||||||||
|---|---|---|---|---|---|---|---|---|---|---|---|---|
| Älvkar -leby |
Enkö -ping |
Håbo | Östham -mar |
Tierp | Upp -sala |
Con. | Lev. | Tot. | ||||
| Swedish Social Democratic Party | 4,171 | 8,679 | 3,190 | 5,920 | 7,280 | 36,340 | 65,580 | 40.82% | 5 | 0 | 5 | |
| Moderate Party | 386 | 3,682 | 2,332 | 1,717 | 1,064 | 20,335 | 29,516 | 18.37% | 2 | 0 | 2 | |
| Liberal People's Party | 510 | 2,432 | 1,121 | 1,222 | 1,153 | 15,416 | 21,854 | 13.60% | 1 | 1 | 2 | |
| Centre Party | 361 | 3,804 | 648 | 2,506 | 2,515 | 9,931 | 19,765 | 12.30% | 1 | 0 | 1 | |
| Left Party – Communists | 385 | 696 | 372 | 618 | 397 | 7,554 | 10,022 | 6.24% | 0 | 1 | 1 | |
| Green Party | 194 | 899 | 334 | 542 | 451 | 6,728 | 9,148 | 5.69% | 0 | 1 | 1 | |
| Christian Democratic Unity | 68 | 355 | 121 | 221 | 296 | 2,163 | 3,224 | 2.01% | 0 | 0 | 0 | |
| Other parties | 21 | 178 | 42 | 133 | 108 | 1,084 | 1,566 | 0.97% | 0 | 0 | 0 | |
| Valid Votes | 6,096 | 20,725 | 8,160 | 12,879 | 13,264 | 99,551 | 160,675 | 100.00% | 9 | 3 | 12 | |
| Invalid votes | 55 | 306 | 146 | 168 | 148 | 1,386 | 2,209 | 1.36% | ||||
| Total Polled | 6,151 | 21,031 | 8,306 | 13,047 | 13,412 | 100,937 | 162,884 | 86.29% | ||||
| Registered Electors | 6,957 | 24,881 | 9,557 | 15,438 | 15,288 | 116,648 | 188,769 | |||||
| Turnout | 88.41% | 84.53% | 86.91% | 84.51% | 87.73% | 86.53% | 86.29% | |||||
1985[]
Results of the 1985 general election held on 15 September 1985:[27][28]
| Party | Votes per municipality | Total Votes | % | Seats | ||||||||
|---|---|---|---|---|---|---|---|---|---|---|---|---|
| Älvkar -leby |
Enkö -ping |
Håbo | Östham -mar |
Tierp | Upp -sala |
Con. | Lev. | Tot. | ||||
| Swedish Social Democratic Party | 4,719 | 9,213 | 3,242 | 6,437 | 7,747 | 39,244 | 70,602 | 43.32% | 4 | 1 | 5 | |
| Moderate Party | 506 | 4,419 | 2,449 | 2,123 | 1,386 | 22,494 | 33,377 | 20.48% | 2 | 0 | 2 | |
| Liberal People's Party | 526 | 2,746 | 1,136 | 1,480 | 1,443 | 17,802 | 25,133 | 15.42% | 2 | 0 | 2 | |
| Centre Party | 376 | 3,990 | 627 | 2,641 | 2,703 | 10,292 | 20,629 | 12.66% | 1 | 0 | 1 | |
| Left Party – Communists | 310 | 624 | 314 | 488 | 387 | 6,947 | 9,070 | 5.57% | 0 | 1 | 1 | |
| Green Party | 64 | 293 | 82 | 214 | 118 | 2,079 | 2,850 | 1.75% | 0 | 0 | 0 | |
| Other parties | 6 | 60 | 19 | 61 | 47 | 1,125 | 1,318 | 0.81% | 0 | 0 | 0 | |
| Valid Votes | 6,507 | 21,345 | 7,869 | 13,444 | 13,831 | 99,983 | 162,979 | 100.00% | 9 | 2 | 11 | |
| Invalid votes | 31 | 236 | 66 | 135 | 126 | 956 | 1,550 | 0.94% | ||||
| Total Polled | 6,538 | 21,581 | 7,935 | 13,579 | 13,957 | 100,939 | 164,529 | 90.16% | ||||
| Registered Electors | 7,098 | 24,202 | 8,704 | 15,300 | 15,399 | 111,784 | 182,487 | |||||
| Turnout | 92.11% | 89.17% | 91.16% | 88.75% | 90.64% | 90.30% | 90.16% | |||||
1982[]
Results of the 1982 general election held on 19 September 1982:[29][30]
| Party | Votes per municipality | Total Votes | % | Seats | ||||||||
|---|---|---|---|---|---|---|---|---|---|---|---|---|
| Älvkar -leby |
Enkö -ping |
Håbo | Östham -mar |
Tierp | Upp -sala |
Con. | Lev. | Tot. | ||||
| Swedish Social Democratic Party | 4,843 | 9,408 | 3,169 | 6,496 | 7,894 | 39,558 | 71,368 | 44.58% | 5 | 0 | 5 | |
| Moderate Party | 589 | 4,763 | 2,416 | 2,159 | 1,498 | 24,268 | 35,693 | 22.30% | 2 | 0 | 2 | |
| Centre Party | 573 | 4,825 | 941 | 3,268 | 3,234 | 14,186 | 27,027 | 16.88% | 2 | 0 | 2 | |
| Liberal People's Party | 219 | 940 | 330 | 608 | 776 | 7,213 | 10,086 | 6.30% | 0 | 1 | 1 | |
| Left Party – Communists | 309 | 686 | 334 | 491 | 387 | 7,570 | 9,777 | 6.11% | 0 | 1 | 1 | |
| Green Party | 61 | 308 | 99 | 242 | 153 | 2,385 | 3,248 | 2.03% | 0 | 0 | 0 | |
| Christian Democratic Unity | 48 | 251 | 71 | 211 | 271 | 1,501 | 2,353 | 1.47% | 0 | 0 | 0 | |
| K-Party | 1 | 4 | 2 | 9 | 7 | 53 | 76 | 0.05% | 0 | 0 | 0 | |
| Other parties | 7 | 20 | 7 | 3 | 14 | 394 | 445 | 0.28% | 0 | 0 | 0 | |
| Valid Votes | 6,650 | 21,205 | 7,369 | 13,487 | 14,234 | 97,128 | 160,073 | 100.00% | 9 | 2 | 11 | |
| Invalid votes | 40 | 249 | 93 | 123 | 116 | 1,197 | 1,818 | 1.12% | ||||
| Total Polled | 6,690 | 21,454 | 7,462 | 13,610 | 14,350 | 98,325 | 161,891 | 91.71% | ||||
| Registered Electors | 7,159 | 23,663 | 7,992 | 15,064 | 15,547 | 107,104 | 176,529 | |||||
| Turnout | 93.45% | 90.66% | 93.37% | 90.35% | 92.30% | 91.80% | 91.71% | |||||
1979[]
Results of the 1979 general election held on 16 September 1979:[31][32]
| Party | Votes per municipality | Total Votes | % | Seats | ||||||||
|---|---|---|---|---|---|---|---|---|---|---|---|---|
| Älvkar -leby |
Enkö -ping |
Håbo | Östham -mar |
Tierp | Upp -sala |
Con. | Lev. | Tot. | ||||
| Swedish Social Democratic Party | 4,742 | 8,554 | 2,720 | 6,091 | 7,628 | 35,418 | 65,153 | 42.34% | 4 | 0 | 4 | |
| Centre Party | 697 | 5,401 | 1,150 | 3,552 | 3,596 | 16,218 | 30,614 | 19.90% | 2 | 0 | 2 | |
| Moderate Party | 429 | 3,794 | 1,760 | 1,708 | 1,234 | 19,938 | 28,863 | 18.76% | 2 | 0 | 2 | |
| Liberal People's Party | 436 | 1,632 | 715 | 934 | 1,202 | 11,496 | 16,415 | 10.67% | 1 | 0 | 1 | |
| Left Party – Communists | 319 | 570 | 309 | 474 | 337 | 8,147 | 10,156 | 6.60% | 0 | 1 | 1 | |
| Christian Democratic Unity | 41 | 207 | 48 | 149 | 261 | 1,050 | 1,756 | 1.14% | 0 | 0 | 0 | |
| Communist Party of Sweden | 0 | 41 | 8 | 8 | 2 | 283 | 342 | 0.22% | 0 | 0 | 0 | |
| Workers' Party – The Communists | 0 | 5 | 7 | 32 | 2 | 175 | 221 | 0.14% | 0 | 0 | 0 | |
| Other parties | 2 | 38 | 17 | 15 | 11 | 263 | 346 | 0.22% | 0 | 0 | 0 | |
| Valid Votes | 6,666 | 20,242 | 6,734 | 12,963 | 14,273 | 92,988 | 153,866 | 100.00% | 9 | 1 | 10 | |
| Invalid votes | 20 | 135 | 29 | 78 | 46 | 740 | 1,048 | 0.68% | ||||
| Total Polled | 6,686 | 20,377 | 6,763 | 13,041 | 14,319 | 93,728 | 154,914 | 90.72% | ||||
| Registered Electors | 7,200 | 22,727 | 7,284 | 14,476 | 15,529 | 103,542 | 170,758 | |||||
| Turnout | 92.86% | 89.66% | 92.85% | 90.09% | 92.21% | 90.52% | 90.72% | |||||
1976[]
Results of the 1976 general election held on 19 September 1976:[33][34]
| Party | Votes per municipality | Total Votes | % | Seats | ||||||||
|---|---|---|---|---|---|---|---|---|---|---|---|---|
| Älvkar -leby |
Enkö -ping |
Håbo | Östham -mar |
Tierp | Upp -sala |
Con. | Lev. | Tot. | ||||
| Swedish Social Democratic Party | 4,819 | 8,306 | 2,177 | 5,796 | 7,579 | 34,340 | 63,017 | 42.20% | 4 | 0 | 4 | |
| Centre Party | 880 | 6,568 | 1,404 | 3,873 | 3,908 | 20,774 | 37,407 | 25.05% | 3 | 0 | 3 | |
| Moderate Party | 325 | 2,875 | 979 | 1,294 | 1,022 | 14,897 | 21,392 | 14.33% | 1 | 0 | 1 | |
| People's Party | 391 | 1,630 | 638 | 856 | 1,244 | 12,048 | 16,807 | 11.26% | 1 | 0 | 1 | |
| Left Party – Communists | 266 | 529 | 204 | 428 | 292 | 6,318 | 8,037 | 5.38% | 0 | 1 | 1 | |
| Christian Democratic Unity | 41 | 219 | 34 | 170 | 302 | 1,052 | 1,818 | 1.22% | 0 | 0 | 0 | |
| Communist Party of Sweden | 5 | 27 | 8 | 13 | 7 | 581 | 641 | 0.43% | 0 | 0 | 0 | |
| Other parties | 0 | 6 | 0 | 0 | 1 | 199 | 206 | 0.14% | 0 | 0 | 0 | |
| Valid Votes | 6,727 | 20,160 | 5,444 | 12,430 | 14,355 | 90,209 | 149,325 | 100.00% | 9 | 1 | 10 | |
| Invalid votes | 15 | 62 | 15 | 23 | 26 | 499 | 640 | 0.43% | ||||
| Total Polled | 6,742 | 20,222 | 5,459 | 12,453 | 14,381 | 90,708 | 149,965 | 91.28% | ||||
| Registered Electors | 7,169 | 22,306 | 5,891 | 13,722 | 15,482 | 99,728 | 164,298 | |||||
| Turnout | 94.04% | 90.66% | 92.67% | 90.75% | 92.89% | 90.96% | 91.28% | |||||
1973[]
Results of the 1973 general election held on 16 September 1973:[35][36]
| Party | Votes per municipality | Total Votes | % | Seats | ||||||||
|---|---|---|---|---|---|---|---|---|---|---|---|---|
| Älvkar -leby |
Enkö -ping |
Håbo | Östham -mar |
Tierp | Upp -sala |
Con. | Lev. | Tot. | ||||
| Swedish Social Democratic Party | 4,681 | 8,139 | 1,752 | 5,282 | 7,445 | 32,791 | 60,090 | 42.96% | 4 | 0 | 4 | |
| Centre Party | 917 | 6,447 | 1,205 | 3,697 | 3,934 | 21,381 | 37,581 | 26.87% | 2 | 1 | 3 | |
| Moderate Party | 245 | 2,371 | 563 | 1,057 | 785 | 13,016 | 18,037 | 12.90% | 1 | 0 | 1 | |
| People's Party | 299 | 1,351 | 400 | 634 | 1,059 | 9,575 | 13,318 | 9.52% | 1 | 0 | 1 | |
| Left Party – Communists | 337 | 569 | 215 | 474 | 365 | 5,717 | 7,677 | 5.49% | 0 | 0 | 0 | |
| Christian Democratic Unity | 34 | 282 | 25 | 233 | 396 | 1,287 | 2,257 | 1.61% | 0 | 0 | 0 | |
| Communist Party of Sweden | 8 | 20 | 8 | 23 | 12 | 585 | 656 | 0.47% | 0 | 0 | 0 | |
| Communist League Marxist–Leninists (the revolutionaries) | 3 | 4 | 0 | 4 | 4 | 165 | 180 | 0.13% | 0 | 0 | 0 | |
| Other parties | 1 | 2 | 0 | 0 | 0 | 75 | 78 | 0.06% | 0 | 0 | 0 | |
| Valid Votes | 6,525 | 19,185 | 4,168 | 11,404 | 14,000 | 84,592 | 139,874 | 100.00% | 8 | 1 | 9 | |
| Invalid votes | 5 | 28 | 9 | 14 | 10 | 161 | 227 | 0.16% | ||||
| Total Polled | 6,530 | 19,213 | 4,177 | 11,418 | 14,010 | 84,753 | 140,101 | 90.36% | ||||
| Registered Electors | 7,040 | 21,462 | 4,500 | 12,699 | 15,166 | 94,176 | 155,043 | |||||
| Turnout | 92.76% | 89.52% | 92.82% | 89.91% | 92.38% | 89.99% | 90.36% | |||||
1970[]
Results of the 1970 general election held on 20 September 1970:[37][38]
| Party | Votes per municipality | Total Votes | % | Seats | |||||||||||||||||
|---|---|---|---|---|---|---|---|---|---|---|---|---|---|---|---|---|---|---|---|---|---|
| Älvkar -leby |
Danne -mora |
Enkö -ping |
Håbo | Häll -näs |
Öland | Öster -lovsta |
Östham -mar |
Söder -fors |
Tierp | Tierps -bygden |
Upp -sala |
Väst -land |
Vendel | Postal Votes |
Con. | Lev. | Tot. | ||||
| Swedish Social Democratic Party | 4,361 | 1,224 | 7,530 | 1,327 | 498 | 2,055 | 555 | 2,026 | 1,231 | 1,637 | 834 | 27,997 | 917 | 1,328 | 6,662 | 60,182 | 45.84% | 4 | 0 | 4 | |
| Centre Party | 593 | 551 | 4,891 | 590 | 347 | 1,658 | 396 | 1,621 | 150 | 478 | 752 | 13,309 | 420 | 649 | 3,096 | 29,501 | 22.47% | 2 | 0 | 2 | |
| People's Party | 364 | 155 | 1,682 | 347 | 227 | 351 | 105 | 501 | 102 | 274 | 131 | 10,584 | 82 | 266 | 4,148 | 19,319 | 14.72% | 1 | 0 | 1 | |
| Moderate Party | 130 | 94 | 1,429 | 214 | 25 | 438 | 75 | 447 | 46 | 138 | 89 | 6,642 | 30 | 146 | 4,177 | 14,120 | 10.76% | 1 | 0 | 1 | |
| Left Party – Communists | 210 | 179 | 313 | 84 | 7 | 100 | 18 | 111 | 64 | 54 | 35 | 2,874 | 45 | 44 | 588 | 4,726 | 3.60% | 0 | 0 | 0 | |
| Christian Democratic Unity | 41 | 79 | 199 | 16 | 56 | 82 | 94 | 76 | 22 | 55 | 52 | 1,089 | 61 | 74 | 558 | 2,554 | 1.95% | 0 | 0 | 0 | |
| Communist League Marxists-Leninists | 26 | 1 | 31 | 3 | 0 | 11 | 1 | 10 | 6 | 3 | 1 | 563 | 8 | 2 | 192 | 858 | 0.65% | 0 | 0 | 0 | |
| Other parties | 0 | 0 | 0 | 0 | 0 | 0 | 0 | 0 | 0 | 1 | 0 | 3 | 0 | 0 | 18 | 22 | 0.02% | 0 | 0 | 0 | |
| Valid Votes | 5,725 | 2,283 | 16,075 | 2,581 | 1,160 | 4,695 | 1,244 | 4,792 | 1,621 | 2,640 | 1,894 | 63,061 | 1,563 | 2,509 | 19,439 | 131,282 | 100.00% | 8 | 0 | 8 | |
| Invalid votes | 9 | 1 | 13 | 3 | 0 | 3 | 1 | 6 | 1 | 1 | 1 | 100 | 0 | 1 | 91 | 231 | 0.18% | ||||
| Total Polled exc. Postal Votes | 5,734 | 2,284 | 16,088 | 2,584 | 1,160 | 4,698 | 1,245 | 4,798 | 1,622 | 2,641 | 1,895 | 63,161 | 1,563 | 2,510 | 19,530 | 131,513 | |||||
| Postal Votes | 734 | 237 | 2,573 | 314 | 67 | 414 | 149 | 474 | 246 | 383 | 134 | 13,400 | 154 | 261 | -19,530 | 10 | |||||
| Total Polled inc. Postal Votes | 6,468 | 2,521 | 18,661 | 2,898 | 1,227 | 5,112 | 1,394 | 5,272 | 1,868 | 3,024 | 2,029 | 76,561 | 1,717 | 2,771 | 0 | 131,523 | 87.71% | ||||
| Registered Electors | 7,092 | 2,717 | 21,456 | 3,267 | 1,312 | 5,895 | 1,533 | 6,245 | 1,994 | 3,327 | 2,353 | 87,822 | 1,848 | 3,088 | 149,949 | ||||||
| Turnout | 91.20% | 92.79% | 86.97% | 88.71% | 93.52% | 86.72% | 90.93% | 84.42% | 93.68% | 90.89% | 86.23% | 87.18% | 92.91% | 89.73% | 87.71% | ||||||
References[]
- ^ "Population in the country, counties and municipalities on December 31, 2019 and population change in October–December 2019". Stockholm, Sweden: Statistics Sweden. Retrieved 13 May 2020.
- ^ "Members and parties". Stockholm, Sweden: Riksdag. Retrieved 13 May 2020.
- ^ "Valpresentationen 2018: Val till riksdagen - Röster - riksdagsvalkrets Uppsala län" (in Swedish). Solna, Sweden: Election Authority. Retrieved 15 May 2020.
- ^ "Val till riksdagen 2018-09-09: Röster och mandat för partierna" (PDF) (in Swedish). Solna, Sweden: Election Authority. p. 3. Retrieved 17 July 2020.
- ^ "Valpresentationen 2018: Val till riksdagen - Personröster - riksdagsvalkrets Uppsala län" (in Swedish). Solna, Sweden: Election Authority. Retrieved 15 May 2020.
- ^ "2014: Val till riksdagen - Röster - Uppsala län" (in Swedish). Solna, Sweden: Election Authority. Retrieved 15 May 2020.
- ^ "Val till riksdagen 2014-09-14: Röster och mandat för partierna" (PDF) (in Swedish). Solna, Sweden: Election Authority. p. 2. Retrieved 14 March 2020.
- ^ "2014: Val till riksdagen - Personröster - Uppsala län" (in Swedish). Solna, Sweden: Election Authority. Retrieved 15 May 2020.
- ^ "2010: Val till riksdagen - Röster - Uppsala län" (in Swedish). Solna, Sweden: Election Authority. Retrieved 16 May 2020.
- ^ Allmänna valen 2010: Del 1. - Riksdagen den 19 september 2010 (PDF) (in Swedish). Stockholm, Sweden: Statistics Sweden. 30 March 2011. p. 337. ISSN 1654-1006. Retrieved 6 April 2020.
- ^ Allmänna valen 2010: Del 1. - Riksdagen den 19 september 2010 (PDF) (in Swedish). Stockholm, Sweden: Statistics Sweden. 30 March 2011. p. 358. ISSN 1654-1006. Retrieved 6 April 2020.
- ^ "Allmänna val 17 september 2006: Val till riksdagen - Riksdagsvalkrets Uppsala län" (in Swedish). Solna, Sweden: Election Authority. Retrieved 16 May 2020.
- ^ Allmänna valen 2006 Del 1. Riksdagen den 17 september 2006 (PDF) (in Swedish). Stockholm, Sweden: Statistics Sweden. 2007. p. 272. ISBN 978-91-618-1362-9. ISSN 1654-1006. Retrieved 6 April 2020.
- ^ Allmänna valen 2006 Del 1. Riksdagen den 17 september 2006 (PDF) (in Swedish). Stockholm, Sweden: Statistics Sweden. 2007. pp. 286–287. ISBN 978-91-618-1362-9. ISSN 1654-1006. Retrieved 6 April 2020.
- ^ "Uppsala län - Riksdagsval" (in Swedish). Solna, Sweden: Election Authority. Retrieved 16 May 2020.
- ^ Allmänna valen 2002 Del 1. Riksdagen den 15 september 2002 (PDF) (in Swedish). Stockholm, Sweden: Statistics Sweden. 2003. p. 28. ISBN 978-91-618-1362-9. ISSN 1654-1006. Retrieved 6 April 2020.
- ^ Allmänna valen 2002 Del 1. Riksdagen den 15 september 2002 (PDF) (in Swedish). Stockholm, Sweden: Statistics Sweden. 2003. pp. 272–273. ISBN 978-91-618-1362-9. ISSN 1654-1006. Retrieved 6 April 2020.
- ^ Allmänna valen 1998. Del 1, Riksdagen den 20 september 1998 (PDF) (in Swedish). Stockholm, Sweden: Statistics Sweden. 1999. pp. 80–85. ISBN 91-618-1001-0. Retrieved 6 April 2020.
- ^ Allmänna valen 1998. Del 1, Riksdagen den 20 september 1998 (PDF) (in Swedish). Stockholm, Sweden: Statistics Sweden. 1999. p. 30. ISBN 91-618-1001-0. Retrieved 6 April 2020.
- ^ Allmänna valen 1998. Del 1, Riksdagen den 20 september 1998 (PDF) (in Swedish). Stockholm, Sweden: Statistics Sweden. 1999. pp. 277–278. ISBN 91-618-1001-0. Retrieved 6 April 2020.
- ^ Allmänna valen 1994. Del 1, Riksdagsvalet den 18 september 1994 (PDF) (in Swedish). Stockholm, Sweden: Statistics Sweden. 1995. pp. 81–86. ISBN 91-618-0748-6. ISSN 0347-8084. Retrieved 6 April 2020.
- ^ Allmänna valen 1994. Del 1, Riksdagsvalet den 18 september 1994 (PDF) (in Swedish). Stockholm, Sweden: Statistics Sweden. 1995. p. 34. ISBN 91-618-0748-6. ISSN 0347-8084. Retrieved 6 April 2020.
- ^ Allmänna valen 1991. Del 1, Riksdagsvalet den 15 september 1991 (PDF) (in Swedish). Stockholm, Sweden: Statistics Sweden. 1992. pp. 66–71. ISBN 91-618-0508-4. ISSN 0347-8084. Retrieved 6 April 2020.
- ^ Allmänna valen 1991. Del 1, Riksdagsvalet den 15 september 1991 (PDF) (in Swedish). Stockholm, Sweden: Statistics Sweden. 1992. p. 20. ISBN 91-618-0508-4. ISSN 0347-8084. Retrieved 6 April 2020.
- ^ Allmänna valen 1988. Del 1, Riksdagsvalet den 18 september 1988 (PDF) (in Swedish). Stockholm, Sweden: Statistics Sweden. 1989. pp. 45–48. ISBN 91-618-0298-0. ISSN 0347-8084. Retrieved 6 April 2020.
- ^ Allmänna valen 1988. Del 1, Riksdagsvalet den 18 september 1988 (PDF) (in Swedish). Stockholm, Sweden: Statistics Sweden. 1989. p. 21. ISBN 91-618-0298-0. ISSN 0347-8084. Retrieved 6 April 2020.
- ^ Allmänna valen 1985. Del 1, Riksdagsvalet den 15 september 1985 (PDF) (in Swedish). Stockholm, Sweden: Statistics Sweden. 1986. pp. 49–52. ISBN 91-618-0107-0. ISSN 0347-8084. Retrieved 6 April 2020.
- ^ Allmänna valen 1985. Del 1, Riksdagsvalet den 15 september 1985 (PDF) (in Swedish). Stockholm, Sweden: Statistics Sweden. 1986. p. 23. ISBN 91-618-0107-0. ISSN 0347-8084. Retrieved 6 April 2020.
- ^ Allmänna valen 1982. Del 1, Riksdagsvalet den 19 september 1982 (PDF) (in Swedish). Stockholm, Sweden: Statistics Sweden. 1983. pp. 47–50. ISBN 91-38-07261-0. ISSN 0347-8084. Retrieved 6 April 2020.
- ^ Allmänna valen 1982. Del 1, Riksdagsvalet den 19 september 1982 (PDF) (in Swedish). Stockholm, Sweden: Statistics Sweden. 1983. p. 23. ISBN 91-38-07261-0. ISSN 0347-8084. Retrieved 6 April 2020.
- ^ Allmänna valen 1979. Del 1, Riksdagsvalet den 16 september 1979 (PDF) (in Swedish). Stockholm, Sweden: Statistics Sweden. 1983. pp. 47–50. ISBN 91-38-05351-9. Retrieved 6 April 2020.
- ^ Allmänna valen 1979. Del 1, Riksdagsvalet den 16 september 1979 (PDF) (in Swedish). Stockholm, Sweden: Statistics Sweden. 1983. p. 23. ISBN 91-38-05351-9. Retrieved 6 April 2020.
- ^ Allmänna valen 1976. Del 1, Riksdagsvalet den 19 september 1976 (PDF) (in Swedish). Stockholm, Sweden: Statistics Sweden. 1977. pp. 38–41. ISBN 91-38-03530-8. Retrieved 6 April 2020.
- ^ Allmänna valen 1976. Del 1, Riksdagsvalet den 19 september 1976 (PDF) (in Swedish). Stockholm, Sweden: Statistics Sweden. 1977. p. 15. ISBN 91-38-03530-8. Retrieved 6 April 2020.
- ^ Allmänna valen 1973. Del 1, Riksdagsvalet den 26 september 1973 (PDF) (in Swedish). Stockholm, Sweden: Statistics Sweden. 1974. pp. 39–42. ISBN 91-38-01908-6. Retrieved 6 April 2020.
- ^ Allmänna valen 1973. Del 1, Riksdagsvalet den 26 september 1973 (PDF) (in Swedish). Stockholm, Sweden: Statistics Sweden. 1974. p. 17. ISBN 91-38-01908-6. Retrieved 6 April 2020.
- ^ Allmänna valen 1970. Del 1, Riksdagsvalet den 20 september 1970 (PDF) (in Swedish). Stockholm, Sweden: Statistics Sweden. 1971. pp. 50–54. Retrieved 6 April 2020.
- ^ Allmänna valen 1970. Del 1, Riksdagsvalet den 20 september 1970 (PDF) (in Swedish). Stockholm, Sweden: Statistics Sweden. 1971. p. 24. Retrieved 6 April 2020.
- Riksdag constituencies
- Riksdag constituencies established in 1970
- Uppsala County