Västra Götaland County East (Riksdag constituency)
| Västra Götaland County East | |
|---|---|
| Västra Götalands läns östra | |
| Constituency for the Riksdag | |
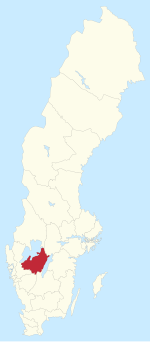 Location of Västra Götaland County East within Sweden | |
| Municipality | |
| County | Västra Götaland |
| Population | 268,462 (2019)[1] |
| Electorate | 202,936 (2018) |
| Current constituency | |
| Created | 1970 |
| Seats | List
|
| Member of the Riksdag[2] | List
|
| Regional council | Västra Götaland Regional Council |
| Created from | |
Västra Götaland County East (Swedish: Västra Götalands läns östra) is one of the 29 multi-member constituencies of the Riksdag, the national legislature of Sweden. The constituency was established as Skaraborg County in 1970 when the Riksdag changed from a bicameral legislature to a unicameral legislature. It was renamed Västra Götaland County East in 1998 when the counties of Älvsborg, Gothenburg and Bohus and Skaraborg were merged to create Västra Götaland. The constituency currently consists of the municipalities of Essunga, Falköping, Götene, Grästorp, Gullspång, Hjo, Karlsborg, Lidköping, Mariestad, Skara, Skövde, Tibro, Tidaholm, Töreboda and Vara.
Västra Götaland County East currently elects nine of the 349 members of the Riksdag using the modified Sainte-Laguë method open party-list proportional representation electoral system. Parties that receive at least 4% of the vote nationally and other parties that receive at least 12% of the vote in the constituency compete for constituency seats. Supplementary leveling seats may also be allocated at the constituency level to parties that reach the 4% national threshold. At the 2018 general election the constituency had 202,936 registered electors.
Election results[]
Summary[]
| Election | Left V/VPK |
Social Democrats S |
Greens MP |
Liberals L/FP/F |
Centre C |
Moderates M |
Christian Democrats KD/KDS |
Sweden Democrats SD | ||||||||||||||||
|---|---|---|---|---|---|---|---|---|---|---|---|---|---|---|---|---|---|---|---|---|---|---|---|---|
| Votes | % | Seats | Votes | % | Seats | Votes | % | Seats | Votes | % | Seats | Votes | % | Seats | Votes | % | Seats | Votes | % | Seats | Votes | % | Seats | |
| 2018 | 10,106 | 5.71% | 0 | 53,888 | 30.45% | 3 | 5,425 | 3.06% | 0 | 7,662 | 4.33% | 0 | 16,533 | 9.34% | 1 | 32,569 | 18.40% | 2 | 13,837 | 7.82% | 1 | 34,501 | 19.49% | 2 |
| 2014 | 7,858 | 4.50% | 0 | 60,424 | 34.64% | 4 | 8,707 | 4.99% | 0 | 7,392 | 4.24% | 0 | 14,295 | 8.19% | 1 | 36,579 | 20.97% | 2 | 8,919 | 5.11% | 0 | 25,765 | 14.77% | 2 |
| 2010 | 8,223 | 4.88% | 0 | 57,095 | 33.87% | 4 | 9,440 | 5.60% | 0 | 10,387 | 6.16% | 0 | 13,914 | 8.25% | 1 | 47,049 | 27.91% | 3 | 11,092 | 6.58% | 1 | 9,725 | 5.77% | 0 |
| 2006 | 8,165 | 5.12% | 0 | 61,219 | 38.41% | 4 | 5,821 | 3.65% | 0 | 8,702 | 5.46% | 0 | 16,655 | 10.45% | 1 | 37,484 | 23.52% | 3 | 13,091 | 8.21% | 1 | 4,883 | 3.06% | 0 |
| 2002 | 11,634 | 7.58% | 1 | 62,570 | 40.77% | 4 | 5,714 | 3.72% | 0 | 15,273 | 9.95% | 1 | 15,044 | 9.80% | 1 | 21,328 | 13.90% | 1 | 18,859 | 12.29% | 1 | 1,702 | 1.11% | 0 |
| 1998 | 17,605 | 11.26% | 1 | 56,475 | 36.11% | 3 | 6,196 | 3.96% | 0 | 6,034 | 3.86% | 0 | 12,606 | 8.06% | 1 | 30,254 | 19.34% | 2 | 24,556 | 15.70% | 2 | |||
| 1994 | 9,854 | 5.50% | 0 | 75,939 | 42.42% | 5 | 9,353 | 5.22% | 0 | 10,512 | 5.87% | 1 | 22,111 | 12.35% | 1 | 36,963 | 20.65% | 2 | 10,374 | 5.79% | 1 | |||
| 1991 | 6,305 | 3.52% | 0 | 61,063 | 34.13% | 4 | 5,015 | 2.80% | 0 | 13,623 | 7.61% | 1 | 22,998 | 12.85% | 1 | 35,732 | 19.97% | 2 | 18,727 | 10.47% | 1 | |||
| 1988 | 6,938 | 3.96% | 0 | 70,812 | 40.46% | 5 | 8,556 | 4.89% | 0 | 20,263 | 11.58% | 1 | 31,102 | 17.77% | 2 | 29,476 | 16.84% | 2 | 7,591 | 4.34% | 0 | |||
| 1985 | 6,019 | 3.32% | 0 | 72,915 | 40.23% | 4 | 2,444 | 1.35% | 0 | 26,122 | 14.41% | 2 | 36,347 | 20.05% | 2 | 37,047 | 20.44% | 2 | ||||||
| 1982 | 6,191 | 3.42% | 0 | 71,768 | 39.65% | 4 | 2,163 | 1.19% | 0 | 11,534 | 6.37% | 0 | 41,702 | 23.04% | 3 | 41,932 | 23.16% | 3 | 5,474 | 3.02% | 0 | |||
| 1979 | 6,013 | 3.39% | 0 | 64,305 | 36.29% | 4 | 18,284 | 10.32% | 1 | 46,788 | 26.40% | 3 | 35,825 | 20.22% | 2 | 4,228 | 2.39% | 0 | ||||||
| 1976 | 4,467 | 2.54% | 0 | 61,075 | 34.75% | 4 | 18,832 | 10.72% | 1 | 60,387 | 34.36% | 3 | 26,860 | 15.28% | 2 | 3,764 | 2.14% | 0 | ||||||
| 1973 | 4,804 | 2.88% | 0 | 59,408 | 35.65% | 4 | 16,630 | 9.98% | 1 | 55,981 | 33.59% | 3 | 24,442 | 14.67% | 2 | 5,040 | 3.02% | 0 | ||||||
| 1970 | 4,508 | 2.81% | 0 | 57,686 | 35.91% | 4 | 24,964 | 15.54% | 2 | 47,942 | 29.84% | 3 | 20,775 | 12.93% | 1 | 4,513 | 2.81% | 0 | ||||||
(Excludes leveling seats)
Detailed[]
2018[]
Results of the 2018 general election held on 9 September 2018:[3][4]
| Party | Votes | % | Seats | |||
|---|---|---|---|---|---|---|
| Con. | Lev. | Tot. | ||||
| Swedish Social Democratic Party | 53,888 | 30.45% | 3 | 0 | 3 | |
| Sweden Democrats | 34,501 | 19.49% | 2 | 0 | 2 | |
| Moderate Party | 32,569 | 18.40% | 2 | 0 | 2 | |
| Centre Party | 16,533 | 9.34% | 1 | 0 | 1 | |
| Christian Democrats | 13,837 | 7.82% | 1 | 0 | 1 | |
| Left Party | 10,106 | 5.71% | 0 | 1 | 1 | |
| Liberals | 7,662 | 4.33% | 0 | 0 | 0 | |
| Green Party | 5,425 | 3.06% | 0 | 0 | 0 | |
| Feminist Initiative | 627 | 0.35% | 0 | 0 | 0 | |
| Alternative for Sweden | 544 | 0.31% | 0 | 0 | 0 | |
| Pirate Party | 306 | 0.17% | 0 | 0 | 0 | |
| Citizens' Coalition | 290 | 0.16% | 0 | 0 | 0 | |
| Independent Rural Party | 147 | 0.08% | 0 | 0 | 0 | |
| Unity | 136 | 0.08% | 0 | 0 | 0 | |
| Direct Democrats | 124 | 0.07% | 0 | 0 | 0 | |
| Animal Party | 90 | 0.05% | 0 | 0 | 0 | |
| Christian Values Party | 76 | 0.04% | 0 | 0 | 0 | |
| Nordic Resistance Movement | 74 | 0.04% | 0 | 0 | 0 | |
| Classical Liberal Party | 22 | 0.01% | 0 | 0 | 0 | |
| Basic Income Party | 16 | 0.01% | 0 | 0 | 0 | |
| Communist Party of Sweden | 7 | 0.00% | 0 | 0 | 0 | |
| Initiative | 5 | 0.00% | 0 | 0 | 0 | |
| Parties not on the ballot | 16 | 0.01% | 0 | 0 | 0 | |
| Valid Votes | 177,001 | 100.00% | 9 | 1 | 10 | |
| Invalid votes – unregistered parties | 51 | 0.03% | ||||
| Blank votes | 1,807 | 1.01% | ||||
| Invalid votes – other | 88 | 0.05% | ||||
| Total Polled | 178,947 | 88.18% | ||||
| Registered Electors | 202,936 | |||||
The following candidates were elected:[5] Tobias Andersson (SD), 168 votes; Sten Bergheden (M), 2,594 votes; (S), 1,542 votes; Ebba Busch (KD), 3,232 votes; Ulrika Carlsson (C), 1,399 votes; (S), 1,134 votes; Josef Fransson (SD), 231 votes; Carina Ohlsson (S), 1,776 votes; Jessica Thunander (V), 539 votes; and Cecilia Widegren (M), 2,054 votes.
2014[]
Results of the 2014 general election held on 14 September 2014:[6][7]
| Party | Votes | % | Seats | |||
|---|---|---|---|---|---|---|
| Con. | Lev. | Tot. | ||||
| Swedish Social Democratic Party | 60,424 | 34.64% | 4 | 0 | 4 | |
| Moderate Party | 36,579 | 20.97% | 2 | 0 | 2 | |
| Sweden Democrats | 25,765 | 14.77% | 2 | 0 | 2 | |
| Centre Party | 14,295 | 8.19% | 1 | 0 | 1 | |
| Christian Democrats | 8,919 | 5.11% | 0 | 1 | 1 | |
| Green Party | 8,707 | 4.99% | 0 | 0 | 0 | |
| Left Party | 7,858 | 4.50% | 0 | 0 | 0 | |
| Liberal People's Party | 7,392 | 4.24% | 0 | 0 | 0 | |
| Feminist Initiative | 3,035 | 1.74% | 0 | 0 | 0 | |
| Pirate Party | 754 | 0.43% | 0 | 0 | 0 | |
| Unity | 149 | 0.09% | 0 | 0 | 0 | |
| Party of the Swedes | 140 | 0.08% | 0 | 0 | 0 | |
| Christian Values Party | 109 | 0.06% | 0 | 0 | 0 | |
| Independent Rural Party | 93 | 0.05% | 0 | 0 | 0 | |
| Animal Party | 72 | 0.04% | 0 | 0 | 0 | |
| Classical Liberal Party | 32 | 0.02% | 0 | 0 | 0 | |
| Direct Democrats | 24 | 0.01% | 0 | 0 | 0 | |
| Health Party | 4 | 0.00% | 0 | 0 | 0 | |
| Communist Party of Sweden | 3 | 0.00% | 0 | 0 | 0 | |
| Progressive Party | 2 | 0.00% | 0 | 0 | 0 | |
| Nya Partiet | 1 | 0.00% | 0 | 0 | 0 | |
| Peace Democrats | 1 | 0.00% | 0 | 0 | 0 | |
| Socialist Justice Party | 1 | 0.00% | 0 | 0 | 0 | |
| Swedish Senior Citizen Interest Party | 1 | 0.00% | 0 | 0 | 0 | |
| Parties not on the ballot | 85 | 0.05% | 0 | 0 | 0 | |
| Valid Votes | 174,445 | 100.00% | 9 | 1 | 10 | |
| Blank votes | 1,837 | 1.04% | ||||
| Invalid votes | 50 | 0.03% | ||||
| Total Polled | 176,332 | 87.17% | ||||
| Registered Electors | 202,294 | |||||
The following candidates were elected:[8] Urban Ahlin (S), 3,453 votes; Sten Bergheden (M), 2,038 votes; (S), 964 votes; Ulrika Carlsson (C), 1,604 votes; (SD), 1 votes; (KD), 934 votes; Monica Green (S), 1,951 votes; Margareta Larsson (SD), 8 votes; Carina Ohlsson (S), 2,120 votes; and Cecilia Widegren (M), 3,402 votes.
2010[]
Results of the 2010 general election held on 19 September 2010:[9][10]
| Party | Votes | % | Seats | |||
|---|---|---|---|---|---|---|
| Con. | Lev. | Tot. | ||||
| Swedish Social Democratic Party | 57,095 | 33.87% | 4 | 0 | 4 | |
| Moderate Party | 47,049 | 27.91% | 3 | 0 | 3 | |
| Centre Party | 13,914 | 8.25% | 1 | 0 | 1 | |
| Christian Democrats | 11,092 | 6.58% | 1 | 0 | 1 | |
| Liberal People's Party | 10,387 | 6.16% | 0 | 1 | 1 | |
| Sweden Democrats | 9,725 | 5.77% | 0 | 0 | 0 | |
| Green Party | 9,440 | 5.60% | 0 | 0 | 0 | |
| Left Party | 8,223 | 4.88% | 0 | 0 | 0 | |
| Pirate Party | 1,081 | 0.64% | 0 | 0 | 0 | |
| Feminist Initiative | 382 | 0.23% | 0 | 0 | 0 | |
| Rural Democrats | 25 | 0.01% | 0 | 0 | 0 | |
| Party of the Swedes | 22 | 0.01% | 0 | 0 | 0 | |
| Freedom Party | 17 | 0.01% | 0 | 0 | 0 | |
| National Democrats | 17 | 0.01% | 0 | 0 | 0 | |
| Classical Liberal Party | 10 | 0.01% | 0 | 0 | 0 | |
| Swedish Senior Citizen Interest Party | 7 | 0.00% | 0 | 0 | 0 | |
| Socialist Justice Party | 6 | 0.00% | 0 | 0 | 0 | |
| Spirits Party | 5 | 0.00% | 0 | 0 | 0 | |
| Unity | 5 | 0.00% | 0 | 0 | 0 | |
| Health Care Party | 4 | 0.00% | 0 | 0 | 0 | |
| Communist Party of Sweden | 3 | 0.00% | 0 | 0 | 0 | |
| Norrländska Coalition | 3 | 0.00% | 0 | 0 | 0 | |
| Active Democracy | 1 | 0.00% | 0 | 0 | 0 | |
| Communist League | 1 | 0.00% | 0 | 0 | 0 | |
| Freedom of the Justice Party | 1 | 0.00% | 0 | 0 | 0 | |
| Parties not on the ballot | 46 | 0.03% | 0 | 0 | 0 | |
| Valid Votes | 168,561 | 100.00% | 9 | 1 | 10 | |
| Blank votes | 2,297 | 1.34% | ||||
| Invalid votes | 52 | 0.03% | ||||
| Total Polled | 170,910 | 85.32% | ||||
| Registered Electors | 200,322 | |||||
The following candidates were elected:[11] Urban Ahlin (S), 3,979 votes; Sten Bergheden (M), 1,553 votes; (S), 1,356 votes; Ulrika Carlsson (C), 1,989 votes; (KD), 1,054 votes; Lars Elinderson (M), 1,266 votes; Monica Green (S), 2,690 votes; Carina Ohlsson (S), 2,255 votes; Cecilia Widegren (M), 5,659 votes; and Christer Winbäck (FP), 561 votes.
2006[]
Results of the 2006 general election held on 17 September 2006:[12][13]
| Party | Votes | % | Seats | |||
|---|---|---|---|---|---|---|
| Con. | Lev. | Tot. | ||||
| Swedish Social Democratic Party | 61,219 | 38.41% | 4 | 0 | 4 | |
| Moderate Party | 37,484 | 23.52% | 3 | 0 | 3 | |
| Centre Party | 16,655 | 10.45% | 1 | 0 | 1 | |
| Christian Democrats | 13,091 | 8.21% | 1 | 0 | 1 | |
| Liberal People's Party | 8,702 | 5.46% | 0 | 1 | 1 | |
| Left Party | 8,165 | 5.12% | 0 | 1 | 1 | |
| Green Party | 5,821 | 3.65% | 0 | 0 | 0 | |
| Sweden Democrats | 4,883 | 3.06% | 0 | 0 | 0 | |
| Pirate Party | 1,059 | 0.66% | 0 | 0 | 0 | |
| June List | 886 | 0.56% | 0 | 0 | 0 | |
| Feminist Initiative | 693 | 0.43% | 0 | 0 | 0 | |
| Health Care Party | 233 | 0.15% | 0 | 0 | 0 | |
| Swedish Senior Citizen Interest Party | 190 | 0.12% | 0 | 0 | 0 | |
| People's Will | 79 | 0.05% | 0 | 0 | 0 | |
| National Socialist Front | 51 | 0.03% | 0 | 0 | 0 | |
| Unity | 45 | 0.03% | 0 | 0 | 0 | |
| New Future | 31 | 0.02% | 0 | 0 | 0 | |
| National Democrats | 30 | 0.02% | 0 | 0 | 0 | |
| Unique Party | 28 | 0.02% | 0 | 0 | 0 | |
| Kvinnokraft | 9 | 0.01% | 0 | 0 | 0 | |
| Socialist Justice Party | 4 | 0.00% | 0 | 0 | 0 | |
| Classical Liberal Party | 3 | 0.00% | 0 | 0 | 0 | |
| Active Democracy | 1 | 0.00% | 0 | 0 | 0 | |
| The Communists | 1 | 0.00% | 0 | 0 | 0 | |
| Other parties | 25 | 0.02% | 0 | 0 | 0 | |
| Valid Votes | 159,388 | 100.00% | 9 | 2 | 11 | |
| Blank votes | 3,086 | 1.90% | ||||
| Invalid votes | 75 | 0.05% | ||||
| Total Polled | 162,549 | 82.49% | ||||
| Registered Electors | 197,047 | |||||
The following candidates were elected:[14] Urban Ahlin (S), 2,708 votes; (S), 1,482 votes; Ulrika Carlsson (C), 1,599 votes; Lars Elinderson (M), 1,785 votes; (V), 592 votes; Monica Green (S), 2,980 votes; Holger Gustafsson (KD), 1,482 votes; (M), 978 votes; Carina Ohlsson (S), 2,195 votes; Cecilia Widegren (M), 4,827 votes; and Christer Winbäck (FP), 484 votes.
2002[]
Results of the 2002 general election held on 15 September 2002:[15][16]
| Party | Votes | % | Seats | |||
|---|---|---|---|---|---|---|
| Con. | Lev. | Tot. | ||||
| Swedish Social Democratic Party | 62,570 | 40.77% | 4 | 0 | 4 | |
| Moderate Party | 21,328 | 13.90% | 1 | 0 | 1 | |
| Christian Democrats | 18,859 | 12.29% | 1 | 0 | 1 | |
| Liberal People's Party | 15,273 | 9.95% | 1 | 0 | 1 | |
| Centre Party | 15,044 | 9.80% | 1 | 0 | 1 | |
| Left Party | 11,634 | 7.58% | 1 | 0 | 1 | |
| Green Party | 5,714 | 3.72% | 0 | 0 | 0 | |
| Sweden Democrats | 1,702 | 1.11% | 0 | 0 | 0 | |
| New Future | 470 | 0.31% | 0 | 0 | 0 | |
| Swedish Senior Citizen Interest Party | 393 | 0.26% | 0 | 0 | 0 | |
| Socialist Party | 25 | 0.02% | 0 | 0 | 0 | |
| Unity | 9 | 0.01% | 0 | 0 | 0 | |
| Rikshushållarna | 2 | 0.00% | 0 | 0 | 0 | |
| Socialist Justice Party | 2 | 0.00% | 0 | 0 | 0 | |
| Communist League | 1 | 0.00% | 0 | 0 | 0 | |
| The Communists | 1 | 0.00% | 0 | 0 | 0 | |
| European Workers Party | 1 | 0.00% | 0 | 0 | 0 | |
| Other parties | 456 | 0.30% | 0 | 0 | 0 | |
| Valid Votes | 153,484 | 100.00% | 9 | 0 | 9 | |
| Invalid votes | 2,617 | 1.68% | ||||
| Total Polled | 156,101 | 80.52% | ||||
| Registered Electors | 193,865 | |||||
The following candidates were elected:[17] Urban Ahlin (S), 2,167 votes; Birgitta Carlsson (C), 2,361 votes; Monica Green (S), 2,921 votes; Holger Gustafsson (KD), 2,572 votes; (S), 4,228 votes; Carina Ohlsson (S), 2,389 votes; Per Rosengren (V), 862 votes; Cecilia Widegren (M), 2,883 votes; and Christer Winbäck (FP), 1,178 votes.
1998[]
Results of the 1998 general election held on 20 September 1998:[18][19]
| Party | Votes | % | Seats | |||
|---|---|---|---|---|---|---|
| Con. | Lev. | Tot. | ||||
| Swedish Social Democratic Party | 56,475 | 36.11% | 3 | 1 | 4 | |
| Moderate Party | 30,254 | 19.34% | 2 | 0 | 2 | |
| Christian Democrats | 24,556 | 15.70% | 2 | 0 | 2 | |
| Left Party | 17,605 | 11.26% | 1 | 0 | 1 | |
| Centre Party | 12,606 | 8.06% | 1 | 0 | 1 | |
| Green Party | 6,196 | 3.96% | 0 | 0 | 0 | |
| Liberal People's Party | 6,034 | 3.86% | 0 | 0 | 0 | |
| Other parties | 2,666 | 1.70% | 0 | 0 | 0 | |
| Valid Votes | 156,392 | 100.00% | 9 | 1 | 10 | |
| Invalid votes | 3,367 | 2.11% | ||||
| Total Polled | 159,759 | 81.93% | ||||
| Registered Electors | 195,000 | |||||
The following candidates were elected:[20] Urban Ahlin (S), 1,489 votes; Birgitta Carlsson (C), 2,512 votes; Lars Elinderson (M), 2,105 votes; Monica Green (S), 3,221 votes; Holger Gustafsson (KD), 1,020 votes; (KD), 227 votes; (M), 2,703 votes; (S), 4,712 votes; Per Rosengren (V), 1,800 votes; and Carina Ohlsson (S), 2,180 votes.
1994[]
Results of the 1994 general election held on 18 September 1994:[21][22]
| Party | Votes | % | Seats | |||
|---|---|---|---|---|---|---|
| Con. | Lev. | Tot. | ||||
| Swedish Social Democratic Party | 75,939 | 42.42% | 5 | 0 | 5 | |
| Moderate Party | 36,963 | 20.65% | 2 | 0 | 2 | |
| Centre Party | 22,111 | 12.35% | 1 | 0 | 1 | |
| Liberal People's Party | 10,512 | 5.87% | 1 | 0 | 1 | |
| Christian Democratic Unity | 10,374 | 5.79% | 1 | 0 | 1 | |
| Left Party | 9,854 | 5.50% | 0 | 1 | 1 | |
| Green Party | 9,353 | 5.22% | 0 | 1 | 1 | |
| New Democracy | 2,817 | 1.57% | 0 | 0 | 0 | |
| Other parties | 1,103 | 0.62% | 0 | 0 | 0 | |
| Valid Votes | 179,026 | 100.00% | 10 | 2 | 12 | |
| Invalid votes | 2,749 | 1.51% | ||||
| Total Polled | 181,775 | 87.23% | ||||
| Registered Electors | 208,391 | |||||
1991[]
Results of the 1991 general election held on 15 September 1991:[23][24]
| Party | Votes | % | Seats | |||
|---|---|---|---|---|---|---|
| Con. | Lev. | Tot. | ||||
| Swedish Social Democratic Party | 61,063 | 34.13% | 4 | 0 | 4 | |
| Moderate Party | 35,732 | 19.97% | 2 | 0 | 2 | |
| Centre Party | 22,998 | 12.85% | 1 | 1 | 2 | |
| Christian Democratic Unity | 18,727 | 10.47% | 1 | 0 | 1 | |
| New Democracy | 14,597 | 8.16% | 1 | 0 | 1 | |
| Liberal People's Party | 13,623 | 7.61% | 1 | 0 | 1 | |
| Left Party | 6,305 | 3.52% | 0 | 0 | 0 | |
| Green Party | 5,015 | 2.80% | 0 | 0 | 0 | |
| Other parties | 852 | 0.48% | 0 | 0 | 0 | |
| Valid Votes | 178,912 | 100.00% | 10 | 1 | 11 | |
| Invalid votes | 2,798 | 1.54% | ||||
| Total Polled | 181,710 | 87.45% | ||||
| Registered Electors | 207,783 | |||||
1988[]
Results of the 1988 general election held on 18 September 1988:[25][26]
| Party | Votes | % | Seats | |||
|---|---|---|---|---|---|---|
| Con. | Lev. | Tot. | ||||
| Swedish Social Democratic Party | 70,812 | 40.46% | 5 | 0 | 5 | |
| Centre Party | 31,102 | 17.77% | 2 | 0 | 2 | |
| Moderate Party | 29,476 | 16.84% | 2 | 0 | 2 | |
| Liberal People's Party | 20,263 | 11.58% | 1 | 0 | 1 | |
| Green Party | 8,556 | 4.89% | 0 | 1 | 1 | |
| Christian Democratic Unity | 7,591 | 4.34% | 0 | 0 | 0 | |
| Left Party – Communists | 6,938 | 3.96% | 0 | 0 | 0 | |
| Other parties | 263 | 0.15% | 0 | 0 | 0 | |
| Valid Votes | 175,001 | 100.00% | 10 | 1 | 11 | |
| Invalid votes | 1,926 | 1.09% | ||||
| Total Polled | 176,927 | 86.37% | ||||
| Registered Electors | 204,845 | |||||
1985[]
Results of the 1985 general election held on 15 September 1985:[27][28]
| Party | Votes | % | Seats | |||
|---|---|---|---|---|---|---|
| Con. | Lev. | Tot. | ||||
| Swedish Social Democratic Party | 72,915 | 40.23% | 4 | 1 | 5 | |
| Moderate Party | 37,047 | 20.44% | 2 | 0 | 2 | |
| Centre Party | 36,347 | 20.05% | 2 | 0 | 2 | |
| Liberal People's Party | 26,122 | 14.41% | 2 | 0 | 2 | |
| Left Party – Communists | 6,019 | 3.32% | 0 | 0 | 0 | |
| Green Party | 2,444 | 1.35% | 0 | 0 | 0 | |
| Other parties | 351 | 0.19% | 0 | 0 | 0 | |
| Valid Votes | 181,245 | 100.00% | 10 | 1 | 11 | |
| Invalid votes | 1,466 | 0.80% | ||||
| Total Polled | 182,711 | 90.14% | ||||
| Registered Electors | 202,686 | |||||
1982[]
Results of the 1982 general election held on 19 September 1982:[29][30]
| Party | Votes | % | Seats | |||
|---|---|---|---|---|---|---|
| Con. | Lev. | Tot. | ||||
| Swedish Social Democratic Party | 71,768 | 39.65% | 4 | 1 | 5 | |
| Moderate Party | 41,932 | 23.16% | 3 | 0 | 3 | |
| Centre Party | 41,702 | 23.04% | 3 | 0 | 3 | |
| Liberal People's Party | 11,534 | 6.37% | 0 | 1 | 1 | |
| Left Party – Communists | 6,191 | 3.42% | 0 | 0 | 0 | |
| Christian Democratic Unity | 5,474 | 3.02% | 0 | 0 | 0 | |
| Green Party | 2,163 | 1.19% | 0 | 0 | 0 | |
| K-Party | 21 | 0.01% | 0 | 0 | 0 | |
| Other parties | 235 | 0.13% | 0 | 0 | 0 | |
| Valid Votes | 181,020 | 100.00% | 10 | 2 | 12 | |
| Invalid votes | 1,425 | 0.78% | ||||
| Total Polled | 182,445 | 91.50% | ||||
| Registered Electors | 199,403 | |||||
1979[]
Results of the 1979 general election held on 16 September 1979:[31][32]
| Party | Votes | % | Seats | |||
|---|---|---|---|---|---|---|
| Con. | Lev. | Tot. | ||||
| Swedish Social Democratic Party | 64,305 | 36.29% | 4 | 0 | 4 | |
| Centre Party | 46,788 | 26.40% | 3 | 0 | 3 | |
| Moderate Party | 35,825 | 20.22% | 2 | 0 | 2 | |
| Liberal People's Party | 18,284 | 10.32% | 1 | 0 | 1 | |
| Left Party – Communists | 6,013 | 3.39% | 0 | 0 | 0 | |
| Christian Democratic Unity | 4,228 | 2.39% | 0 | 0 | 0 | |
| Communist Party of Sweden | 225 | 0.13% | 0 | 0 | 0 | |
| Workers' Party – The Communists | 46 | 0.03% | 0 | 0 | 0 | |
| Other parties | 1,482 | 0.84% | 0 | 0 | 0 | |
| Valid Votes | 177,196 | 100.00% | 10 | 0 | 10 | |
| Invalid votes | 662 | 0.37% | ||||
| Total Polled | 177,858 | 90.77% | ||||
| Registered Electors | 195,941 | |||||
1976[]
Results of the 1976 general election held on 19 September 1976:[33][34]
| Party | Votes | % | Seats | |||
|---|---|---|---|---|---|---|
| Con. | Lev. | Tot. | ||||
| Swedish Social Democratic Party | 61,075 | 34.75% | 4 | 0 | 4 | |
| Centre Party | 60,387 | 34.36% | 3 | 1 | 4 | |
| Moderate Party | 26,860 | 15.28% | 2 | 0 | 2 | |
| People's Party | 18,832 | 10.72% | 1 | 0 | 1 | |
| Left Party – Communists | 4,467 | 2.54% | 0 | 0 | 0 | |
| Christian Democratic Unity | 3,764 | 2.14% | 0 | 0 | 0 | |
| Communist Party of Sweden | 331 | 0.19% | 0 | 0 | 0 | |
| Other parties | 18 | 0.01% | 0 | 0 | 0 | |
| Valid Votes | 175,734 | 100.00% | 10 | 1 | 11 | |
| Invalid votes | 371 | 0.21% | ||||
| Total Polled | 176,105 | 91.84% | ||||
| Registered Electors | 191,761 | |||||
1973[]
Results of the 1973 general election held on 16 September 1973:[35][36]
| Party | Votes | % | Seats | |||
|---|---|---|---|---|---|---|
| Con. | Lev. | Tot. | ||||
| Swedish Social Democratic Party | 59,408 | 35.65% | 4 | 0 | 4 | |
| Centre Party | 55,981 | 33.59% | 3 | 1 | 4 | |
| Moderate Party | 24,442 | 14.67% | 2 | 0 | 2 | |
| People's Party | 16,630 | 9.98% | 1 | 0 | 1 | |
| Christian Democratic Unity | 5,040 | 3.02% | 0 | 0 | 0 | |
| Left Party – Communists | 4,804 | 2.88% | 0 | 0 | 0 | |
| Communist Party of Sweden | 211 | 0.13% | 0 | 0 | 0 | |
| Communist League Marxist–Leninists (the revolutionaries) | 130 | 0.08% | 0 | 0 | 0 | |
| Other parties | 8 | 0.00% | 0 | 0 | 0 | |
| Valid Votes | 166,654 | 100.00% | 10 | 1 | 11 | |
| Invalid votes | 166 | 0.10% | ||||
| Total Polled | 166,820 | 91.07% | ||||
| Registered Electors | 183,179 | |||||
1970[]
Results of the 1970 general election held on 20 September 1970:[37][38]
| Party | Votes | % | Seats | |||
|---|---|---|---|---|---|---|
| Con. | Lev. | Tot. | ||||
| Swedish Social Democratic Party | 57,686 | 35.91% | 4 | 0 | 4 | |
| Centre Party | 47,942 | 29.84% | 3 | 0 | 3 | |
| People's Party | 24,964 | 15.54% | 2 | 0 | 2 | |
| Moderate Party | 20,775 | 12.93% | 1 | 1 | 2 | |
| Christian Democratic Unity | 4,513 | 2.81% | 0 | 0 | 0 | |
| Left Party – Communists | 4,508 | 2.81% | 0 | 0 | 0 | |
| Communist League Marxists-Leninists | 258 | 0.16% | 0 | 0 | 0 | |
| Other parties | 1 | 0.00% | 0 | 0 | 0 | |
| Valid Votes | 160,647 | 100.00% | 10 | 1 | 11 | |
| Invalid votes | 157 | 0.10% | ||||
| Total Polled | 160,804 | 88.37% | ||||
| Registered Electors | 181,968 | |||||
References[]
- ^ "Population in the country, counties and municipalities on December 31, 2019 and population change in October–December 2019". Stockholm, Sweden: Statistics Sweden. Retrieved 9 December 2020.
- ^ "Members and parties". Stockholm, Sweden: Riksdag. Retrieved 9 December 2020.
- ^ "Valpresentationen 2018: Val till riksdagen - Röster - riksdagsvalkrets Västra Götalands läns östra" (in Swedish). Solna, Sweden: Election Authority. Retrieved 9 December 2020.
- ^ "Val till riksdagen 2018-09-09: Röster och mandat för partierna" (PDF) (in Swedish). Solna, Sweden: Election Authority. p. 11. Retrieved 17 July 2020.
- ^ "Valpresentationen 2018: Val till riksdagen - Personröster - riksdagsvalkrets Västra Götalands läns östra" (in Swedish). Solna, Sweden: Election Authority. Retrieved 9 December 2020.
- ^ "2014: Val till riksdagen - Röster - Västra Götalands läns östra län" (in Swedish). Solna, Sweden: Election Authority. Retrieved 9 December 2020.
- ^ "Val till riksdagen 2014-09-14: Röster och mandat för partierna" (PDF) (in Swedish). Solna, Sweden: Election Authority. p. 11. Retrieved 14 March 2020.
- ^ "2014: Val till riksdagen - Personröster - Västra Götalands läns östra" (in Swedish). Solna, Sweden: Election Authority. Retrieved 9 December 2020.
- ^ "2010: Val till riksdagen - Röster - Västra Götalands läns östra" (in Swedish). Solna, Sweden: Election Authority. Retrieved 9 December 2020.
- ^ Allmänna valen 2010: Del 1. - Riksdagen den 19 september 2010 (PDF) (in Swedish). Stockholm, Sweden: Statistics Sweden. 30 March 2011. p. 337. ISSN 1654-1006. Retrieved 6 April 2020.
- ^ Allmänna valen 2010: Del 1. - Riksdagen den 19 september 2010 (PDF) (in Swedish). Stockholm, Sweden: Statistics Sweden. 30 March 2011. pp. 369–370. ISSN 1654-1006. Retrieved 6 April 2020.
- ^ "Allmänna val 17 september 2006: Riksdagsvalkrets Västra Götalands läns östra" (in Swedish). Solna, Sweden: Election Authority. Retrieved 9 December 2020.
- ^ Allmänna valen 2006 Del 1. Riksdagen den 17 september 2006 (PDF) (in Swedish). Stockholm, Sweden: Statistics Sweden. 2007. p. 272. ISBN 978-91-618-1362-9. ISSN 1654-1006. Retrieved 6 April 2020.
- ^ Allmänna valen 2006 Del 1. Riksdagen den 17 september 2006 (PDF) (in Swedish). Stockholm, Sweden: Statistics Sweden. 2007. pp. 295–296. ISBN 978-91-618-1362-9. ISSN 1654-1006. Retrieved 6 April 2020.
- ^ "Västra Götalands läns östra - Riksdagsval" (in Swedish). Solna, Sweden: Election Authority. Retrieved 9 December 2020.
- ^ Allmänna valen 2002 Del 1. Riksdagen den 15 september 2002 (PDF) (in Swedish). Stockholm, Sweden: Statistics Sweden. 2003. p. 28. ISBN 978-91-618-1362-9. ISSN 1654-1006. Retrieved 6 April 2020.
- ^ Allmänna valen 2002 Del 1. Riksdagen den 15 september 2002 (PDF) (in Swedish). Stockholm, Sweden: Statistics Sweden. 2003. p. 282. ISBN 978-91-618-1362-9. ISSN 1654-1006. Retrieved 6 April 2020.
- ^ Allmänna valen 1998. Del 1, Riksdagen den 20 september 1998 (PDF) (in Swedish). Stockholm, Sweden: Statistics Sweden. 1999. p. 26. ISBN 91-618-1001-0. Retrieved 6 April 2020.
- ^ Allmänna valen 1998. Del 1, Riksdagen den 20 september 1998 (PDF) (in Swedish). Stockholm, Sweden: Statistics Sweden. 1999. p. 30. ISBN 91-618-1001-0. Retrieved 6 April 2020.
- ^ Allmänna valen 1998. Del 1, Riksdagen den 20 september 1998 (PDF) (in Swedish). Stockholm, Sweden: Statistics Sweden. 1999. p. 287. ISBN 91-618-1001-0. Retrieved 6 April 2020.
- ^ Allmänna valen 1994. Del 1, Riksdagsvalet den 18 september 1994 (PDF) (in Swedish). Stockholm, Sweden: Statistics Sweden. 1995. p. 30. ISBN 91-618-0748-6. ISSN 0347-8084. Retrieved 6 April 2020.
- ^ Allmänna valen 1994. Del 1, Riksdagsvalet den 18 september 1994 (PDF) (in Swedish). Stockholm, Sweden: Statistics Sweden. 1995. p. 34. ISBN 91-618-0748-6. ISSN 0347-8084. Retrieved 6 April 2020.
- ^ Allmänna valen 1991. Del 1, Riksdagsvalet den 15 september 1991 (PDF) (in Swedish). Stockholm, Sweden: Statistics Sweden. 1992. p. 16. ISBN 91-618-0508-4. ISSN 0347-8084. Retrieved 6 April 2020.
- ^ Allmänna valen 1991. Del 1, Riksdagsvalet den 15 september 1991 (PDF) (in Swedish). Stockholm, Sweden: Statistics Sweden. 1992. p. 20. ISBN 91-618-0508-4. ISSN 0347-8084. Retrieved 6 April 2020.
- ^ Allmänna valen 1988. Del 1, Riksdagsvalet den 18 september 1988 (PDF) (in Swedish). Stockholm, Sweden: Statistics Sweden. 1989. p. 17. ISBN 91-618-0298-0. ISSN 0347-8084. Retrieved 6 April 2020.
- ^ Allmänna valen 1988. Del 1, Riksdagsvalet den 18 september 1988 (PDF) (in Swedish). Stockholm, Sweden: Statistics Sweden. 1989. p. 21. ISBN 91-618-0298-0. ISSN 0347-8084. Retrieved 6 April 2020.
- ^ Allmänna valen 1985. Del 1, Riksdagsvalet den 15 september 1985 (PDF) (in Swedish). Stockholm, Sweden: Statistics Sweden. 1986. p. 19. ISBN 91-618-0107-0. ISSN 0347-8084. Retrieved 6 April 2020.
- ^ Allmänna valen 1985. Del 1, Riksdagsvalet den 15 september 1985 (PDF) (in Swedish). Stockholm, Sweden: Statistics Sweden. 1986. p. 23. ISBN 91-618-0107-0. ISSN 0347-8084. Retrieved 6 April 2020.
- ^ Allmänna valen 1982. Del 1, Riksdagsvalet den 19 september 1982 (PDF) (in Swedish). Stockholm, Sweden: Statistics Sweden. 1983. p. 18. ISBN 91-38-07261-0. ISSN 0347-8084. Retrieved 6 April 2020.
- ^ Allmänna valen 1982. Del 1, Riksdagsvalet den 19 september 1982 (PDF) (in Swedish). Stockholm, Sweden: Statistics Sweden. 1983. p. 23. ISBN 91-38-07261-0. ISSN 0347-8084. Retrieved 6 April 2020.
- ^ Allmänna valen 1979. Del 1, Riksdagsvalet den 16 september 1979 (PDF) (in Swedish). Stockholm, Sweden: Statistics Sweden. 1983. pp. 18–19. ISBN 91-38-05351-9. Retrieved 6 April 2020.
- ^ Allmänna valen 1979. Del 1, Riksdagsvalet den 16 september 1979 (PDF) (in Swedish). Stockholm, Sweden: Statistics Sweden. 1983. p. 23. ISBN 91-38-05351-9. Retrieved 6 April 2020.
- ^ Allmänna valen 1976. Del 1, Riksdagsvalet den 19 september 1976 (PDF) (in Swedish). Stockholm, Sweden: Statistics Sweden. 1977. pp. 12–13. ISBN 91-38-03530-8. Retrieved 6 April 2020.
- ^ Allmänna valen 1976. Del 1, Riksdagsvalet den 19 september 1976 (PDF) (in Swedish). Stockholm, Sweden: Statistics Sweden. 1977. p. 15. ISBN 91-38-03530-8. Retrieved 6 April 2020.
- ^ Allmänna valen 1973. Del 1, Riksdagsvalet den 26 september 1973 (PDF) (in Swedish). Stockholm, Sweden: Statistics Sweden. 1974. pp. 14–15. ISBN 91-38-01908-6. Retrieved 6 April 2020.
- ^ Allmänna valen 1973. Del 1, Riksdagsvalet den 26 september 1973 (PDF) (in Swedish). Stockholm, Sweden: Statistics Sweden. 1974. p. 17. ISBN 91-38-01908-6. Retrieved 6 April 2020.
- ^ Allmänna valen 1970. Del 1, Riksdagsvalet den 20 september 1970 (PDF) (in Swedish). Stockholm, Sweden: Statistics Sweden. 1971. pp. 14–15. Retrieved 6 April 2020.
- ^ Allmänna valen 1970. Del 1, Riksdagsvalet den 20 september 1970 (PDF) (in Swedish). Stockholm, Sweden: Statistics Sweden. 1971. p. 24. Retrieved 6 April 2020.
- Riksdag constituencies
- Riksdag constituencies established in 1970
- Västra Götaland County