European Union statistics
Statistics in the European Union are collected by Eurostat (European statistics body).
Area and population[]
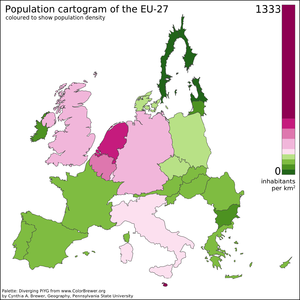
As of 1 January 2006, the population of the EU was about 493 million people, although in 2020 the EU lost over 10% of its population as a result of the UK leaving the bloc.[1] Many countries are expected to experience a decline in population over the coming decades,[2] though this could be offset with new countries planning to join the EU within the next 20 years. The most populous member state is Germany, with an estimated 80.4 million people. France and Ireland have the highest birth-rates.[3] The most densely populated country is the island of Malta, which is also the smallest, while the largest in area is France. The least densely populated country is Finland.
Population figures in the table below are from 2006 or 2007 estimates. The highest and lowest figures in each column have been marked in bold.
| Member State | Population in millions |
Population % of EU |
Area km2 |
Area % of EU |
Pop. density People/km2 |
|---|---|---|---|---|---|
| 494.8 | 100% | 4,422,773 | 100% | 112 | |
| 8.3 | 1.7% | 83,858 | 1.9% | 99 | |
| 10.5 | 2.1% | 30,510 | 0.7% | 344 | |
| 7.7 | 1.6% | 110,912 | 2.5% | 70 | |
| 4.3 | 0.9% | 56,594 | 1.3% | 75.8 | |
| 0.8 | 0.2% | 9,250 | 0.2% | 84 | |
| 10.3 | 2.1% | 78,866 | 1.8% | 131 | |
| 5.4 | 1.1% | 43,094 | 1.0% | 126 | |
| 1.3 | 0.3% | 45,226 | 1.0% | 29 | |
| 5.3 | 1.1% | 337,030 | 7.6% | 16 | |
| 65.03 | 13.% | 643,548 | 14.6% | 111 | |
| 80.4 | 16.6% | 357,021 | 8.1% | 225 | |
| 11.1 | 2.2% | 131,940 | 3.0% | 84 | |
| 10.1 | 2.0% | 93,030 | 2.1% | 108 | |
| 4.6 | 0.9% | 70,280 | 1.6% | 60 | |
| 58.8 | 11.9% | 301,320 | 6.8% | 195 | |
| 2.3 | 0.5% | 64,589 | 1.5% | 35 | |
| 3.4 | 0.7% | 65,200 | 1.5% | 45 | |
| 0.5 | 0.1% | 2,586 | 0.1% | 181 | |
| 0.5 | 0.1% | 316 | 0.0007% | 1,261 | |
| 17 | 3.3% | 41,526 | 0.9% | 394 | |
| 38.1 | 7.7% | 312,685 | 7.1% | 122 | |
| 10.6 | 2.1% | 92,931 | 2.1% | 114 | |
| 21.6 | 4.4% | 238,391 | 5.4% | 91 | |
| 44.7 | 9.0% | 504,782 | 11.4% | 87 | |
| 5.4 | 1.1% | 48,845 | 1.1% | 111 | |
| 2.0 | 0.4% | 20,253 | 0.5% | 99 | |
| 10 | 1.8% | 449,964 | 10.2% | 20 |
Economy[]
For statistics relating to economy, please see Economy of the European Union.
EU budget[]
The primary resource for funding the European Union is the contributions sought from member states. Each member state contributes to the EU budget, and receives funding back from the EU, depending on the relative wealth of the states, i.e. their ability to pay.
The table below shows the contributions as a percentage of the total budget. This takes into account the special considerations given to the United Kingdom to reduce its contribution through a rebate. Expenditure in Luxembourg, Belgium and France include items for the EU administrative centres in each of those countries.
| Member State | Total contribution in Euro |
Total contribution as % of total EU budget |
Total expenditure year 2006 in Euro |
Total expenditure as % of total EU budget |
Net contribution in Euro |
Net contribution in Euro per capita |
Total contribution in Euro per capita |
|---|---|---|---|---|---|---|---|
| 105,259,468,772 | 100.00% | 106,575,500,000 | 100.00% | -1,316,031,228 | -3 | 213 | |
| 22,218,438,941 | 21.11% | 12,242,400,000 | 11.49% | 9,976,038,941 | 124 | 276 | |
| 17,303,107,859 | 16.44% | 13,496,200,000 | 12.66% | 3,806,907,859 | 59 | 266 | |
| 14,359,479,157 | 13.64% | 10,922,300,000 | 10.25% | 3,437,179,157 | 58 | 244 | |
| 13,739,900,046 | 13.05% | 8,294,200,000 | 7.78% | 5,445,700,046 | 90 | 226 | |
| 8,957,286,488 | 8.51% | 12,883,000,000 | 12.09% | -3,925,713,512 | -88 | 200 | |
| 5,552,933,781 | 5.28% | 2,190,400,000 | 2.06% | 3,362,533,781 | 198 | 327 | |
| 4,035,286,807 | 3.83% | 5,625,100,000 | 5.28% | -1,589,813,193 | -151 | 384 | |
| 2,832,862,800 | 2.69% | 1,573,400,000 | 1.48% | 1,259,462,800 | 126 | 283 | |
| 2,308,432,030 | 2.19% | 1,830,100,000 | 1.72% | 478,332,030 | 58 | 278 | |
| 2,130,860,212 | 2.02% | 1,501,900,000 | 1.41% | 628,960,212 | 116 | 395 | |
| 2,099,087,114 | 1.99% | 5,305,600,000 | 4.98% | -3,206,512,886 | -84 | 55 | |
| 1,882,611,879 | 1.79% | 6,833,700,000 | 6.41% | -4,951,088,121 | -446 | 170 | |
| 1,544,832,284 | 1.47% | 1,280,400,000 | 1.20% | 264,432,284 | 50 | 291 | |
| 1,443,049,602 | 1.37% | 3,634,800,000 | 3.41% | -2,191,750,398 | -207 | 136 | |
| 1,341,281,313 | 1.27% | 2,461,800,000 | 2.31% | -1,120,518,687 | -244 | 292 | |
| 1,003,119,411 | 0.95% | 1,842,200,000 | 1.73% | -839,080,589 | -83 | 99 | |
| 932,392,859 | 0.89% | 1,330,000,000 | 1.25% | -397,607,141 | -39 | 91 | |
| 393,148,777 | 0.37% | 696,200,000 | 0.65% | -303,051,223 | -56 | 73 | |
| 299,993,572 | 0.29% | 406,000,000 | 0.38% | -106,006,428 | -53 | 150 | |
| 241,439,011 | 0.23% | 1,194,800,000 | 1.12% | -953,360,989 | -1,907 | 483 | |
| 221,997,405 | 0.21% | 799,800,000 | 0.75% | -577,802,595 | -170 | 65 | |
| 144,556,416 | 0.14% | 239,600,000 | 0.22% | -95,043,584 | -119 | 181 | |
| 115,205,431 | 0.11% | 402,600,000 | 0.24% | -287,394,569 | -125 | 50 | |
| 100,756,308 | 0.10% | 300,000,000 | 0.28% | -199,243,692 | -142 | 72 | |
| 57,409,269 | 0.05% | 157,000,000 | 0.14% | -99,590,731 | -249 | 144 | |
| 360,600,000 | 0.34% | -360,600,000 | -47 | ||||
| 693,100,000 | 0.65% | -693,100,000 | -32 |
[]
There are many indices available on issues such as corruption, development, and freedom. The rankings below include all EU member states, EU candidates (with the exception of Turkey, cause their accession negotiations have stalled since 2016) and EFTA countries.
Freedom of the press[]
|
|
Reporters sans frontières (Reporters Without Borders) conducts an annual survey on the freedom of the press and produces scores (not shown here) for each country, resulting in the Press Freedom Index. In 2019 and 2020, Finland was proclaimed as having the freest press in the European Union, and the second in the world behind Norway. Bulgaria was ranked as having the least free press in the European Union in 2019 and 2020.[5]
| Colour Codes |
|---|
| Good Situation |
| Satisfactory Situation |
| Noticeable problems |
| Difficult situation |
Economic freedom[]
|
|
An index of Economic Freedom is produced by the Wall Street Journal and the Heritage Foundation. It uses 50 different variables to compile the survey, in areas such as trade policy and government intervention.
A similar index produced by the World Economic Forum is its Global Competitiveness Index.
Source: 2020 Index of Economic Freedom.
| Colour Codes |
|---|
| Free |
| Mostly Free |
| Moderately Free |
| Moderately Unfree |
Perception of corruption[]
|
|
Transparency International is an international NGO publishing an annual Global Corruption Report indicating the perception of corruption around the world. The rankings of the table refer to the Corruption Perceptions Index 2019 [1]. A high ranking means low corruption.
Human development[]
|
|
| Colour Codes |
|---|
| Very High Human Development |
| High Human Development |
The Human Development Index is a measure produced by the United Nations which covers three aspects of human development:
- poverty (GDP per capita)
- education ( and )
- health (life expectancy)
The rankings of the table refer to the UNDP Human Development Report 2019 (2018 data). The UN lists all EU member states as countries with very high human development.
Ease of doing business[]
|
|
The Ease of Doing Business Index is created by the World Bank and based on the study of laws and regulations, with the input and verification by more than 3,500 government officials, lawyers, business consultants, accountants and other professionals who routinely advise on or administer legal and regulatory requirements.
The data in the table are from the 2020 report.[6]
| Colour Codes |
|---|
| Very Easy |
| Easy |
Legatum Prosperity Index[]
|
|
| Colour Codes |
|---|
| 75.00-85.00 |
| 65.00-75.00 |
| 55.00-65.00 |
| 55.00 or less |
The Legatum Prosperity Index is an annual ranking developed by the Legatum Institute, a division of the private investment firm Legatum. The ranking is based on a variety of factors including wealth, economic growth, education, health, personal well-being, and quality of life.
See also[]
- Enlargement of the European Union
- Largest cities of the European Union by population within city limits
- Hispanics and Latins in Europe
- List of European Union member states by population
- Largest urban areas of the European Union and Larger Urban Zones
- Organization for Security and Co-operation in Europe statistics
References[]
- ^ "Total Population as of 01.01.06 Archived 6 July 2007 at the Wayback Machine", EUROSTAT. Retrieved 12 November 2006.
- ^ "The EU's baby blues", BBC News, 27 March 2006. Retrieved 10 July 2006.
- ^ "France claims EU fertility crown ", BBC News, 16 January 2007. Retrieved 10 February 2007.
- ^ Figures for France include the four overseas departments (French Guiana, Guadeloupe, Martinique, Réunion) which are integral parts of the European Union, but do not include the overseas collectivities and territories, which are not part of the European Union. Figures for Metropolitan France proper are: population 63.6 million, area 551 695 km², and population density 113/km².
- ^ World Press Freedom Index 2019 and World Press Freedom Index 2020, Reporters Without Borders
- ^ http://www.doingbusiness.org/rankings/
External links[]
- Eurostat – Statistics Explained
- Health-EU Portal Health Statistics
- EU Budget Data[permanent dead link]
- European Union-related lists