Hardiness zone


A hardiness zone is a geographic area defined to encompass a certain range of climatic conditions relevant to plant growth and survival.
The original and most widely used system, developed by the United States Department of Agriculture (USDA) as a rough guide for landscaping and gardening, defines 13 zones by annual extreme minimum temperature. It has been adapted by and to other countries (such as Canada) in various forms.
Unless otherwise specified, "hardiness zone" or simply "zone" usually refers to the USDA scale. For example, a plant may be described as "hardy to zone 10": this means that the plant can withstand a minimum temperature of 30 °F (−1.1 °C) to 40 °F (4.4 °C).
Other hardiness rating schemes have been developed as well, such as the UK Royal Horticultural Society and US Sunset Western Garden Book systems.
United States hardiness zones (USDA scale)[]
The USDA system was originally developed to aid gardeners and landscapers in the United States.
State-by-state maps, along with an electronic system that allows finding the zone for a particular zip code, can be found at the USDA Agricultural Research Service (USDA-ARS) website.
In the United States, most of the warmer zones (zones 9, 10, and 11) are located in the deep southern half of the country and on the southern coastal margins. Higher zones can be found in Hawaii (up to 12) and Puerto Rico (up to 13). The southern middle portion of the mainland and central coastal areas are in the middle zones (zones 8, 7, and 6). The far northern portion on the central interior of the mainland have some of the coldest zones (zones 5, 4, and small area of zone 3) and often have much less consistent range of temperatures in winter due to being more continental, and thus the zone map has its limitations in these areas. Lower zones can be found in Alaska (down to 1). The low latitude and often stable weather in Florida, the Gulf Coast, and southern Arizona and California, are responsible for the rarity of episodes of severe cold relative to normal in those areas. The warmest zone in the 48 contiguous states is the Florida Keys (11b) and the coldest is in north-central Minnesota (3a). Hawaii has the warmest hardiness zone in the United States at 12b. Conversely, Fort Yukon, Alaska has the coldest hardiness zone for any city in the United States at 1a.
Definitions[]

| Zone | From | To | |
| 0 | a | < −65 °F (−53.9 °C) | |
| b | −65 °F (−53.9 °C) | −60 °F (−51.1 °C) | |
| 1 | a | −60 °F (−51.1 °C) | −55 °F (−48.3 °C) |
| b | −55 °F (−48.3 °C) | −50 °F (−45.6 °C) | |
| 2 | a | −50 °F (−45.6 °C) | −45 °F (−42.8 °C) |
| b | −45 °F (−42.8 °C) | −40 °F (−40 °C) | |
| 3 | a | −40 °F (−40 °C) | −35 °F (−37.2 °C) |
| b | −35 °F (−37.2 °C) | −30 °F (−34.4 °C) | |
| 4 | a | −30 °F (−34.4 °C) | −25 °F (−31.7 °C) |
| b | −25 °F (−31.7 °C) | −20 °F (−28.9 °C) | |
| 5 | a | −20 °F (−28.9 °C) | −15 °F (−26.1 °C) |
| b | −15 °F (−26.1 °C) | −10 °F (−23.3 °C) | |
| 6 | a | −10 °F (−23.3 °C) | −5 °F (−20.6 °C) |
| b | −5 °F (−20.6 °C) | 0 °F (−17.8 °C) | |
| 7 | a | 0 °F (−17.8 °C) | 5 °F (−15 °C) |
| b | 5 °F (−15 °C) | 10 °F (−12.2 °C) | |
| 8 | a | 10 °F (−12.2 °C) | 15 °F (−9.4 °C) |
| b | 15 °F (−9.4 °C) | 20 °F (−6.7 °C) | |
| 9 | a | 20 °F (−6.7 °C) | 25 °F (−3.9 °C) |
| b | 25 °F (−3.9 °C) | 30 °F (−1.1 °C) | |
| 10 | a | 30 °F (−1.1 °C) | +35 °F (1.7 °C) |
| b | +35 °F (1.7 °C) | +40 °F (4.4 °C) | |
| 11 | a | +40 °F (4.4 °C) | +45 °F (7.2 °C) |
| b | +45 °F (7.2 °C) | +50 °F (10 °C) | |
| 12 | a | +50 °F (10 °C) | +55 °F (12.8 °C) |
| b | +55 °F (12.8 °C) | 60 °F (15.6 °C) | |
| 13 | a | 60 °F (15.6 °C) | 65 °F (18.3 °C) |
| b | > 65 °F (18.3 °C) | ||
History[]
The first attempts to create a geographical hardiness zone system were undertaken by two researchers at the Arnold Arboretum in Boston: the first was published in 1927 by Alfred Rehder,[1] and the second by Donald Wyman in 1938.[2] The Arnold map was subsequently updated in 1951, 1967, and finally 1971, but eventually fell out of use completely.
The modern USDA system began at the US National Arboretum in Washington. The first map was issued in 1960, and revised in 1965. It used uniform 10-degree Fahrenheit ranges, and gradually became widespread among American gardeners.[3][4]
The USDA map was revised and reissued in 1990 with freshly available climate data, this time with 5-degree distinctions dividing each zone into new "a" and "b" subdivisions.
In 2003, the American Horticultural Society (AHS) produced a draft revised map, using temperature data collected from July 1986 to March 2002. The 2003 map placed many areas approximately a half-zone higher (warmer) than the USDA's 1990 map. Reviewers noted the map zones appeared to be closer to the original USDA 1960 map in its overall zone delineations. Their map purported to show finer detail, for example, reflecting urban heat islands by showing the downtown areas of several cities (e.g., Baltimore, Maryland; Washington, D.C. and Atlantic City, New Jersey) as a full zone warmer than outlying areas. The map excluded the detailed a/b half-zones introduced in the USDA's 1990 map, an omission widely criticized by horticulturists and gardeners due to the coarseness of the resulting map. The USDA rejected the AHS 2003 draft map and created its own map in an interactive computer format, which the American Horticultural Society now uses.[5]
In 2006, the Arbor Day Foundation released an update of U.S. hardiness zones, using mostly the same data as the AHS. It revised hardiness zones, reflecting generally warmer recent temperatures in many parts of the country, and appeared similar to the AHS 2003 draft. The Foundation also did away with the more detailed a/b half-zone delineations.[6]
In 2012 the USDA updated their plant hardiness map based on 1976–2005 weather data, using a longer period of data to smooth out year-to-year weather fluctuations.[7] Two new zones (12 and 13) were added to better define and improve information sharing on tropical and semitropical plants, they also appear on the maps of Hawaii and Puerto Rico. There is a very small spot east of San Juan, Puerto Rico that includes the airport in coastal Carolina, where the mean minimum is 67 degrees F (19 C), which is classified as hardiness Zone 13b, the highest category, with temperatures rarely below 65 °F (18 °C). The map has a higher resolution than previous ones, and is able to show local variations due to things such as elevation or large bodies of water. Many zone boundaries were changed as a result of the more recent data, as well as new mapping methods and additional information gathered. Many areas were a half zone warmer than the previous 1990 map.[8] The 2012 map was created digitally for the internet, and includes a ZIP Code zone finder and an interactive map.[9][10]
Selected U.S. cities[]
The USDA plant hardiness zones for selected U.S. cities as based on the 2012 map are the following:
| City | showZone |
|---|
Limitations[]
As the USDA system is based entirely on average annual extreme minimum temperature in an area, it is limited in its ability to describe the climatic conditions a gardener may have to account for in a particular area: there are many other factors that determine whether or not a given plant can survive in a given zone.
Zone information alone is often not adequate for predicting winter survival, since factors such as frost dates and frequency of snow cover can vary widely between regions. Even the extreme minimum itself may not be useful when comparing regions in widely different climate zones. As an extreme example, due to the Gulf stream most of the United Kingdom is in zones 8–9, while in the US, zones 8–9 include regions such as the subtropical coastal areas of the southeastern US and Mojave and Chihuahuan inland deserts, thus an American gardener in such an area may only have to plan for several nights of cold temperatures per year, while their British counterpart may have to plan for several months.
In addition, the zones do not incorporate any information about summer temperature or insolation; thus sites which may have the same mean winter minima, but markedly different summer temperatures, will be accorded the same hardiness zone. For example, zone 8 covers coastal, high latitude, cool summer locations like Seattle and London, as well as lower latitude, hot summer climates like Charleston and Madrid. Farmers, gardeners, and landscapers in the former two must plan for entirely different growing seasons from those in the latter. Coastal Ireland and central Florida are both Zone 10, but have radically different insolation and summer heat and humidity.
The hardiness scales do not take into account the reliability of snow cover in the colder zones. Snow acts as an insulator against extreme cold, protecting the root system of hibernating plants. If the snow cover is reliable, the actual temperature to which the roots are exposed will not be as low as the hardiness zone number would indicate. As an example, Quebec City in Canada is located in zone 4, but can rely on a significant snow cover every year, making it possible to cultivate plants normally rated for zones 5 or 6. But, in Montreal, located to the southwest in zone 5, it is sometimes difficult to cultivate plants adapted to the zone because of the unreliable snow cover.[citation needed]
Many plants may survive in a locality but will not flower if the day length is insufficient or if they require vernalization (a particular duration of low temperature).
There are many other climate parameters that a farmer, gardener, or landscaper may need to take into account as well, such as humidity, precipitation, storms, rainy-dry cycles or monsoons, and site considerations such as soil type, soil drainage and water retention, water table, tilt towards or away from the sun, natural or manmade protection from excessive sun, snow, frost, and wind, etc. The annual extreme minimum temperature is a useful indicator, but ultimately only one factor among many for plant growth and survival.[9][3][11]
Alternatives[]
An alternative means of describing plant hardiness is to use "indicator plants". In this method, common plants with known limits to their range are used.[citation needed]
Sunset publishes a series that breaks up climate zones more finely than the USDA zones, identifying 45 distinct zones in the US, incorporating ranges of temperatures in all seasons, precipitation, wind patterns, elevation, and length and structure of the growing season.[12]
In addition, the Köppen climate classification system can be used as a more general guide to growing conditions when considering large areas of the Earth's surface or attempting to make comparisons between different continents.[13] The Trewartha climate classification is often a good "real world" concept of climates and their relation to plants and their average growing conditions.[citation needed]
Australian hardiness zones[]
The USDA hardiness zones are not used in Australia. The Australian National Botanic Gardens have devised another system more in keeping with Australian conditions. The zones are defined by steps of 5 degrees Celsius, from −15–−10 °C for zone 1 to 15–20 °C for zone 7.[14] They are numerically about 6 lower than the USDA system. For example, Australian zone 3 is roughly equivalent to USDA zone 9. The higher Australian zone numbers had no US equivalents prior to the 2012 addition by USDA of zones 12 and 13.
The spread of weather stations may be insufficient and too many places with different climates are lumped together. Only 738 Australian stations have records of more than ten years (one station per 98,491 hectares or 243,380 acres), though more populated areas have relatively fewer hectares per station. Mount Isa has three climatic stations with more than a ten-year record. One is in zone 4a, one in zone 4b, and the other is in zone 5a. Sydney residents are split between zones 3a and 4b. Different locations in the same city are suitable for different plants.
Canadian hardiness zones[]
Climate variables that reflect the capacity and detriments to plant growth are used to develop an index that is mapped to Canada's Plant Hardiness Zones.[15] This index comes from a formula originally developed by Ouellet and Sherk in the mid-1960s.[16][17][18]
The formula used is: Y = -67.62 + 1.734X1 + 0.1868X2 + 69.77X3 + 1.256X4+ 0.006119X5 + 22.37X6 - 0.01832X7
where:
- Y = estimated index of suitability
- X1 = monthly mean of the daily minimum temperatures (°C) of the coldest month
- X2 = mean frost free period above 0 °C in days
- X3 = amount of rainfall (R) from June to November, inclusive, in terms of R/(R+a) where a=25.4 if R is in millimeters and a=1 if R is in inches
- X4 = monthly mean of the daily maximum temperatures (°C) of the warmest month
- X5 = winter factor expressed in terms of (0 °C – X1)Rjan where Rjan represents the rainfall in January expressed in mm
- X6 = mean maximum snow depth in terms of S/(S+a) where a=25.4 if S is in millimeters and a=1 if S is in inches
- X7 = maximum wind gust in (km/hr) in 30 years.
| City | Canadian Zone[15] | USDA Zone[15] |
|---|---|---|
| Calgary | 4a | 4a |
| Edmonton | 4a | 3b |
| Halifax | 6b | 6a |
| Montreal | 6a | 4b |
| Ottawa | 5b | 4b |
| Saskatoon | 3b | 3a |
| St. John's | 6a | 7a |
| Toronto | 7a | 5b |
| Vancouver | 8b | 8b |
| Winnipeg | 4a | 3b |
| Yellowknife | 0a | 2a |
For practical purposes, Canada has adopted the American hardiness zone classification system. The 1990 version of the USDA Plant Hardiness Zone Map included Canada and Mexico, but they were removed with the 2012 update to focus on the United States and Puerto Rico.[8] The Canadian government publishes both Canadian and USDA-style zone maps.[15]
European hardiness zones[]
Selected European cities[]
The table below provides USDA hardiness zone data for selected European cities:
| City | showZone |
|---|
Britain and Ireland[]
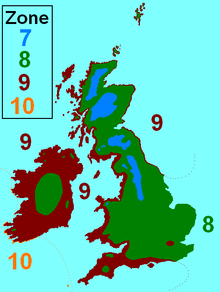
Owing to the moderating effect of the North Atlantic Current on the Irish and British temperate maritime climate, Britain, and Ireland even more so, have milder winters than their northerly position would otherwise afford. This means that the USDA hardiness zones relevant to Britain and Ireland are quite high, from 7 to 10, as shown below.[55]
- In Scotland the Grampians, Highlands and locally in the Southern Uplands; in England the Pennines; and in Wales the highest part of Snowdonia.
- Most of England, Wales and Scotland, parts of central Ireland, and Snaefell on the Isle of Man.
- Most of western and southern England and Wales, western Scotland, also a very narrow coastal fringe on the east coast of Scotland and northeast England (within 5 km (3.1 mi) of the North Sea), London, the West Midlands Urban Area, most of Ireland, and most of the Isle of Man.
- Very low-lying coastal areas of the southwest of Ireland and the Isles of Scilly.
USDA zones do not work particularly well in the UK as they are designed for a continental climate.[56] The cooler UK summers must be considered. New growth may be insufficient or fail to harden off affecting winter survival.[56]
In 2012 the United Kingdom's Royal Horticultural Society introduced new hardiness ratings for plants, from H7, the hardiest (tolerant of temperatures below −20 °C (−4 °F)) to H1a (needing temperatures above 15 °C (59 °F)).[57] The RHS hardiness ratings are based on absolute minimum winter temperatures (in °C) rather than the long-term average annual extreme minimum temperatures that define USDA zones.[57]
[]
Scandinavia lies at the same latitude as Alaska or Greenland, but the effect of the warm North Atlantic Current is even more pronounced here than it is in Britain and Ireland. Save for a very small spot near Karasjok, Norway, which is in zone 2, nowhere in the Arctic part of Scandinavia does it get below zone 3. The Faroe Islands, at 62–63°N are in zone 8, as are the outer Lofoten Islands at 68°N. Tromsø(, a coastal city in Norway at 70°N, is in zone 7, and even Longyearbyen, the northernmost true city in the world at 78°N, is still in zone 4. All these coastal locations have one thing in common, though, which are cool, damp summers, with temperatures rarely exceeding 20 °C (68 °F) (or 15 °C (59 °F) in Longyearbyen). This shows the importance of taking heat zones into account for better understanding of what may or may not grow.
In Sweden and Finland generally, at sea level to 500 metres (1,600 ft), zone 3 is north of the Arctic Circle, including cities like Karesuando and Pajala. Kiruna is the major exception here, which being located on a hill above , is in zone 5. Zone 4 lies between the Arctic Circle and about 64–66°N, with cities such as Oulu, Rovaniemi and Jokkmokk, zone 5 (south to 61–62°N) contains cities such as Tampere, Umeå, and Östersund. Zone 6 covers the south of mainland Finland, Sweden north of 60°N, and the high plateau of Småland further south. Here one will find cities such as Gävle, Örebro, Sundsvall, and Helsinki. The Åland Islands, as well as coastal southern Sweden, and the Stockholm area are in zone 7. The west coast of Sweden (Gothenburg and southwards) enjoys particularly mild winters and lies in zone 7, therefore being friendly to some hardy exotic species (found, for example, in the Gothenburg Botanical Garden), the southeast coast of Sweden has a colder winter due to the absence of the Gulf Stream.
Denmark is in zones 9a, 8b, and 8a.[58]
Estonia is divided to warmer West and North coast (Tallinn 6b, Haapsalu 7b, Kärdla 7a, Kuressaare 7a, Paide 6a, Rakvere 6a, Narva 6a, Viljandi 6b) and colder inland (Tartu 5a, Valga 5a, Võru 5a).
Latvia's capital Riga is in zone 6b. The country is in zones 5a, 5b, 6a, 6b, 7a and 7b.
Lithuania is in zones 5a, 5b, 6a, 6b, 7a and 7b.
Central Europe[]
This section does not cite any sources. (September 2020) |
Central Europe is a good example of a transition from an oceanic climate to a continental climate, which reflects in the tendency of the hardiness zones to decrease mainly eastwards instead of northwards. Also, the plateaus and low mountain ranges in this region have a significant impact on how cold it might get during winter. Generally speaking, the hardiness zones are high considering the latitude of the region, although not as high as Northern Europe with the Shetland Islands where zone 9 extends to over 60°N. In Central Europe, the relevant zones decrease from zone 8 on the Belgian, Dutch, and German North Sea coast, with the exception of some of the Frisian Islands (notably Vlieland and Terschelling), the island of Helgoland, and some of the islands in the Rhine-Scheldt estuary, which are in zone 9, to zone 5 around Suwałki, Podlachia on the far eastern border between Poland and Lithuania. Some isolated, high elevation areas of the Alps and Carpathians may even go down to zone 3 or 4. An extreme example of a cold sink is Funtensee, Bavaria which is at least in zone 3. Another notable example is Waksmund, a small village in the Polish Carpathians, which regularly reaches −35 °C (−31 °F) during winter on calm nights when cold and heavy airmasses from the surrounding Gorce and Tatra Mountains descend down the slopes to this low-lying valley, creating extremes which can be up to 10 °C (18 °F) colder than nearby Nowy Targ or Białka Tatrzańska, which are both higher up in elevation. Waksmund is in zone 3b while nearby Kraków, only 80 km (50 mi) to the north and 300 m (980 ft) lower is in zone 6a. These examples prove that local topography can have a pronounced effect on temperature and thus on what is possible to grow in a specific region.
Southern Europe[]
The southern European marker plant for climate as well as cultural indicator is the olive tree, which cannot withstand long periods below freezing so its cultivation area matches the cool winter zone. The Mediterranean Sea acts as a temperature regulator, so this area is generally warmer than other parts of the continent; except in mountainous areas where the sea effect lowers, it belongs in zones 8–10; however, southern Balkans (mountainous Western and Eastern Serbia, continental Croatia, and Bulgaria) are colder in winter and are in zones 6–7. The Croatian (Dalmatian) coast, Albania, and northern Greece are in zones 8–9, as are central-northern Italy (hills and some spots in Po Valley are however colder) and southern France; Central Iberia is 8–9 (some highland areas are slightly colder). The Spanish and Portuguese Atlantic coast, much of Andalusia and Murcia, coastal and slightly inland southern Valencian Community, a part of coastal Catalonia, the Balearic Islands, southwestern Sardinia, most of Sicily, coastal southern Italy, some areas around Albania,[59][60] coastal Cyprus and southwestern Greece are in zone 10. In Europe, the zone 11a is limited only to a few spots. In the Iberian Peninsula, it can be found on the southern coast, namely in populated Spanish areas such as the cities of Almería, Adra, Nerja, Málaga, Marbella and in a strip of coastal land between Tarifa and Punta Carnero in the province of Cádiz.[61] In Portugal, zone 11a can be found in a few unpopulated sites around the municipalities of Lagos and Vila do Bispo in the southwesternmost coastal strip of Portugal.[62] The Mediterranean islands of Malta, Lampedusa and Linosa belong to zone 11a as well as a few areas on the southernmost coast of Cyprus.[citation needed] The Balkan area is also more prone to cold snaps and episodes of unseasonable warmth. For instance, despite having similar daily means and temperature amplitudes to Nantucket, Massachusetts for each month, Sarajevo has recorded below-freezing temperatures in every month of the year. [63][64]
Macaronesia[]
Macaronesia consists of four archipelagos: The Azores, the Canary Islands, Cape Verde and Madeira. At lower altitudes and coastal areas, the Portuguese Azores and Madeira belong to zones 11a/11b and 11b/12a respectively. The Azores range from 9a to 11b and Madeira ranges from 9b to 12a, 9a and 9b found inland on the highest altitudes such as the Mount Pico in the Azores or Pico Ruivo in Madeira.[65] The Spanish Canary Islands are generally part of zones 11b/12a in lower altitudes and coastal areas, reaching up to 12b in the southernmost coastal parts of the islands of Tenerife and Gran Canaria. The Canary Islands hardiness zones range from 7a to 12b depending on the altitude, with the Teide peak being at 7a/7b for its very high altitude of 3,715 m (12,188 ft), being also the highest peak of Macaronesia.[61][66] The Cape Verde islands, inside the Tropics, have hardiness zones that range from 12 to 13 in the coastal areas, while the lowest hardiness zone is found in the island of Fogo, in the country's highest peak Pico do Fogo.[citation needed]
American Horticultural Society heat zones[]
In addition to the USDA Hardiness zones there are American Horticultural Society (AHS) heat zones.
The criterion is the average number of days per year when the temperature exceeds 30 °C (86 °F). The AHS Heat Zone Map for the US is available on the American Horticultural Society website.[67]
| Zone | From | To |
| 1 | < 1 | |
| 2 | 1 | 7 |
| 3 | 8 | 14 |
| 4 | 15 | 30 |
| 5 | 31 | 45 |
| 6 | 46 | 60 |
| 7 | 61 | 90 |
| 8 | 91 | 120 |
| 9 | 121 | 150 |
| 10 | 151 | 180 |
| 11 | 181 | 210 |
| 12 | >210 | |
South Africa[]
South Africa has five horticultural or climatic zones. The zones are defined by minimum temperature.[68]
Effects of climate change[]
The USDA map published in 2012 shows that most of the US has become a half zone (5 °F) hotter in winter compared to the 1990 release.[8] Research in 2016 suggests that USDA plant hardiness zones will shift even further northward under climate change.[69]
See also[]
- Agriculture
- Tropics
- Subtropics
- Gardening
- Hardiness (plants)
- Geographical zone
References[]
- ^ Fernald, M. L. (1927). Rehder, Alfred (ed.). "Rehder's Manual of Cultivated Trees and Shrubs". Rhodora. 29 (339): 48–51. JSTOR 23298457.
- ^ Wyman, Donald (1938). Hedges, Screens & Windbreaks: Their Uses, Selection and Care. McGraw-Hill.
- ^ Jump up to: a b "History of Plant Hardiness Zone Maps – The Rest of the Story". Plant Delights Nursery. Retrieved 2018-06-03.
- ^ Del Tredici, Peter (1990). "The New USDA Plant Hardiness Zone Map" (PDF). Arnoldia. 50 (3): 16–20 – via Harvard University.
- ^ "USDA Hardiness Zone Map". American Horticultural Society. Archived from the original on 8 December 2017. Retrieved 8 December 2017.
- ^ "New arborday.org Hardiness Zone Map reflects warmer climate : Latest hardiness zones, based on most current temperature data available, suggest up-to-date choices for best trees to plant". Archived from the original on 2007-12-28. Retrieved 2007-12-27.
- ^ "USDA Plant Hardiness Zone Map, 2012". Agricultural Research Service. U.S. Department of Agriculture. Archived from the original on 24 October 2017. Retrieved 7 December 2017.
- ^ Jump up to: a b c "What's New | USDA Plant Hardiness Zone Map". Agricultural Research Service. U.S. Department of Agriculture. Archived from the original on 19 October 2017. Retrieved 7 December 2017.
- ^ Jump up to: a b "About | USDA Plant Hardiness Zone Map". planthardiness.ars.usda.gov. Retrieved 2018-06-03.
- ^ "History of USDA Hardiness Zones". www.weekendgardener.net. Retrieved 2018-06-03.
- ^ McKenney, Daniel W.; Pedlar, John H.; Lawrence, Kevin; Campbell, Kathy; Hutchinson, Michael F. (2007-12-01). "Beyond Traditional Hardiness Zones: Using Climate Envelopes to Map Plant Range Limits". BioScience. 57 (11): 929–937. doi:10.1641/B571105. ISSN 1525-3244.
- ^ Sunset National Garden Book. Sunset Books Inc. Menlo Park, California (1997)
- ^ Köppen, Wladimir; Translated by Volken, E., and Brönninmann, S. "Die Wärmezonen der Erde, nach der Dauer der heissen, gemässigten und kalten Zeit und nach der Wirkung der Wärme auf die organische Welt betrachtet [The thermal zones of the Earth according to the duration of hot, moderate and cold periods and of the impact of heat on the organic world]" (PDF). World Maps of Köppen-Geiger Climate Classification. Meteorologische Zeitschrift, Vol. 20, No. 3, 351-360. Retrieved 24 September 2019.
- ^ Dawson, I. (1991). "Plant Hardiness Zones for Australia". Archived from the original on 2010-12-10. Retrieved 2010-11-11.
- ^ Jump up to: a b c d "Natural Resources Canada – Plant Hardiness of Canada". Natural Resources Canada – Plant Hardiness of Canada. Government of Canada. Archived from the original on 29 June 2006. Retrieved 7 April 2018.
- ^ Ouellet, C. E.; Sherk, L. C. (1967). "Woody Ornamental Plant Zonation: I. Indices of Winterhardiness". Canadian Journal of Plant Science. 47 (3): 231–238. doi:10.4141/cjps67-044. ISSN 0008-4220. pdf
- ^ Ouellet, C. E.; Sherk, L. C. (1967). "Woody Ornamental Plant Zonation: Ii. Suitability Indices of Localities". Canadian Journal of Plant Science. 47 (4): 339–349. doi:10.4141/cjps67-064. ISSN 0008-4220. pdf
- ^ Ouellet, C. E.; Sherk, L. C. (1967). "Woody Ornamental Plant Zonation: III. Suitability Map for the Probable Winter Survival of Ornamental Trees and Shrubs". Canadian Journal of Plant Science. 47 (4): 351–358. doi:10.4141/cjps67-065. ISSN 0008-4220. pdf
- ^ "Netherlands Interactive Plant Hardiness Zone Map". plantmaps.com. Retrieved 2021-05-31.
- ^ Jump up to: a b c d e "Spain Interactive Plant Hardiness Zone Map". plantmaps.com. Retrieved 2021-05-30.
- ^ "Serbia Interactive Plant Hardiness Zone Map". plantmaps.com. Retrieved 2021-05-30.
- ^ "Slovakia Interactive Plant Hardiness Zone Map". plantmaps.com. Retrieved 2021-05-30.
- ^ "Romania Interactive Plant Hardiness Zone Map". plantmaps.com. Retrieved 2021-05-30.
- ^ Jump up to: a b c d "Italy Interactive Plant Hardiness Zone Map". plantmaps.com. Retrieved 2021-05-30.
- ^ Jump up to: a b c d e f g h i j k "Plant Cold Hardiness Zone Map of the British Isles". www.trebrown.com. Retrieved 2021-05-30.
- ^ Jump up to: a b "Finland Interactive Plant Hardiness Zone Map". plantmaps.com. Retrieved 2021-05-30.
- ^ Jump up to: a b c d e f g "Russia Interactive Plant Hardiness Zone Map". plantmaps.com. Retrieved 2021-05-30.
- ^ Jump up to: a b c d e "Poland Interactive Plant Hardiness Zone Map". plantmaps.com. Retrieved 2021-05-30.
- ^ "Portugal Interactive Plant Hardiness Zone Map". plantmaps.com. Retrieved 2021-05-30.
- ^ "Slovenia Interactive Plant Hardiness Zone Map". plantmaps.com. Retrieved 2021-05-30.
- ^ Jump up to: a b c "France Interactive Plant Hardiness Zone Map". plantmaps.com. Retrieved 2021-05-30.
- ^ "Czech Republic Interactive Plant Hardiness Zone Map". plantmaps.com. Retrieved 2021-05-30.
- ^ "Latvia Interactive Plant Hardiness Zone Map". plantmaps.com. Retrieved 2021-05-30.
- ^ "Bosnia and Herzegovina Interactive Plant Hardiness Zone Map". plantmaps.com. Retrieved 2021-05-30.
- ^ "Page 3 : USDA ARS". www.ars.usda.gov. Retrieved 2021-05-30.
- ^ Jump up to: a b c "Sweden Interactive Plant Hardiness Zone Map". plantmaps.com. Retrieved 2021-05-30.
- ^ "Estonia Interactive Plant Hardiness Zone Map". plantmaps.com. Retrieved 2021-05-30.
- ^ Jump up to: a b c "Norway Interactive Plant Hardiness Zone Map". plantmaps.com. Retrieved 2021-05-30.
- ^ "Austria Interactive Plant Hardiness Zone Map". plantmaps.com. Retrieved 2021-05-30.
- ^ "Switzerland Interactive Plant Hardiness Zone Map". plantmaps.com. Retrieved 2021-05-30.
- ^ "Belgium Interactive Plant Hardiness Zone Map". plantmaps.com. Retrieved 2021-05-30.
- ^ Jump up to: a b c d "Wetter und Klima - Deutscher Wetterdienst - Climate Atlas". www.dwd.de. Retrieved 2021-05-30.
- ^ "Denmark Interactive Plant Hardiness Zone Map". plantmaps.com. Retrieved 2021-05-30.
- ^ "Portugal Interactive Plant Hardiness Zone Map". plantmaps.com. Retrieved 2021-05-30.
- ^ "Bitki Soğuğa ve Sıcağa Dayanıklılık". www.mgm.gov.tr. Retrieved 2021-05-30.
- ^ "Belarus Interactive Plant Hardiness Zone Map". plantmaps.com. Retrieved 2021-05-30.
- ^ "Cyprus Interactive Plant Hardiness Zone Map". plantmaps.com. Retrieved 2021-05-30.
- ^ "Portugal Interactive Plant Hardiness Zone Map". plantmaps.com. Retrieved 2021-05-30.
- ^ "Iceland Interactive Plant Hardiness Zone Map". plantmaps.com. Retrieved 2021-05-30.
- ^ "Bulgaria Interactive Plant Hardiness Zone Map". plantmaps.com. Retrieved 2021-05-30.
- ^ "Greek Plant Hardiness Zones". hardiness.inforest.gr. Retrieved 2021-05-30.
- ^ "Malta Interactive Plant Hardiness Zone Map". plantmaps.com. Retrieved 2021-05-30.
- ^ "Lithuania Interactive Plant Hardiness Zone Map". plantmaps.com. Retrieved 2021-05-30.
- ^ "Croatia Interactive Plant Hardiness Zone Map". plantmaps.com. Retrieved 2021-05-30.
- ^ "United Kingdom Plant Hardiness Zone Map". plantmaps.com.
- ^ Jump up to: a b Martin Crawford (2010). Creating a forest garden: working with nature to grow edible crops. Green Books. p. 13. ISBN 9781900322621.
- ^ Jump up to: a b "RHS hardiness rating". RHS hardiness rating. Royal Horticultural Society. Archived from the original on 25 September 2016. Retrieved 24 September 2016.
- ^ "Denmark Interactive Plant Hardiness Zone Map". www.plantmaps.com. Archived from the original on 11 October 2017. Retrieved 1 May 2018.
- ^ Teqja, Zydi. "Map of Albanian plant hardiness zones based on the WorldClim data for the 1950-2000 period". ResearchGate. Retrieved 16 February 2021.
- ^ Teqja, Zydi; Libohova, Zamir; Kopali, Albert; Naçi, Robert. "Climatic hardiness and heat zones of Albania and their use in evaluating the potential of introducing new plant species". ResearchGate. Retrieved 16 February 2021.
- ^ Jump up to: a b "LAS PLANTAS ORNAMENTALES Y SUS ZONAS DE RUSTICIDAD EN ESPAÑA" (PDF). José Manuel Sanchez de Lorenzo-Cáceres, Agricultural Engineer. 2004.
- ^ "Hardiness zones of Portugal" (PDF). Repositório Institucional da Universidade de Lisboa. pp. 60–62.
- ^ "MA Nantucket MEM AP". National Oceanic and Atmospheric Administration. Retrieved February 19, 2015.
- ^ "Weather and Climate: The Climate of Sarajevo" (in Russian). Weather and Climate (Погода и климат). Archived from the original on 16 May 2012. Retrieved 25 August 2016.
- ^ "Portugal Interactive Plant Hardiness Zone Map". plantmaps.com. Retrieved 23 June 2021.
- ^ "Spain Interactive Plant Hardiness Zone Map". plantmaps.com. Retrieved 24 June 2021.
- ^ "AHS Plant Heat Zone Map". American Horticultural Society. Archived from the original on 2017-05-16. Retrieved 2017-05-26.
- ^ PlantZAfrica 2016, Horticultural Zones
- ^ Parker, Lauren E.; Abatzoglou, John T. (2016). "Projected changes in cold hardiness zones and suitable overwinter ranges of perennial crops over the United States". Environmental Research Letters. 11 (3): 034001. doi:10.1088/1748-9326/11/3/034001. ISSN 1748-9326.
Bibliography[]
- "PlantZAfrica". SANBI. Retrieved 14 November 2016.
External links[]
This article's use of external links may not follow Wikipedia's policies or guidelines. (October 2012) |
- Agricultural terminology
- Horticulture and gardening
- Climate zones
- Geographic classifications