History of photovoltaic growth
This article needs to be updated. (October 2017) |
The history of photovoltaic growth includes previous forecast and annual deployment figures by country.
Deployment reports[]
Most PV deployment figures in this article are provided by the European Photovoltaic Industry Association in the "Global Outlook for Photovoltaics" report, the Observatoire des énergies renouvelables or EurObserv'ER's "Photovoltaic Barometer" report, and the IEA-PVPS (photovoltaic power systems) "Snapshot" and "Trends" report.

History of European PV deployment in watts per capita since 1992.
| <0.1, n/a 0.1–1 1–10 10–50 | 50–100 100–150 150–200 200–300 | 300–450 >450 |
show
List of reports - Global Market Outlook for Photovoltaics
- The European Photovoltaic Industry Association (EPIA) represents members of the entire PV industry from silicon producers to cells and module manufactures and PV systems installers to PV electricity generation as well as marketing and sales. EPIA releases its annual Global Market Outlook for Photovoltaics report in May/June.
- PV-Barometer
show
List of reports - Photovoltaic Barometer report
- EUROBSER'VER (Observatoire des énergies renouvelables) was set up in 1980, and is composed of engineers and experts releasing the Photovoltaic Barometer report containing early, year-end PV deployment figures for the 28 member states of the European Union.[14] Eurobserver works closely together with several French ministries and is co-founded by the European Commission's IEE programm.[15]
- IEA-PVPS
show
List of reports - PVPS Snapshot of Global PV and Trends
- The IEA Photovoltaic Power Systems Programme (PVPS) is one of the collaborative R&D agreements established within the IEA and, since its establishment in 1993, the PVPS participants have been conducting a variety of joint projects in the application of photovoltaic conversion of solar energy into electricity. Its annual "Snapshot" report is released in early April and provides the first and detailed figures of worldwide PV-deployment of the previous year. An overview of all international statistics PDF reports since 1995 can be found on IEA-PVPS' Statistic Reports website.
Deployment by country[]
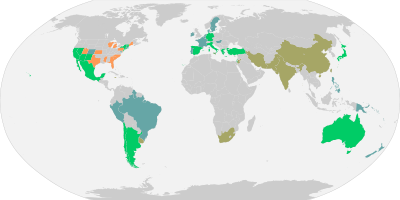
Grid parity for solar PV systems around the world
Reached grid-parity before 2014
Reached grid-parity after 2014
Reached grid-parity only for peak prices
U.S. states poised to reach grid-parity
Source: Deutsche Bank, as of February 2015
- 2015
- See section Forecast for projected photovoltaic deployment in 2015
- 2014
show
2014 – Year-end PV capacity by country in MW
- 2013
show
2013 – Year-end PV capacity by country in MW
- 2012
show
2012 – Year-end PV capacity by country in MW
- 2011
show
2011 – Year-end PV capacity by country in MW
- 2010
show
2010 – Year-end PV capacity by country in MW
- 2009
show
2009 – Year-end PV capacity by country in MW
- 2008
show
2008 – Year-end PV capacity by country in MW
- 2007
show
2007 – Year-end PV capacity by country in MW
- 2006
show
2006 – Year-end PV capacity by country in MW
- 2005
show
2005 – Year-end PV capacity by country in MW
- 2004
show
2004 – Year-end PV capacity by country in MW
Notes[]
- ^ Displayed figures are recalculated from AC to DC-figure in megawatt-peak (MWp). The AC-to-DC conversion increases figure on average by 15% (normally in the range of 5%–30%)
- ^ Percentage figures based on "IEA-PVPS Trends 2014" report. Worldwide PV installations of 39,953 MW corresponds to 100% in the pie-chart. See table "2013—Global PV Capacity by Country in MW" for absolute figures.
- ^ IEA-PVPS trends 2014 (see reference in footer), noted on page 33, that the country had 30 MW installed at the beginning of 2013. Cumulative of 122 MW comes from the difference in IEA-PVPS snapshot 2015 report.
- ^ Displayed data is EPIA's recalculated DC-figure in megawatt-peak (MWp). Capacity in the original data was reported in AC and amounts to 4,640 MW (cumulative) and 102 MW (installed), as per IEA-PVPS, Trends 2014, p. 34. The conversion results in a difference of approximately 15%. See cited reference.
References[]
- ^ Jump up to: a b c d e f g h i j "Global Market Outlook for Photovoltaics 2014-2018" (PDF). www.epia.org. EPIA – European Photovoltaic Industry Association. Archived from the original (PDF) on 12 June 2014. Retrieved 12 June 2014.
- ^ Jump up to: a b c "Global Market Outlook for Photovoltaics 2013–2017" (PDF). www.epia.org. EPIA – European Photovoltaic Industry Association. Archived from the original (PDF) on 6 November 2014. Retrieved 6 November 2014.
- ^ Jump up to: a b "Global Market Outlook for Photovoltaics until 2016" (PDF). www.epia.org. EPIA – European Photovoltaic Industry Association. Archived from the original (PDF) on 6 November 2014. Retrieved 6 November 2014.
- ^ "Global Market Outlook for Photovoltaics until 2015" (PDF). www.epia.org. EPIA – European Photovoltaic Industry Association. Archived from the original on 6 November 2014. Retrieved 6 November 2014.
- ^ "Global Market Outlook for Photovoltaics until 2014" (PDF). www.epia.org. EPIA – European Photovoltaic Industry Association. Archived from the original on 6 November 2014. Retrieved 6 November 2014.
- ^ "Global Market Outlook for Photovoltaics until 2013" (PDF). ec.europa.eu. EPIA – European Photovoltaic Industry Association. Archived (PDF) from the original on 6 November 2014. Retrieved 6 November 2014.
- ^ "Global Market Outlook for Photovoltaics until 2012" (PDF). www.epia.org/. EPIA – European Photovoltaic Industry Association. Archived (PDF) from the original on 2 April 2015. Retrieved 2 April 2015.
- ^ Jump up to: a b c EUROBSER'VER (April 2015). "Photovoltaic Barometer - installations 2013 and 2014" (PDF). www.energies-renouvelables.org. Archived from the original (PDF) on 6 May 2015.
- ^ Jump up to: a b c EUROBSER'VER. "Photovoltaic Barometer - installations 2012 and 2013" (PDF). www.energies-renouvelables.org. Archived from the original (PDF) on 10 September 2014. Retrieved 1 May 2014.
- ^ Jump up to: a b EUROBSER'VER. "Photovoltaic Barometer - installations 2011 and 2012" (PDF). www.energies-renouvelables.org. p. 7. Archived from the original (PDF) on 16 June 2014. Retrieved 1 May 2013.
- ^ Jump up to: a b c EUROBSER'VER. "Photovoltaic Barometer - installations 2010 and 2011" (PDF). www.energies-renouvelables.org. p. 6. Archived from the original (PDF) on 16 June 2014. Retrieved 1 May 2013.
- ^ Jump up to: a b EUROBSER'VER. "Photovoltaic Barometer - installations 2009 and 2010" (PDF). www.energies-renouvelables.org. p. 4. Archived from the original (PDF) on 16 June 2014. Retrieved 1 May 2013.
- ^ EUROBSER'VER. "Photovoltaic Barometer - installations 2008 and 2009" (PDF). www.energies-renouvelables.org. p. 5. Archived from the original (PDF) on 16 June 2014. Retrieved 1 May 2013.
- ^ eurobserv-er.org EUROBSER'VER - Observatoire des énergies renouvelables Archived 2014-08-29 at the Wayback Machine
- ^ ec.europa.eu European Commission Energy Intelligent Energy Europe
- ^ Jump up to: a b c d e f g "Snapshot of Global PV 1992-2014" (PDF). www.iea-pvps.org/index.php?id=32. International Energy Agency — Photovoltaic Power Systems Programme. 30 March 2015. Archived from the original on 30 March 2015. Retrieved 8 March 2017.
- ^ Jump up to: a b c d e f g h "IEA PVPS TRENDS 2014 in Photovoltaic Applications" (PDF). www.iea-pvps.org/index.php?id=trends. 12 October 2014. Archived (PDF) from the original on 2 December 2014.
- ^ Jump up to: a b c d "Snapshot of Global PV 1992-2013" (PDF). www.iea-pvps.org/index.php?id=trends0. International Energy Agency — Photovoltaic Power Systems Programme. 31 March 2014. Archived (PDF) from the original on 5 April 2014.
- ^ Jump up to: a b "IEA PVPS TRENDS 2013 in Photovoltaic Applications" (PDF). www.iea-pvps.org/index.php?id=92. 29 November 2013. Archived (PDF) from the original on 17 March 2015.
- ^ Jump up to: a b "Snapshot of Global PV 1992-2012" (PDF). www.iea-pvps.org. International Energy Agency - Photovoltaic Power Systems Programme. 2013. Archived (PDF) from the original on 1 December 2014.
- ^ Jump up to: a b "TRENDS IN PHOTOVOLTAIC APPLICATIONS – Survey report of selected IEA countries between 1992 and 2010". www.iea-pvps.org/. International Energy Agency - Photovoltaic Power Systems Programme. 2011. Retrieved 28 December 2014.
- ^ Jump up to: a b "TRENDS IN PHOTOVOLTAIC APPLICATIONS – Survey report of selected IEA countries between 1992 and 2009". www.iea-pvps.org/. International Energy Agency - Photovoltaic Power Systems Programme. 2010. Retrieved 28 December 2014.
- ^ Jump up to: a b "TRENDS IN PHOTOVOLTAIC APPLICATIONS – Survey report of selected IEA countries between 1992 and 2008". www.iea-pvps.org/. International Energy Agency - Photovoltaic Power Systems Programme. 2009. Retrieved 28 December 2014.
- ^ Jump up to: a b c d "Trends in Photovoltaic Applications – Survey report of selected IEA countries between 1992 and 2006" (PDF). August 2007. Archived (PDF) from the original on 1 May 2015. Retrieved 30 April 2015.
- ^ Jump up to: a b c "Latin America Country Markets 2014-2015E". GTM Research. 10 May 2015.
- ^ IEA-PVPS, Annual Report 2014 (AR2014), pp. 38–110, 21 May 2015
- ^ "Global Market Outlook for Solar Power 2015-2019" (PDF). www.solarpowereurope.org. Solar Power Europe (SPE), formerly known as EPIA – European Photovoltaic Industry Association. Archived from the original (PDF) on 9 June 2015. Retrieved 9 June 2015.
- ^ Centro de Energías Renovables, CORFO (July 2014). "Reporte CER". Archived from the original on 6 July 2014. Retrieved 22 July 2014.
- ^ Trends Preview 2011
- ^ Jump up to: a b "FRB: G.5A Release--Foreign Exchange Rates--Release Dates". federalreserve.gov. Retrieved 27 January 2016.
- ^ Jump up to: a b iea-pvps.org PV Power (2007-June) Archived 2009-01-24 at the Wayback Machine
- ^ Jump up to: a b c d e f g h i j k l m n o p q r s t u EurObserv'ER (April 2007). "EurObserv'ER – Photovoltaic Energy Barometer" (PDF). Le Journal des Énergies Renouvelables (178): 49–70. Archived from the original (PDF) on 27 September 2007. Retrieved 7 September 2007.
- ^ Jump up to: a b c Dr. Wissing, Lothar; Jülich, Forschungszentrum; Jülich, Projektträger (May 2007). "National Survey Report of PV Power Applications in Germany 2006 – Version 2" (PDF). PVPS Programme NSRS for Germany. Archived from the original (PDF) on 28 May 2008. Retrieved 20 October 2007.
- ^ Jump up to: a b Ikki, Osamu; Matsubara, Koji (25 May 2007). "National Survey Report of PV Power Applications in Japan 2006" (PDF). PVPS Programme NSRS for Japan. Archived from the original (PDF) on 28 May 2008. Retrieved 20 October 2007.
- ^ Jump up to: a b Pedigo, Susannah; Maycock, Paul D.; Bower, Ward (30 August 2007). "National Survey Report of PV Power Applications in The United States of America 2006 – Version 14" (PDF). PVPS Programme NSRS for the USA. Archived from the original (PDF) on 28 May 2008. Retrieved 20 October 2007.
- ^ Jump up to: a b Guastella, Salvatore; Castello, Salvatore; Anna De Lillo (May 2007). "National Survey Report of PV Power Applications in Italy 2006" (PDF). PVPS Programme NSRS for Italy. Archived from the original (PDF) on 28 May 2008. Retrieved 20 October 2007.
- ^ Jump up to: a b Watt, Muriel (May 2007). "National Survey Report of PV Power Applications in Australia 2006" (PDF). PVPS Programme NSRS for Australia. Archived from the original (PDF) on 28 May 2008. Retrieved 16 October 2007.
- ^ Jump up to: a b Yoon, Kyung-Hoon; Kim, Donghwan; Yoon, Kyung Shick (May 2007). "National Survey Report of PV Power Applications in Korea 2006" (PDF). PVPS Programme NSRS for the Republic of Korea. Archived from the original (PDF) on 28 May 2008. Retrieved 20 October 2007.
- ^ Claverie, André; Equer, Bernard (15 July 2007). "Solar Photovoltaic Electricity Applications in France National Survey Report 2006" (PDF). www.iea-pvps.org. Archived from the original (PDF) on 2008-06-25. Retrieved 13 March 2008.
- ^ Jump up to: a b Swens, Job (May 2007). "National Survey Report of PV Power Applications in The Netherlands 2006" (PDF). PVPS Programme NSRS for the Netherlands. Archived from the original (PDF) on 28 May 2008. Retrieved 20 October 2007.
- ^ Jump up to: a b Hüsser, Pius; Hostettler, Thomas (2006). "National Survey Report on PV Power Applications in Switzerland 2006" (PDF). IEA-PVPS International Energy Agency. Archived from the original on 22 July 2014. Retrieved 22 July 2014.
- ^ Jump up to: a b Ayoub, Josef; Martel, Sylvain; Dr Dignard-Bailey, Lisa (May 2007). "National Survey Report of PV Power Applications in Canada 2006" (PDF). PVPS Programme NSRS for Canada. Archived from the original (PDF) on 25 June 2008. Retrieved 16 October 2007.
- ^ Jump up to: a b Davidson, Sarah (October 2007). "National Survey Report of PV Power Applications in the United Kingdom 2006" (PDF). PVPS Programme NSRS for the United Kingdom. Archived from the original (PDF) on 25 June 2008. Retrieved 16 March 2008.
- ^ Jump up to: a b Bugge, Lars; Salvesen, Fritjof (30 May 2007). "National Survey Report of PV Power Applications in Norway 2006" (PDF). PVPS Programme NSRS for Norway. Archived from the original (PDF) on 25 June 2008. Retrieved 20 October 2007.
- ^ Jump up to: a b Malm, Ulf; Stolt, Lars (May 2007). "National Survey Report of PV Power Applications in Sweden 2006" (PDF). PVPS Programme NSRS for Sweden. Archived from the original (PDF) on 25 June 2008. Retrieved 20 October 2007.
- ^ Jump up to: a b Ahm, Peter (May 2007). "National Survey Report of PV Power Applications in Denmark 2006 – Version 04" (PDF). PVPS Programme NSRS for Denmark. Archived from the original (PDF) on 25 June 2008. Retrieved 20 October 2007.
- ^ Jump up to: a b Dr. Siderer, Yona; Dann, Roxana (May 2007). "National Survey Report of PV Power Applications in Israel 2006 – Version 14" (PDF). PVPS Programme NSRS for Israel. Archived from the original (PDF) on 25 June 2008. Retrieved 20 October 2007.
- ^ Blakers, Andrew W. (2000). "Solar and Wind Electricity in Australia" (PDF). Australian Journal of Environmental Management. 7 (4): 223–236. doi:10.1080/14486563.2000.10648504. hdl:1885/40851. S2CID 154340569. Archived from the original (– Scholar search) on 31 August 2007. Retrieved 14 February 2008.
- ^ Prometheus Institute, Preliminary Data Hearsay Reference (April 2007). "Eco-Economy Indicators: SOLAR POWER – Data – 23rd Annual Data Collection – Final". PVNews. 26 (4): 8–9. Archived from the original on 7 February 2009. Retrieved 14 April 2008.
- ^ Gulabrai, Lalchand; Ruoss, Daniel; Chen, Wei-nee; Ir Ahmad Hadri Haris (April 2007). "National Survey Report of PV Power Applications in Malaysia 2006 – Version 14" (PDF). www.iea-pvps.org/index.html PVPS Programme – NSRs for Malaysia]. Archived from the original (PDF) on 25 June 2008. Retrieved 20 October 2007.
- ^ "Total photovoltaic power installed in IEA PVPS countries". Archived from the original on 2006-07-11. Retrieved 24 July 2007.
- ^ "Table 1: Installed PV power in reporting IEA PVPS countries as of the end of 2005". iea-pvps.org. Archived from the original on 2006-10-07.
- ^ Total photovoltaic power installed in IEA PVPS countries Archived 2007-02-08 at the Wayback Machine
Categories:
- Photovoltaics