Jing'an County
Jing'an County
靖安县 Tsingan | |
|---|---|
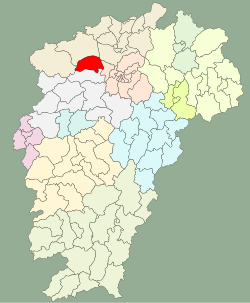 Location in Jiangxi | |
| Coordinates: 28°57′N 115°14′E / 28.950°N 115.233°ECoordinates: 28°57′N 115°14′E / 28.950°N 115.233°E | |
| Country | People's Republic of China |
| Province | Jiangxi |
| Prefecture-level city | Yichun |
| Time zone | UTC+8 (China Standard) |

Jing'an County (simplified Chinese: 靖安县; traditional Chinese: 靖安縣; pinyin: Jìng'ān Xiàn) is a county in the northwest of Jiangxi province, People's Republic of China. It is under the jurisdiction of the prefecture-level city of Yichun.
Administrative divisions[]
,Jing'an County has 5 towns and 6 townships.[1]
- 5 towns
|
|
- 6 townships
|
|
Demographics[]
The population of the district was 137,407 in 1999.[2]
Climate[]
| showClimate data for Jing'an (1981−2010) |
|---|
Notes and references[]
- ^ "南京市-行政区划网 www.xzqh.org" (in Chinese). XZQH. Retrieved 2012-05-24.
- ^ (in English) National Population Statistics Materials by County and City - 1999 Period, in China County & City Population 1999, Harvard China Historical GIS
- ^ 中国地面气候标准值月值(1981-2010) (in Chinese). China Meteorological Data Service Center. Retrieved 10 October 2019.
External links[]
- (in Chinese) Government site - Google translation
| show Authority control |
|---|
This Jiangxi location article is a stub. You can help Wikipedia by . |
Categories:
- Jing'an County
- County-level divisions of Jiangxi
- Jiangxi geography stubs