Killeen–Temple–Fort Hood metropolitan area
Killeen–Temple–Fort Hood | |
|---|---|
Metropolitan Statistical Area | |
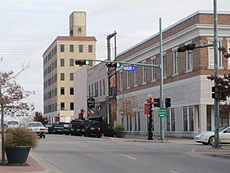 Downtown Temple at Main Street, Temple | |
 Map of Texas highlighting the Killeen-Temple-Fort Hood Metropolitan Area. | |
| Country | |
| State | |
| Principal cities | |
| Area | |
| • Total | 2,815.93 sq mi (7,293.2 km2) |
| Population (2019)[1] | |
| • Total | 475,367(120th) |
| • Density | 168/sq mi (65/km2) |
| Time zone | UTC-6 (CST) |
| • Summer (DST) | UTC-5 (CDT) |
Killeen–Temple–Fort Hood is a metropolitan statistical area in Central Texas that covers three counties: Bell, Coryell, and Lampasas. As of the 2020 Census, the MSA had a population of 475,367.[2]
Referring to the Dallas–Fort Worth metroplex in North Texas, locals sometimes refer to this area as the Centroplex.[citation needed]
Counties[]
Communities[]
Places with more than 75,000 people[]
Places with 20,000 to 75,000 people[]
- Copperas Cove
- Harker Heights
- Belton
- Fort Hood
Places with 1,000 to 20,000 people[]
Places with less than 1,000 people[]
Unincorporated places[]
Demographics[]
| Historical populations | |||
|---|---|---|---|
| Census | Pop. | %± | |
| 1960 | 118,058 | — | |
| 1970 | 159,794 | 35.4% | |
| 1980 | 214,656 | 34.3% | |
| 1990 | 255,301 | 18.9% | |
| 2000 | 330,714 | 29.5% | |
| 2010 | 405,300 | 22.6% | |
| 2020 | 475,367 | 17.3% | |
As of the census[3] of 2000, there were 330,714 people, 112,111 households, and 82,648 families residing within the MSA. The racial makeup of the MSA was 65.09% White, 19.81% African American, 0.76% Native American, 2.28% Asian, 0.46% Pacific Islander, 7.91% from other races, and 3.69% from two or more races. Hispanic or Latino of any race were 15.66% of the population.
The median income for a household in the MSA was $36,349 and the median income for a family was $40,386. Males had a median income of $27,529 versus $21,396 for females. The per capita income for the MSA was $16,271.
See also[]
- List of cities in Texas
- Texas census statistical areas
- List of Texas metropolitan areas
- Texas Triangle
References[]
- ^ "Table 1. Annual Estimates of the Population of Metropolitan and Micropolitan Statistical Areas: April 1, 2010 to July 1, 2012". 2012 Population Estimates. United States Census Bureau, Population Division. Archived from the original on July 22, 2014. Retrieved 2014-03-15.
- ^ Estimates of Resident Population Change and Rankings for Metropolitan Statistical Areas in the United States and Puerto Rico: July 1, 2018 to July 1, 2019 (CBSA-MET-EST2019-ANNCHG) Source: U.S. Census Bureau, Population Division Release Date: March 2020
- ^ "U.S. Census website". United States Census Bureau. Retrieved 2008-01-31.

- Killeen–Temple–Fort Hood metropolitan area
- Geography of Bell County, Texas
- Geography of Coryell County, Texas
- Geography of Lampasas County, Texas