List of municipalities in Mississippi
Mississippi is a state in the Southern United States. According to the 2010 United States Census, Mississippi is the 32nd-most populous state, with 2,968,103 inhabitants and the 31st largest by land area, spanning 46,923.27 square miles (121,530.7 km2) of land.[1] Mississippi is divided into 82 counties and contains 299 incorporated municipalities, consisting of cities, towns, and villages.[2][3] Mississippi's municipalities cover 4.3% of the state's land mass and are home to 50.5% of its population.[1]
Municipalities in Mississippi are classified according to population size. At time of incorporation, municipalities with populations of more than 2,000 are classified as cities, municipalities containing between 301 and 2000 persons are classified as towns, and municipalities between 100 and 300 persons are classified as villages.[3] Places may be incorporated to become a city, town, or village through a petition signed by two-thirds of the qualified voters who reside in the proposed municipality.[3] The major function of municipal governments are to provide services for its citizens such as maintaining roads and bridges, providing law, fire protection, and health and sanitation services.[3]
As of the 2010 United States Census, the largest municipality by population in Mississippi is Jackson, with 173,514 residents, and the smallest is Satartia, with 55 residents.[1] The largest municipality by land area is Jackson, which spans 111.05 sq mi (287.6 km2), while Sidon is the smallest, at 0.12 sq mi (0.31 km2).[1] The city of Natchez is the oldest municipality in Mississippi, incorporated on March 10, 1803, and the city of Diamondhead is the state's newest municipality, incorporated on January 30, 2012.[3]
List of municipalities[]
- Largest cities, towns, and villages in Mississippi by population

Downtown Jackson, the capital and largest city by population in Mississippi

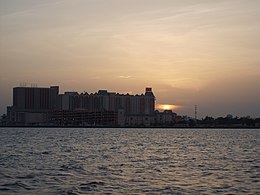
Gulfport, the second largest city by population in Mississippi

Southaven, suburb of Memphis, Tennessee and third largest city in Mississippi by population

Hattiesburg, Mississippi's fourth largest city by population
Biloxi, Mississippi's fifth largest city by population

Downtown Meridian, the sixth largest city in Mississippi by population


| Name | Type[1] | County[1] | Population (2010)[1] |
Population (2000)[1] |
Change | Land area (2010)[1] |
Population density | Incorporation date[3] | |
|---|---|---|---|---|---|---|---|---|---|
| sq mi | km2 | ||||||||
| Abbeville | Town | Lafayette | 419 | 423 | −0.9% | 3.46 | 9.0 | 121.1/sq mi (46.8/km2) | June 24, 1870 |
| Aberdeen |
City | Monroe | 5,612 | 6,415 | −12.5% | 12.09 | 31.3 | 464.2/sq mi (179.2/km2) | May 12, 1837 |
| Ackerman |
Town | Choctaw | 1,510 | 1,696 | −11.0% | 2.25 | 5.8 | 671.1/sq mi (259.1/km2) | February 16, 1884 |
| Algoma | Town | Pontotoc | 590 | 508 | +16.1% | 6.60 | 17.1 | 89.4/sq mi (34.5/km2) | September 14, 1987 |
| Alligator | Town | Bolivar | 208 | 220 | −5.5% | 0.99 | 2.6 | 210.1/sq mi (81.1/km2) | July 9, 1927 |
| Amory | City | Monroe | 7,316 | 6,956 | +5.2% | 12.54 | 32.5 | 583.4/sq mi (225.3/km2) | February 7, 1888 |
| Anguilla | Town | Sharkey | 726 | 907 | −20.0% | 1.03 | 2.7 | 704.9/sq mi (272.1/km2) | October 4, 1913 |
| Arcola | Town | Washington | 361 | 563 | −35.9% | 0.22 | 0.57 | 1,640.9/sq mi (633.6/km2) | September 30, 1904 |
| Artesia | Town | Lowndes | 440 | 498 | −11.6% | 0.73 | 1.9 | 602.7/sq mi (232.7/km2) | February 5, 1875 |
| Ashland |
Town | Benton | 569 | 577 | −1.4% | 1.82 | 4.7 | 312.6/sq mi (120.7/km2) | March 8, 1871 |
| Baldwyn | City | Lee, Prentiss | 3,297 | 3,321 | −0.7% | 11.59 | 30.0 | 284.5/sq mi (109.8/km2) | April 1, 1861 |
| Bassfield | Town | Jefferson Davis | 254 | 315 | −19.4% | 1.09 | 2.8 | 233.0/sq mi (90.0/km2) | October 6, 1903 |
| Batesville |
City | Panola | 7,463 | 7,113 | +4.9% | 19.95 | 51.7 | 374.1/sq mi (144.4/km2) | August 10, 1860 |
| Bay St. Louis |
City | Hancock | 9,260 | 8,209 | +12.8% | 14.69 | 38.0 | 630.4/sq mi (243.4/km2) | March 10, 1904 |
| Bay Springs |
City | Jasper | 1,786 | 2,097 | −14.8% | 14.94 | 38.7 | 119.5/sq mi (46.2/km2) | February 22, 1882 |
| Beaumont | Town | Perry | 951 | 977 | −2.7% | 3.45 | 8.9 | 275.7/sq mi (106.4/km2) | August 5, 1955 |
| Beauregard | Village | Copiah | 326 | 265 | +23.0% | 0.92 | 2.4 | 354.3/sq mi (136.8/km2) | November 21, 1865 |
| Belmont | Town | Tishomingo | 2,021 | 1,961 | +3.1% | 4.65 | 12.0 | 434.6/sq mi (167.8/km2) | January 22, 1908 |
| Belzoni |
City | Humphreys | 2,235 | 2,663 | −16.1% | 1.02 | 2.6 | 2,191.2/sq mi (846.0/km2) | March 12, 1895 |
| Benoit | Town | Bolivar | 477 | 611 | −21.9% | 0.97 | 2.5 | 491.8/sq mi (189.9/km2) | February 19, 1890 |
| Bentonia | Town | Yazoo | 440 | 500 | −12.0% | 1.42 | 3.7 | 309.9/sq mi (119.6/km2) | March 14, 1884 |
| Beulah | Town | Bolivar | 348 | 473 | −26.4% | 0.46 | 1.2 | 756.5/sq mi (292.1/km2) | March 7, 1882 |
| Big Creek | Village | Calhoun | 154 | 127 | +21.3% | 1.14 | 3.0 | 135.1/sq mi (52.2/km2) | July 13, 1905 |
| Biloxi |
City | Harrison | 44,054 | 50,644 | −13.0% | 38.22 | 99.0 | 1,152.6/sq mi (445.0/km2) | March 13, 1907 |
| Blue Mountain | Town | Tippah | 920 | 670 | +37.3% | 1.64 | 4.2 | 561.0/sq mi (216.6/km2) | February 8, 1838 |
| Blue Springs | Village | Union | 228 | 144 | +58.3% | 1.02 | 2.6 | 223.5/sq mi (86.3/km2) | January 31, 1877 |
| Bolton | Town | Hinds | 567 | 629 | −9.9% | 1.52 | 3.9 | 373.0/sq mi (144.0/km2) | March 15, 1888 |
| Booneville |
City | Prentiss | 8,743 | 8,625 | +1.4% | 25.75 | 66.7 | 339.5/sq mi (131.1/km2) | May 8, 1871 |
| Boyle | Town | Bolivar | 650 | 720 | −9.7% | 1.40 | 3.6 | 464.3/sq mi (179.3/km2) | December 12, 1861 |
| Brandon |
City | Rankin | 21,705 | 16,436 | +32.1% | 25.91 | 67.1 | 837.7/sq mi (323.4/km2) | August 5, 1895 |
| Braxton | Village | Simpson | 183 | 181 | +1.1% | 0.59 | 1.5 | 310.2/sq mi (119.8/km2) | December 19, 1831 |
| Brookhaven |
City | Lincoln | 12,513 | 9,861 | +26.9% | 21.64 | 56.0 | 578.2/sq mi (223.3/km2) | December 9, 1901 |
| Brooksville | Town | Noxubee | 1,223 | 1,182 | +3.5% | 1.59 | 4.1 | 769.2/sq mi (297.0/km2) | November 15, 1858 |
| Bruce | Town | Calhoun | 1,939 | 2,097 | −7.5% | 2.44 | 6.3 | 794.7/sq mi (306.8/km2) | February 7, 1860 |
| Bude | Town | Franklin | 1,063 | 1,037 | +2.5% | 1.43 | 3.7 | 743.4/sq mi (287.0/km2) | June 16, 1927 |
| Burnsville | Town | Tishomingo | 936 | 1,034 | −9.5% | 4.77 | 12.4 | 196.2/sq mi (75.8/km2) | April 30, 1914 |
| Byhalia | Town | Marshall | 1,302 | 706 | +84.4% | 7.17 | 18.6 | 181.6/sq mi (70.1/km2) | January 25, 1858 |
| Byram[a] | City | Hinds | 11,489 | 18.36 | 47.6 | 625.8/sq mi (241.6/km2) | June 16, 2009[4] | ||
| Caledonia | Town | Lowndes | 1,041 | 1,015 | +2.6% | 2.82 | 7.3 | 369.1/sq mi (142.5/km2) | April 21, 1873 |
| Calhoun City | Town | Calhoun | 1,774 | 1,872 | −5.2% | 2.36 | 6.1 | 751.7/sq mi (290.2/km2) | December 23, 1904 |
| Canton |
City | Madison | 13,189 | 12,911 | +2.2% | 21.24 | 55.0 | 621.0/sq mi (239.8/km2) | July 23, 1906 |
| Carrollton |
Town | Carroll | 190 | 408 | −53.4% | 0.78 | 2.0 | 243.6/sq mi (94.1/km2) | February 27, 1836 |
| Carthage |
City | Leake | 5,075 | 4,637 | +9.4% | 9.29 | 24.1 | 546.3/sq mi (210.9/km2) | February 27, 1836 |
| Cary | Town | Sharkey | 313 | 427 | −26.7% | 0.71 | 1.8 | 440.8/sq mi (170.2/km2) | May 12, 1837 |
| Centreville | Town | Amite, Wilkinson | 1,684 | 1,680 | +0.2% | 2.32 | 6.0 | 725.9/sq mi (280.3/km2) | February 5, 1880 |
| Charleston |
City | Tallahatchie | 2,193 | 2,198 | −0.2% | 1.35 | 3.5 | 1,624.4/sq mi (627.2/km2) | February 28, 1848 |
| Chunky | Town | Newton | 326 | 344 | −5.2% | 0.83 | 2.1 | 392.8/sq mi (151.6/km2) | December 24, 1900 |
| Clarksdale |
City | Coahoma | 17,962 | 20,645 | −13.0% | 13.89 | 36.0 | 1,293.2/sq mi (499.3/km2) | February 25, 1882 |
| Cleveland |
City | Bolivar | 12,334 | 13,841 | −10.9% | 7.30 | 18.9 | 1,689.6/sq mi (652.4/km2) | March 25, 1886 |
| Clinton | City | Hinds | 25,216 | 23,347 | +8.0% | 41.82 | 108.3 | 603.0/sq mi (232.8/km2) | February 12, 1830 |
| Coahoma | Town | Coahoma | 377 | 325 | +16.0% | 0.20 | 0.52 | 1,885.0/sq mi (727.8/km2) | February 18, 1890 |
| Coffeeville |
Town | Yalobusha | 905 | 930 | −2.7% | 2.14 | 5.5 | 422.9/sq mi (163.3/km2) | February 7, 1836 |
| Coldwater | Town | Tate | 1,677 | 1,674 | +0.2% | 2.37 | 6.1 | 707.6/sq mi (273.2/km2) | November 15, 1858 |
| Collins |
City | Covington | 2,586 | 2,683 | −3.6% | 7.96 | 20.6 | 324.9/sq mi (125.4/km2) | November 27, 1906 |
| Columbia |
City | Marion | 6,582 | 6,603 | −0.3% | 6.75 | 17.5 | 975.1/sq mi (376.5/km2) | December 16, 1812 |
| Columbus |
City | Lowndes | 23,640 | 25,944 | −8.9% | 22.06 | 57.1 | 1,071.6/sq mi (413.8/km2) | February 1822 |
| Como | Town | Panola | 1,279 | 1,310 | −2.4% | 1.89 | 4.9 | 676.7/sq mi (261.3/km2) | February 20, 1880 |
| Corinth |
City | Alcorn | 14,573 | 14,054 | +3.7% | 30.16 | 78.1 | 483.2/sq mi (186.6/km2) | March 12, 1856 |
| Courtland | Town | Panola | 511 | 460 | +11.1% | 1.13 | 2.9 | 452.2/sq mi (174.6/km2) | March 30, 1871 |
| Crawford | Town | Lowndes | 641 | 655 | −2.1% | 1.40 | 3.6 | 457.9/sq mi (176.8/km2) | January 26, 1854 |
| Crenshaw | Town | Panola, Quitman | 885 | 916 | −3.4% | 0.41 | 1.1 | 2,158.5/sq mi (833.4/km2) | August 22, 1903 |
| Crosby | Town | Amite, Wilkinson | 318 | 360 | −11.7% | 2.12 | 5.5 | 150.0/sq mi (57.9/km2) | April 4, 1934 |
| Crowder | Town | Panola, Quitman | 712 | 766 | −7.0% | 0.46 | 1.2 | 1,547.8/sq mi (597.6/km2) | March 2, 1917 |
| Cruger | Town | Holmes | 386 | 449 | −14.0% | 0.96 | 2.5 | 402.1/sq mi (155.2/km2) | March 19, 1890 |
| Crystal Springs | City | Copiah | 5,044 | 5,873 | −14.1% | 5.43 | 14.1 | 928.9/sq mi (358.7/km2) | June 4, 1859 |
| Decatur |
Town | Newton | 1,841 | 1,426 | +29.1% | 5.50 | 14.2 | 334.7/sq mi (129.2/km2) | February 22, 1840 |
| De Kalb |
Town | Kemper | 1,164 | 972 | +19.8% | 3.32 | 8.6 | 350.6/sq mi (135.4/km2) | February 16, 1839 |
| Derma | Town | Calhoun | 1,025 | 1,023 | +0.2% | 1.77 | 4.6 | 579.1/sq mi (223.6/km2) | November 21, 1905 |
| D'Iberville | City | Harrison | 9,486 | 7,608 | +24.7% | 7.06 | 18.3 | 1,343.6/sq mi (518.8/km2) | February 11, 1988 |
| D'Lo | Town | Simpson | 452 | 394 | +14.7% | 0.69 | 1.8 | 655.1/sq mi (252.9/km2) | August 16, 1901 |
| Diamondhead[b] | City | Hancock | 8,425 | 5,912 | +42.5% | 11.09 | 28.7 | 759.7/sq mi (293.3/km2) | February 6, 2012 |
| Doddsville | Town | Sunflower | 98 | 108 | −9.3% | 0.77 | 2.0 | 127.3/sq mi (49.1/km2) | September 17, 1920 |
| Drew | City | Sunflower | 1,927 | 2,434 | −20.8% | 1.12 | 2.9 | 1,720.5/sq mi (664.3/km2) | September 23, 1899 |
| Duck Hill | Town | Montgomery | 732 | 746 | −1.9% | 1.03 | 2.7 | 710.7/sq mi (274.4/km2) | July 21, 1870 |
| Dumas | Town | Tippah | 470 | 452 | +4.0% | 3.90 | 10.1 | 120.5/sq mi (46.5/km2) | December 21, 1874 |
| Duncan | Town | Bolivar | 423 | 578 | −26.8% | 0.92 | 2.4 | 459.8/sq mi (177.5/km2) | February 24, 1890 |
| Durant | City | Holmes | 2,673 | 2,932 | −8.8% | 2.24 | 5.8 | 1,193.3/sq mi (460.7/km2) | November 21, 1865 |
| Ecru | Town | Pontotoc | 895 | 947 | −5.5% | 4.72 | 12.2 | 189.6/sq mi (73.2/km2) | November 19, 1904 |
| Eden | Village | Yazoo | 103 | 126 | −18.3% | 0.47 | 1.2 | 219.1/sq mi (84.6/km2) | February 24, 1890 |
| Edwards | Town | Hinds | 1,034 | 1,347 | −23.2% | 1.66 | 4.3 | 622.9/sq mi (240.5/km2) | June 21, 1871 |
| Ellisville |
City | Jones | 4,448 | 3,465 | +28.4% | 10.52 | 27.2 | 422.8/sq mi (163.2/km2) | March 11, 1884 |
| Enterprise | Town | Clarke | 526 | 474 | +11.0% | 2.44 | 6.3 | 215.6/sq mi (83.2/km2) | February 18, 1846 |
| Ethel | Town | Attala | 418 | 452 | −7.5% | 0.58 | 1.5 | 720.7/sq mi (278.3/km2) | June 7, 1911 |
| Eupora | City | Webster | 2,197 | 2,326 | −5.5% | 3.32 | 8.6 | 661.7/sq mi (255.5/km2) | May 14, 1890 |
| Falcon | Town | Quitman | 167 | 317 | −47.3% | 0.39 | 1.0 | 428.2/sq mi (165.3/km2) | April 5, 1971 |
| Falkner | Town | Tippah | 514 | 212 | +142.5% | 5.07 | 13.1 | 101.4/sq mi (39.1/km2) | April 2, 1874 |
| Farmington | Town | Alcorn | 2,186 | 1,810 | +20.8% | 6.38 | 16.5 | 342.6/sq mi (132.3/km2) | September 9, 1997 |
| Fayette |
City | Jefferson | 1,614 | 2,242 | −28.0% | 1.18 | 3.1 | 1,367.8/sq mi (528.1/km2) | February 12, 1830 |
| Flora | Town | Madison | 1,886 | 1,546 | +22.0% | 3.02 | 7.8 | 624.5/sq mi (241.1/km2) | January 29, 1886 |
| Florence | Town | Rankin | 4,141 | 2,396 | +72.8% | 8.07 | 20.9 | 513.1/sq mi (198.1/km2) | May 30, 1905 |
| Flowood | City | Rankin | 7,823 | 4,750 | +64.7% | 28.41 | 73.6 | 275.4/sq mi (106.3/km2) | November 20, 1950 |
| Forest |
City | Scott | 5,684 | 5,987 | −5.1% | 13.08 | 33.9 | 434.6/sq mi (167.8/km2) | November 21, 1865 |
| French Camp | Town | Choctaw | 174 | 393 | −55.7% | 0.98 | 2.5 | 177.6/sq mi (68.6/km2) | February 27, 1854 |
| Friars Point | Town | Coahoma | 1,200 | 1,480 | −18.9% | 1.10 | 2.8 | 1,090.9/sq mi (421.2/km2) | October 31, 1865 |
| Fulton |
City | Itawamba | 3,961 | 3,882 | +2.0% | 8.49 | 22.0 | 466.5/sq mi (180.1/km2) | May 11, 1837 |
| Gattman | Village | Monroe | 90 | 114 | −21.1% | 0.56 | 1.5 | 160.7/sq mi (62.1/km2) | February 4, 1829 |
| Gautier | City | Jackson | 18,572 | 11,681 | +59.0% | 30.23 | 78.3 | 614.4/sq mi (237.2/km2) | May 14, 1986 |
| Georgetown | Town | Copiah | 286 | 344 | −16.9% | 0.67 | 1.7 | 426.9/sq mi (164.8/km2) | September 27, 1909 |
| Glen | Town | Alcorn | 412 | 286 | +44.1% | 4.66 | 12.1 | 88.4/sq mi (34.1/km2) | April 23, 1993 |
| Glendora | Village | Tallahatchie | 151 | 285 | −47.0% | 0.14 | 0.36 | 1,078.6/sq mi (416.4/km2) | March 19, 1900 |
| Gloster | Town | Amite | 960 | 1,073 | −10.5% | 1.82 | 4.7 | 527.5/sq mi (203.7/km2) | March 11, 1884 |
| Golden | Town | Tishomingo | 191 | 201 | −5.0% | 0.58 | 1.5 | 329.3/sq mi (127.1/km2) | February 8, 1908 |
| Goodman | Town | Holmes | 1,386 | 1,252 | +10.7% | 0.82 | 2.1 | 1,690.2/sq mi (652.6/km2) | November 21, 1865 |
| Greenville |
City | Washington | 34,400 | 41,633 | −17.4% | 26.89 | 69.6 | 1,279.3/sq mi (493.9/km2) | June 24, 1870 |
| Greenwood |
City | Leflore | 15,205 | 18,425 | −17.5% | 12.34 | 32.0 | 1,232.2/sq mi (475.7/km2) | February 16, 1844 |
| Grenada |
City | Grenada | 13,092 | 14,879 | −12.0% | 30.01 | 77.7 | 436.3/sq mi (168.4/km2) | February 27, 1836 |
| Gulfport |
City | Harrison | 67,793 | 71,127 | −4.7% | 55.59 | 144.0 | 1,219.5/sq mi (470.9/km2) | July 28, 1898 |
| Gunnison | Town | Bolivar | 452 | 633 | −28.6% | 0.98 | 2.5 | 461.2/sq mi (178.1/km2) | May 7, 1892 |
| Guntown | City | Lee | 2,083 | 1,183 | +76.1% | 4.66 | 12.1 | 447.0/sq mi (172.6/km2) | February 16, 1867 |
| Hatley | Town | Monroe | 482 | 476 | +1.3% | 1.37 | 3.5 | 351.8/sq mi (135.8/km2) | February 14, 1914 |
| Hattiesburg |
City | Forrest, Lamar | 45,989 | 44,779 | +2.7% | 53.39 | 138.3 | 861.4/sq mi (332.6/km2) | March 11, 1884 |
| Hazlehurst |
City | Copiah | 4,009 | 4,400 | −8.9% | 4.38 | 11.3 | 915.3/sq mi (353.4/km2) | September 21, 1859 |
| Heidelberg | Town | Jasper | 718 | 840 | −14.5% | 5.11 | 13.2 | 140.5/sq mi (54.3/km2) | March 12, 1884 |
| Hernando |
City | DeSoto | 14,090 | 6,812 | +106.8% | 25.73 | 66.6 | 547.6/sq mi (211.4/km2) | May 13, 1837 |
| Hickory | Town | Newton | 530 | 499 | +6.2% | 0.94 | 2.4 | 563.8/sq mi (217.7/km2) | December 5, 1865 |
| Hickory Flat | Town | Benton | 601 | 565 | +6.4% | 0.96 | 2.5 | 626.0/sq mi (241.7/km2) | April 6, 1874 |
| Hollandale | City | Washington | 2,702 | 3,437 | −21.4% | 2.22 | 5.7 | 1,217.1/sq mi (469.9/km2) | February 24, 1890 |
| Holly Springs |
City | Marshall | 7,699 | 7,957 | −3.2% | 12.78 | 33.1 | 602.4/sq mi (232.6/km2) | May 12, 1837 |
| Horn Lake | City | DeSoto | 26,066 | 14,099 | +84.9% | 16.02 | 41.5 | 1,627.1/sq mi (628.2/km2) | April 13, 1871 |
| Houston |
City | Chickasaw | 3,623 | 4,079 | −11.2% | 7.38 | 19.1 | 490.9/sq mi (189.5/km2) | May 9, 1837 |
| Indianola |
City | Sunflower | 10,683 | 12,066 | −11.5% | 8.57 | 22.2 | 1,246.6/sq mi (481.3/km2) | January 7, 1886 |
| Inverness | Town | Sunflower | 1,019 | 1,153 | −11.6% | 1.44 | 3.7 | 707.6/sq mi (273.2/km2) | March 5, 1904 |
| Isola | Town | Humphreys | 713 | 768 | −7.2% | 0.74 | 1.9 | 963.5/sq mi (372.0/km2) | June 1, 1910 |
| Itta Bena | City | Leflore | 2,049 | 2,208 | −7.2% | 1.42 | 3.7 | 1,443.0/sq mi (557.1/km2) | August 1, 1898 |
| Iuka |
City | Tishomingo | 3,028 | 3,059 | −1.0% | 9.69 | 25.1 | 312.5/sq mi (120.7/km2) | December 11, 1857 |
| Jackson |
City | Hinds, Madison, Rankin | 173,514 | 184,256 | −5.8% | 111.05 | 287.6 | 1,562.5/sq mi (603.3/km2) | February 22, 1840 |
| Jonestown | Town | Coahoma | 1,298 | 1,701 | −23.7% | 0.39 | 1.0 | 3,328.2/sq mi (1,285.0/km2) | March 6, 1880 |
| Jumpertown | Town | Prentiss | 480 | 404 | +18.8% | 1.79 | 4.6 | 268.2/sq mi (103.5/km2) | November 26, 1975 |
| Kilmichael | Town | Montgomery | 699 | 830 | −15.8% | 2.79 | 7.2 | 250.5/sq mi (96.7/km2) | December 24, 1906 |
| Kosciusko |
City | Attala | 7,402 | 7,372 | +0.4% | 7.54 | 19.5 | 981.7/sq mi (379.0/km2) | February 27, 1836 |
| Kossuth | Village | Alcorn | 209 | 170 | +22.9% | 0.96 | 2.5 | 217.7/sq mi (84.1/km2) | July 19, 1870 |
| Lake | Town | Newton, Scott | 324 | 408 | −20.6% | 1.11 | 2.9 | 291.9/sq mi (112.7/km2) | February 9, 1867 |
| Lambert | Town | Quitman | 1,638 | 1,967 | −16.7% | 0.85 | 2.2 | 1,927.1/sq mi (744.0/km2) | May 12, 1905 |
| Laurel |
City | Jones | 18,540 | 18,393 | +0.8% | 16.24 | 42.1 | 1,141.6/sq mi (440.8/km2) | March 11, 1886 |
| Leakesville |
Town | Greene | 898 | 1,026 | −12.5% | 1.58 | 4.1 | 568.4/sq mi (219.4/km2) | January 7, 1904 |
| Learned | Town | Hinds | 94 | 50 | +88.0% | 0.34 | 0.88 | 276.5/sq mi (106.7/km2) | March 14, 1884 |
| Leland | City | Washington | 4,481 | 5,502 | −18.6% | 3.59 | 9.3 | 1,248.2/sq mi (481.9/km2) | February 20, 1886 |
| Lena | Town | Leake | 148 | 167 | −11.4% | 1.66 | 4.3 | 89.2/sq mi (34.4/km2) | April 18, 1912 |
| Lexington |
City | Holmes | 1,731 | 2,025 | −14.5% | 2.42 | 6.3 | 715.3/sq mi (276.2/km2) | February 25, 1836 |
| Liberty |
Town | Amite | 728 | 633 | +15.0% | 2.06 | 5.3 | 353.4/sq mi (136.4/km2) | February 24, 1809 |
| Long Beach | City | Harrison | 14,792 | 17,320 | −14.6% | 10.00 | 25.9 | 1,479.2/sq mi (571.1/km2) | August 10, 1905 |
| Louin | Town | Jasper | 277 | 339 | −18.3% | 6.06 | 15.7 | 45.7/sq mi (17.6/km2) | July 29, 1904 |
| Louise | Town | Humphreys | 199 | 315 | −36.8% | 0.18 | 0.47 | 1,105.6/sq mi (426.9/km2) | December 8, 1909 |
| Louisville |
City | Winston | 6,631 | 7,006 | −5.4% | 15.07 | 39.0 | 440.0/sq mi (169.9/km2) | February 14, 1836 |
| Lucedale |
City | George | 2,923 | 2,458 | +18.9% | 6.39 | 16.6 | 457.4/sq mi (176.6/km2) | June 6, 1901 |
| Lula | Town | Coahoma | 298 | 370 | −19.5% | 0.42 | 1.1 | 709.5/sq mi (273.9/km2) | February 24, 1890 |
| Lumberton | City | Lamar, Pearl River | 2,086 | 2,228 | −6.4% | 7.24 | 18.8 | 288.1/sq mi (111.2/km2) | January 28, 1895 |
| Lyon | Town | Coahoma | 350 | 418 | −16.3% | 0.47 | 1.2 | 744.7/sq mi (287.5/km2) | April 10, 1899 |
| Maben | Town | Oktibbeha, Webster | 871 | 803 | +8.5% | 1.94 | 5.0 | 449.0/sq mi (173.3/km2) | February 13, 1890 |
| McComb | City | Pike | 12,790 | 13,337 | −4.1% | 11.57 | 30.0 | 1,105.4/sq mi (426.8/km2) | April 5, 1872 |
| McCool | Town | Attala | 135 | 182 | −25.8% | 0.94 | 2.4 | 143.6/sq mi (55.5/km2) | January 24, 1884 |
| McLain | Town | Greene | 441 | 603 | −26.9% | 3.39 | 8.8 | 130.1/sq mi (50.2/km2) | May 27, 1903 |
| Macon |
City | Noxubee | 2,768 | 2,461 | +12.5% | 3.83 | 9.9 | 722.7/sq mi (279.0/km2) | February 14, 1836 |
| Madison | City | Madison | 24,149 | 14,692 | +64.4% | 25.22 | 65.3 | 957.5/sq mi (369.7/km2) | November 30, 1944 |
| Magee | City | Simpson | 4,408 | 4,200 | +5.0% | 5.13 | 13.3 | 859.3/sq mi (331.8/km2) | July 23, 1900 |
| Magnolia |
City | Pike | 2,420 | 2,071 | +16.9% | 6.14 | 15.9 | 394.1/sq mi (152.2/km2) | April 26, 1859 |
| Mantachie | Town | Itawamba | 1,144 | 1,107 | +3.3% | 3.94 | 10.2 | 290.4/sq mi (112.1/km2) | June 4, 1903 |
| Mantee | Village | Webster | 232 | 169 | +37.3% | 4.49 | 11.6 | 51.7/sq mi (20.0/km2) | February 9, 1900 |
| Marietta | Town | Prentiss | 256 | 248 | +3.2% | 1.78 | 4.6 | 143.8/sq mi (55.5/km2) | March 12, 1856 |
| Marion | Town | Lauderdale | 1,479 | 1,305 | +13.3% | 2.91 | 7.5 | 508.2/sq mi (196.2/km2) | February 8, 1838 |
| Marks |
City | Quitman | 1,735 | 1,551 | +11.9% | 1.28 | 3.3 | 1,355.5/sq mi (523.3/km2) | January 1, 1907 |
| Mathiston | Town | Choctaw, Webster | 698 | 720 | −3.1% | 2.46 | 6.4 | 283.7/sq mi (109.6/km2) | February 24, 1890 |
| Mayersville |
Town | Issaquena | 547 | 795 | −31.2% | 1.10 | 2.8 | 497.3/sq mi (192.0/km2) | April 5, 1872 |
| Meadville |
Town | Franklin | 449 | 519 | −13.5% | 1.10 | 2.8 | 408.2/sq mi (157.6/km2) | August 21, 1906 |
| Mendenhall |
City | Simpson | 2,504 | 2,555 | −2.0% | 5.35 | 13.9 | 468.0/sq mi (180.7/km2) | January 30, 1905 |
| Meridian |
City | Lauderdale | 41,148 | 39,968 | +3.0% | 53.74 | 139.2 | 765.7/sq mi (295.6/km2) | February 10, 1860 |
| Merigold | Town | Bolivar | 439 | 664 | −33.9% | 0.97 | 2.5 | 452.6/sq mi (174.7/km2) | March 11, 1901 |
| Metcalfe | Town | Washington | 1,067 | 1,109 | −3.8% | 1.00 | 2.6 | 1,067.0/sq mi (412.0/km2) | November 4, 1977 |
| Mize | Town | Smith | 340 | 285 | +19.3% | 2.31 | 6.0 | 147.2/sq mi (56.8/km2) | April 18, 1902 |
| Monticello |
Town | Lawrence | 1,571 | 1,726 | −9.0% | 4.17 | 10.8 | 376.7/sq mi (145.5/km2) | November 10, 1904 |
| Montrose | Town | Jasper | 140 | 127 | +10.2% | 2.71 | 7.0 | 51.7/sq mi (19.9/km2) | August 23, 1904 |
| Moorhead | City | Sunflower | 2,405 | 2,573 | −6.5% | 1.30 | 3.4 | 1,850.0/sq mi (714.3/km2) | December 14, 1899 |
| Morgan City | Town | Leflore | 255 | 305 | −16.4% | 0.59 | 1.5 | 432.2/sq mi (166.9/km2) | February 12, 1968 |
| Morton | City | Scott | 3,462 | 3,482 | −0.6% | 7.19 | 18.6 | 481.5/sq mi (185.9/km2) | April 10, 1861 |
| Moss Point | City | Jackson | 13,704 | 15,851 | −13.5% | 24.16 | 62.6 | 567.2/sq mi (219.0/km2) | April 29, 1901 |
| Mound Bayou | City | Bolivar | 1,533 | 2,102 | −27.1% | 0.88 | 2.3 | 1,742.0/sq mi (672.6/km2) | February 23, 1898 |
| Mount Olive | Town | Covington | 982 | 893 | +10.0% | 3.10 | 8.0 | 316.8/sq mi (122.3/km2) | May 18, 1900 |
| Myrtle | Town | Union | 490 | 407 | +20.4% | 2.08 | 5.4 | 235.6/sq mi (91.0/km2) | February 1, 1890 |
| Natchez |
City | Adams | 15,792 | 18,464 | −14.5% | 13.20 | 34.2 | 1,196.4/sq mi (461.9/km2) | March 10, 1803 |
| Nettleton | City | Lee, Monroe | 1,992 | 1,932 | +3.1% | 4.03 | 10.4 | 494.3/sq mi (190.8/km2) | March 9, 1888 |
| New Albany |
City | Union | 8,034 | 7,607 | +5.6% | 18.23 | 47.2 | 440.7/sq mi (170.2/km2) | March 4, 1850 |
| New Augusta |
Town | Perry | 644 | 715 | −9.9% | 5.14 | 13.3 | 125.3/sq mi (48.4/km2) | June 3, 1953 |
| New Hebron | Town | Lawrence | 447 | 447 | 0.0% | 0.67 | 1.7 | 667.2/sq mi (257.6/km2) | March 12, 1906 |
| New Houlka | Town | Chickasaw | 626 | 710 | −11.8% | 1.23 | 3.2 | 508.9/sq mi (196.5/km2) | November 20, 1905 |
| Newton | City | Newton | 3,373 | 3,699 | −8.8% | 7.15 | 18.5 | 471.7/sq mi (182.1/km2) | October 30, 1866 |
| North Carrollton | Town | Carroll | 473 | 499 | −5.2% | 0.32 | 0.83 | 1,478.1/sq mi (570.7/km2) | March 29, 1899 |
| Noxapater | Town | Winston | 472 | 419 | +12.6% | 1.01 | 2.6 | 467.3/sq mi (180.4/km2) | April 25, 1906 |
| Oakland | Town | Yalobusha | 527 | 586 | −10.1% | 1.37 | 3.5 | 384.7/sq mi (148.5/km2) | February 28, 1848 |
| Ocean Springs | City | Jackson | 17,442 | 17,225 | +1.3% | 11.52 | 29.8 | 1,514.1/sq mi (584.6/km2) | February 27, 1854 |
| Okolona |
City | Chickasaw | 2,692 | 3,056 | −11.9% | 6.65 | 17.2 | 404.8/sq mi (156.3/km2) | March 4, 1850 |
| Olive Branch | City | DeSoto | 33,484 | 21,054 | +59.0% | 36.70 | 95.1 | 912.4/sq mi (352.3/km2) | April 11, 1873 |
| Osyka | Town | Pike | 440 | 481 | −8.5% | 1.06 | 2.7 | 415.1/sq mi (160.3/km2) | November 3, 1858 |
| Oxford |
City | Lafayette | 18,916 | 11,756 | +60.9% | 15.83 | 41.0 | 1,194.9/sq mi (461.4/km2) | May 11, 1837 |
| Pace | Town | Bolivar | 274 | 364 | −24.7% | 0.15 | 0.39 | 1,826.7/sq mi (705.3/km2) | May 25, 1923 |
| Pachuta | Town | Clarke | 261 | 245 | +6.5% | 2.44 | 6.3 | 107.0/sq mi (41.3/km2) | February 5, 1890 |
| Paden | Village | Tishomingo | 116 | 106 | +9.4% | 0.90 | 2.3 | 128.9/sq mi (49.8/km2) | September 18, 1919 |
| Pascagoula |
City | Jackson | 22,392 | 26,200 | −14.5% | 15.38 | 39.8 | 1,455.9/sq mi (562.1/km2) | February 9, 1838 |
| Pass Christian | City | Harrison | 4,613 | 6,579 | −29.9% | 8.29 | 21.5 | 556.5/sq mi (214.8/km2) | February 21, 1848 |
| Pearl | City | Rankin | 25,092 | 21,961 | +14.3% | 23.60 | 61.1 | 1,063.2/sq mi (410.5/km2) | June 5, 1973 |
| Pelahatchie | Town | Rankin | 1,334 | 1,461 | −8.7% | 5.93 | 15.4 | 225.0/sq mi (86.9/km2) | March 3, 1882 |
| Petal | City | Forrest | 10,454 | 7,579 | +37.9% | 16.87 | 43.7 | 619.7/sq mi (239.3/km2) | February 21, 1973 |
| Philadelphia |
City | Neshoba | 7,477 | 7,303 | +2.4% | 12.21 | 31.6 | 612.4/sq mi (236.4/km2) | February 15, 1838 |
| Picayune | City | Pearl River | 10,878 | 10,535 | +3.3% | 12.96 | 33.6 | 839.4/sq mi (324.1/km2) | September 30, 1904 |
| Pickens | Town | Holmes | 1,157 | 1,325 | −12.7% | 1.28 | 3.3 | 903.9/sq mi (349.0/km2) | April 10, 1893 |
| Pittsboro |
Village | Calhoun | 202 | 212 | −4.7% | 0.98 | 2.5 | 206.1/sq mi (79.6/km2) | October 16, 1852 |
| Plantersville | Town | Lee | 1,155 | 1,144 | +1.0% | 2.09 | 5.4 | 552.6/sq mi (213.4/km2) | February 24, 1890 |
| Polkville | Town | Smith | 833 | 132 | +531.1% | 17.18 | 44.5 | 48.5/sq mi (18.7/km2) | June 6, 1969 |
| Pontotoc |
City | Pontotoc | 5,625 | 5,253 | +7.1% | 11.18 | 29.0 | 503.1/sq mi (194.3/km2) | May 3, 1837 |
| Pope | Village | Panola | 215 | 241 | −10.8% | 1.06 | 2.7 | 202.8/sq mi (78.3/km2) | April 4, 1872 |
| Poplarville |
City | Pearl River | 2,894 | 2,601 | +11.3% | 5.42 | 14.0 | 533.9/sq mi (206.2/km2) | March 15, 1884 |
| Port Gibson |
City | Claiborne | 1,567 | 1,840 | −14.8% | 1.76 | 4.6 | 890.3/sq mi (343.8/km2) | March 12, 1803 |
| Potts Camp | Town | Marshall | 523 | 494 | +5.9% | 0.97 | 2.5 | 539.2/sq mi (208.2/km2) | February 28, 1888 |
| Prentiss |
Town | Jefferson Davis | 1,081 | 1,158 | −6.6% | 1.90 | 4.9 | 568.9/sq mi (219.7/km2) | March 3, 1903 |
| Puckett | Village | Rankin | 316 | 354 | −10.7% | 2.17 | 5.6 | 145.6/sq mi (56.2/km2) | October 20, 1955 |
| Purvis |
City | Lamar | 2,175 | 2,164 | +0.5% | 3.88 | 10.0 | 560.6/sq mi (216.4/km2) | February 25, 1888 |
| Quitman |
City | Clarke | 2,323 | 2,463 | −5.7% | 5.18 | 13.4 | 448.5/sq mi (173.1/km2) | February 14, 1839 |
| Raleigh |
Town | Smith | 1,462 | 1,255 | +16.5% | 5.10 | 13.2 | 286.7/sq mi (110.7/km2) | July 1, 1935 |
| Raymond |
City | Hinds | 1,933 | 1,664 | +16.2% | 3.00 | 7.8 | 644.3/sq mi (248.8/km2) | December 15, 1830 |
| Renova | Town | Bolivar | 668 | 623 | +7.2% | 0.87 | 2.3 | 767.8/sq mi (296.5/km2) | July 27, 1920 |
| Richland | City | Rankin | 6,912 | 6,027 | +14.7% | 12.52 | 32.4 | 552.1/sq mi (213.2/km2) | October 31, 1974[5] |
| Richton | Town | Perry | 1,068 | 1,038 | +2.9% | 2.29 | 5.9 | 466.4/sq mi (180.1/km2) | October 14, 1905 |
| Ridgeland | City | Madison | 24,047 | 20,173 | +19.2% | 19.61 | 50.8 | 1,226.3/sq mi (473.5/km2) | December 29, 1899 |
| Rienzi | Town | Alcorn | 317 | 330 | −3.9% | 0.99 | 2.6 | 320.2/sq mi (123.6/km2) | December 14, 1859 |
| Ripley |
City | Tippah | 5,395 | 5,478 | −1.5% | 11.32 | 29.3 | 476.6/sq mi (184.0/km2) | May 9, 1837 |
| Rolling Fork |
City | Sharkey | 2,143 | 2,486 | −13.8% | 1.41 | 3.7 | 1,519.9/sq mi (586.8/km2) | March 5, 1880 |
| Rosedale |
City | Bolivar | 1,873 | 2,414 | −22.4% | 5.41 | 14.0 | 346.2/sq mi (133.7/km2) | February 2, 1882 |
| Roxie | Town | Franklin | 497 | 569 | −12.7% | 1.13 | 2.9 | 439.8/sq mi (169.8/km2) | September 6, 1911 |
| Ruleville | City | Sunflower | 3,007 | 3,234 | −7.0% | 2.52 | 6.5 | 1,193.3/sq mi (460.7/km2) | September 23, 1899 |
| Sallis | Town | Attala | 134 | 114 | +17.5% | 0.41 | 1.1 | 326.8/sq mi (126.2/km2) | March 4, 1875 |
| Saltillo | City | Lee | 4,752 | 3,393 | +40.1% | 8.19 | 21.2 | 580.2/sq mi (224.0/km2) | July 20, 1870 |
| Sandersville | Town | Jones | 731 | 789 | −7.4% | 4.95 | 12.8 | 147.7/sq mi (57.0/km2) | March 12, 1884 |
| Sardis |
Town | Panola | 1,703 | 2,038 | −16.4% | 2.00 | 5.2 | 851.5/sq mi (328.8/km2) | October 22, 1866 |
| Satartia | Village | Yazoo | 55 | 68 | −19.1% | 0.14 | 0.36 | 392.9/sq mi (151.7/km2) | February 20, 1875 |
| Schlater | Town | Leflore | 310 | 388 | −20.1% | 1.15 | 3.0 | 269.6/sq mi (104.1/km2) | September 23, 1968 |
| Scooba | Town | Kemper | 732 | 632 | +15.8% | 2.48 | 6.4 | 295.2/sq mi (114.0/km2) | April 9, 1873 |
| Sebastopol | Town | Scott, Leake | 272 | 233 | +16.7% | 1.50 | 3.9 | 181.3/sq mi (70.0/km2) | October 6, 1926 |
| Seminary | Town | Covington | 314 | 335 | −6.3% | 1.51 | 3.9 | 207.9/sq mi (80.3/km2) | November 10, 1899 |
| Senatobia |
City | Tate | 8,165 | 6,682 | +22.2% | 15.56 | 40.3 | 524.7/sq mi (202.6/km2) | February 10, 1860 |
| Shannon | Town | Lee | 1,753 | 1,657 | +5.8% | 4.05 | 10.5 | 432.8/sq mi (167.1/km2) | July 20, 1870 |
| Shaw | City | Bolivar, Sunflower | 1,952 | 2,312 | −15.6% | 1.11 | 2.9 | 1,758.6/sq mi (679.0/km2) | March 15, 1886 |
| Shelby | City | Bolivar | 2,229 | 2,926 | −23.8% | 2.73 | 7.1 | 816.5/sq mi (315.2/km2) | February 19, 1890 |
| Sherman | Town | Lee, Pontotoc, Union | 650 | 548 | +18.6% | 1.74 | 4.5 | 373.6/sq mi (144.2/km2) | March 3, 1888 |
| Shubuta | Town | Clarke | 441 | 651 | −32.3% | 2.41 | 6.2 | 183.0/sq mi (70.7/km2) | November 8, 1865 |
| Shuqualak | Town | Noxubee | 501 | 562 | −10.9% | 1.13 | 2.9 | 443.4/sq mi (171.2/km2) | July 16, 1859 |
| Sidon | Town | Leflore | 509 | 672 | −24.3% | 0.12 | 0.31 | 4,241.7/sq mi (1,637.7/km2) | April 5, 1872 |
| Silver City | Town | Humphreys | 337 | 337 | 0.0% | 0.60 | 1.6 | 561.7/sq mi (216.9/km2) | September 21, 1904 |
| Silver Creek | Town | Lawrence | 210 | 209 | +0.5% | 1.49 | 3.9 | 140.9/sq mi (54.4/km2) | May 4, 1904 |
| Slate Springs | Village | Calhoun | 110 | 121 | −9.1% | 1.42 | 3.7 | 77.5/sq mi (29.9/km2) | February 11, 1882 |
| Sledge | Town | Quitman | 545 | 529 | +3.0% | 0.52 | 1.3 | 1,048.1/sq mi (404.7/km2) | February 28, 1913 |
| Smithville | Town | Monroe | 942 | 882 | +6.8% | 1.48 | 3.8 | 636.5/sq mi (245.7/km2) | January 26, 1852 |
| Snow Lake Shores | Town | Benton | 319 | 300 | +6.3% | 0.68 | 1.8 | 469.1/sq mi (181.1/km2) | July 15, 1996 |
| Soso | Town | Jones | 408 | 379 | +7.7% | 2.12 | 5.5 | 192.5/sq mi (74.3/km2) | June 28, 1901 |
| Southaven | City | DeSoto | 48,982 | 28,977 | +69.0% | 41.25 | 106.8 | 1,187.4/sq mi (458.5/km2) | March 25, 1980 |
| Starkville |
City | Oktibbeha | 23,888 | 21,869 | +9.2% | 25.51 | 66.1 | 936.4/sq mi (361.6/km2) | May 11, 1837 |
| State Line | Town | Greene, Wayne | 565 | 555 | +1.8% | 4.26 | 11.0 | 132.6/sq mi (51.2/km2) | February 12, 1875 |
| Stonewall | Town | Clarke | 1,088 | 1,149 | −5.3% | 2.66 | 6.9 | 409.0/sq mi (157.9/km2) | December 1, 1965 |
| Sturgis | Town | Oktibbeha | 254 | 206 | +23.3% | 1.29 | 3.3 | 196.9/sq mi (76.0/km2) | March 13, 1886 |
| Summit | Town | Pike | 1,705 | 1,428 | +19.4% | 2.26 | 5.9 | 754.4/sq mi (291.3/km2) | January 21, 1858 |
| Sumner |
Town | Tallahatchie | 316 | 407 | −22.4% | 0.55 | 1.4 | 574.5/sq mi (221.8/km2) | February 26, 1900 |
| Sumrall | Town | Lamar | 1,421 | 1,005 | +41.4% | 3.74 | 9.7 | 379.9/sq mi (146.7/km2) | October 6, 1903 |
| Sunflower | Town | Sunflower | 1,159 | 696 | +66.5% | 0.61 | 1.6 | 1,900.0/sq mi (733.6/km2) | February 18, 1914 |
| Sylvarena | Village | Smith | 112 | 120 | −6.7% | 2.62 | 6.8 | 42.7/sq mi (16.5/km2) | February 10, 1969 |
| Taylor | Village | Lafayette | 322 | 289 | +11.4% | 2.93 | 7.6 | 109.9/sq mi (42.4/km2) | January 23, 1907 |
| Taylorsville | Town | Smith | 1,353 | 1,341 | +0.9% | 3.86 | 10.0 | 350.5/sq mi (135.3/km2) | July 9, 1900 |
| Tchula | Town | Holmes | 2,096 | 2,332 | −10.1% | 1.41 | 3.7 | 1,486.5/sq mi (574.0/km2) | February 27, 1836 |
| Terry | Town | Hinds | 1,063 | 664 | +60.1% | 3.81 | 9.9 | 279.0/sq mi (107.7/km2) | February 19, 1867 |
| Thaxton | Town | Pontotoc | 643 | 513 | +25.3% | 10.33 | 26.8 | 62.2/sq mi (24.0/km2) | June 15, 1973 |
| Tillatoba | Town | Yalobusha | 91 | 121 | −24.8% | 1.01 | 2.6 | 90.1/sq mi (34.8/km2) | September 4, 1873[6][7] |
| Tishomingo | Town | Tishomingo | 339 | 316 | +7.3% | 0.55 | 1.4 | 616.4/sq mi (238.0/km2) | June 24, 1908 |
| Toccopola | Town | Pontotoc | 246 | 189 | +30.2% | 8.45 | 21.9 | 29.1/sq mi (11.2/km2) | March 31, 1873 |
| Tremont | Town | Itawamba | 465 | 390 | +19.2% | 4.91 | 12.7 | 94.7/sq mi (36.6/km2) | January 18, 1974 |
| Tunica |
Town | Tunica | 1,030 | 1,132 | −9.0% | 0.66 | 1.7 | 1,560.6/sq mi (602.6/km2) | March 3, 1888 |
| Tupelo |
City | Lee | 34,546 | 34,211 | +1.0% | 51.14 | 132.5 | 675.5/sq mi (260.8/km2) | July 20, 1870 |
| Tutwiler | Town | Tallahatchie | 3,550 | 1,364 | +160.3% | 1.33 | 3.4 | 2,669.2/sq mi (1,030.6/km2) | March 14, 1899 |
| Tylertown |
Town | Walthall | 1,609 | 1,910 | −15.8% | 3.28 | 8.5 | 490.5/sq mi (189.4/km2) | December 19, 1907 |
| Union | Town | Neshoba, Newton | 1,988 | 2,021 | −1.6% | 3.43 | 8.9 | 579.6/sq mi (223.8/km2) | June 19, 1905 |
| Utica | Town | Hinds | 820 | 966 | −15.1% | 2.99 | 7.7 | 274.2/sq mi (105.9/km2) | March 5, 1880 |
| Vaiden |
Town | Carroll | 734 | 840 | −12.6% | 2.15 | 5.6 | 341.4/sq mi (131.8/km2) | February 10, 1860 |
| Vardaman | Town | Calhoun | 1,316 | 1,065 | +23.6% | 1.36 | 3.5 | 967.6/sq mi (373.6/km2) | December 30, 1904 |
| Verona | City | Lee | 3,006 | 3,334 | −9.8% | 3.72 | 9.6 | 808.1/sq mi (312.0/km2) | July 18, 1860 |
| Vicksburg |
City | Warren | 23,856 | 26,407 | −9.7% | 32.98 | 85.4 | 723.3/sq mi (279.3/km2) | February 15, 1839 |
| Walls[c] | Town | DeSoto | 1,162 | 9.81 | 25.4 | 118.5/sq mi (45.7/km2) | April 12, 1972 | ||
| Walnut | Town | Tippah | 771 | 754 | +2.3% | 5.43 | 14.1 | 142.0/sq mi (54.8/km2) | May 1, 1912 |
| Walnut Grove | Town | Leake | 1,911 | 488 | +291.6% | 1.62 | 4.2 | 1,179.6/sq mi (455.5/km2) | March 11, 1884 |
| Walthall |
Village | Webster | 144 | 170 | −15.3% | 0.97 | 2.5 | 148.5/sq mi (57.3/km2) | February 1, 1877 |
| Water Valley |
City | Yalobusha | 3,392 | 3,677 | −7.8% | 7.01 | 18.2 | 483.9/sq mi (186.8/km2) | April 28, 1858 |
| Waveland | City | Hancock | 6,435 | 6,674 | −3.6% | 8.49 | 22.0 | 758.0/sq mi (292.6/km2) | March 6, 1888 |
| Waynesboro |
City | Wayne | 5,043 | 5,197 | −3.0% | 12.69 | 32.9 | 397.4/sq mi (153.4/km2) | April 11, 1876 |
| Webb | Town | Tallahatchie | 565 | 587 | −3.7% | 0.42 | 1.1 | 1,345.2/sq mi (519.4/km2) | September 5, 1896 |
| Weir | Town | Choctaw | 459 | 553 | −17.0% | 1.05 | 2.7 | 437.1/sq mi (168.8/km2) | February 16, 1884 |
| Wesson | Town | Copiah, Lincoln | 1,925 | 1,693 | +13.7% | 4.45 | 11.5 | 432.6/sq mi (167.0/km2) | March 31, 1864 |
| West | Town | Holmes | 185 | 220 | −15.9% | 0.56 | 1.5 | 330.4/sq mi (127.6/km2) | November 3, 1865 |
| West Point |
City | Clay | 11,307 | 12,145 | −6.9% | 20.88 | 54.1 | 541.5/sq mi (209.1/km2) | November 20, 1858 |
| Wiggins |
City | Stone | 4,390 | 3,849 | +14.1% | 10.75 | 27.8 | 408.4/sq mi (157.7/km2) | March 26, 1904 |
| Winona |
City | Montgomery | 5,043 | 5,482 | −8.0% | 13.52 | 35.0 | 373.0/sq mi (144.0/km2) | May 2, 1861 |
| Winstonville | Town | Bolivar | 191 | 319 | −40.1% | 0.30 | 0.78 | 636.7/sq mi (245.8/km2) | February 16, 1917 |
| Woodland | Village | Chickasaw | 125 | 159 | −21.4% | 0.57 | 1.5 | 219.3/sq mi (84.7/km2) | January 30, 1908 |
| Woodville |
Town | Wilkinson | 1,096 | 1,192 | −8.1% | 1.04 | 2.7 | 1,053.8/sq mi (406.9/km2) | December 9, 1811 |
| Yazoo City |
City | Yazoo | 11,403 | 14,550 | −21.6% | 9.84 | 25.5 | 1,158.8/sq mi (447.4/km2) | March 15, 1884 |
| Total | — | — | 1,498,262 | 1,446,318 | — | 2,037.78 | 5,277.8 | 735.2/sq mi (283.9/km2) | — |
See also[]
Notes[]
- ^ The city incorporated on June 16, 2009.[4]
- ^ Census data is from Diamondhead Census Designated Place since the city incorporated in 2012.[3]
- ^ The adjacent village of Memphis incorporated 1972 but did not annex the larger community of Walls until 2003 thereby giving the town of Walls the official status of a municipality.[8]
References[]
- ^ Jump up to: a b c d e f g h i "GCT–PH1 – Population, Housing Units, Area, and Density: 2010 – State — Place and (in selected states) County Subdivision". 2010 United States Census. United States Census Bureau. Archived from the original on February 13, 2020. Retrieved August 8, 2016.
- ^ "Mississippi: 2010 Population and Housing Unit Counts 2010 Census of Population and Housing" (PDF). 2010 United States Census. United States Census Bureau. September 2012. p. III–2. Retrieved August 8, 2016.
- ^ Jump up to: a b c d e f g "Municipal Government" (PDF). State of Mississippi. Secretary of State. October 2014. p. 381. Archived from the original (PDF) on January 26, 2017. Retrieved August 10, 2016.
- ^ Jump up to: a b "2000–2010 Entity Changes" (txt). 2010 United States Census. United States Census Bureau. Retrieved June 17, 2016.
- ^ "City of Jackson and City of Pearl v. Petitioners for Incorporation of the City of Richland". Supreme Court of Mississippi. 1975. Retrieved April 15, 2017 – via Leagle.
- ^ Yalobusha County Economic Development Foundation. "A Brief History of the County". Yalobusha County. Yalobusha County Economic Development Foundation. Archived from the original on 2016-10-17. Retrieved December 17, 2016.
- ^ H.R. 289
- ^ Town of Walls (2016). "About our Town". Town of Walls. Town of Walls. Retrieved August 17, 2016.
- Cities in Mississippi
- Lists of cities in the United States by state
- Mississippi geography-related lists