Mitchell County, Iowa
Mitchell County | |
|---|---|
U.S. county | |
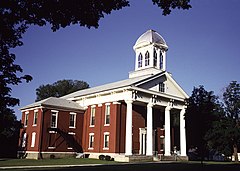 The courthouse in Osage is on the NRHP | |
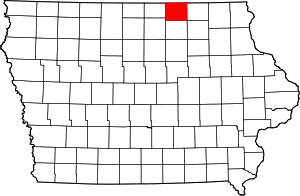 Location within the U.S. state of Iowa | |
 Iowa's location within the U.S. | |
| Coordinates: 43°21′20″N 92°47′23″W / 43.355555555556°N 92.789722222222°W | |
| Country | |
| State | |
| Founded | 1851 |
| Named for | John Mitchel |
| Seat | Osage |
| Largest city | Osage |
| Area | |
| • Total | 470 sq mi (1,200 km2) |
| • Land | 469 sq mi (1,210 km2) |
| • Water | 0.4 sq mi (1 km2) 0.09% |
| Population (2020) | |
| • Total | 10,565 |
| • Density | 22/sq mi (8.7/km2) |
| Time zone | UTC−6 (Central) |
| • Summer (DST) | UTC−5 (CDT) |
| Congressional district | 1st |
| Website | www |

Mitchell County is a county located in the U.S. state of Iowa. As of the 2020 census, the population was 10,565.[1] The county seat is Osage.[2] The county is named in honor of John Mitchel.
History[]
Mitchell County was founded in 1851. It was named after John Mitchel, an Irish patriot.[3] The county's courthouse was completed in 1858,[4] and it is listed on the National Register of Historic Places. The courthouse has since been razed.
Geography[]
According to the U.S. Census Bureau, the county has a total area of 470 square miles (1,200 km2), of which 469 square miles (1,210 km2) is land and 0.4 square miles (1.0 km2) (0.09%) is water.[5]
Major highways[]
 U.S. Highway 218
 Iowa Highway 9
Adjacent counties[]
- Mower County, Minnesota (north)
- Howard County (east)
- Floyd County (south)
- Cerro Gordo County (southwest)
- Worth County (west)
Demographics[]
| Historical population | |||
|---|---|---|---|
| Census | Pop. | %± | |
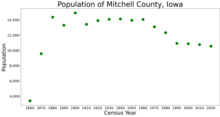
| 1860 | 3,409 | — | |
| 1870 | 9,582 | 181.1% | |
| 1880 | 14,363 | 49.9% | |
| 1890 | 13,299 | −7.4% | |
| 1900 | 14,916 | 12.2% | |
| 1910 | 13,435 | −9.9% | |
| 1920 | 13,921 | 3.6% | |
| 1930 | 14,065 | 1.0% | |
| 1940 | 14,121 | 0.4% | |
| 1950 | 13,945 | −1.2% | |
| 1960 | 14,043 | 0.7% | |
| 1970 | 13,108 | −6.7% | |
| 1980 | 12,329 | −5.9% | |
| 1990 | 10,928 | −11.4% | |
| 2000 | 10,874 | −0.5% | |
| 2010 | 10,776 | −0.9% | |
| 2020 | 10,565 | −2.0% | |
| U.S. Decennial Census[6] 1790-1960[7] 1900-1990[8] 1990-2000[9] 2010-2018[10] | |||
2020 census[]
The 2020 census recorded a population of 10,565 in the county, with a population density of 22.8027/sq mi (8.8042/km2). 97.47% of the population reported being of one race. 93.84% were non-Hispanic White, 0.40% were Black, 1.83% were Hispanic, 0.11% were Native American, 0.44% were Asian, 0.04% were Native Hawaiian or Pacific Islander and 3.35% were some other race or more than one race. There were 4,847 housing units, of which 4,382 were occupied.[1]
2010 census[]
The 2010 census recorded a population of 10,776 in the county, with a population density of 22.9805/sq mi (8.8728/km2). There were 4,850 housing units, of which 4,395 were occupied.[11]
2000 census[]

According to the U.S. Census Bureau, Mitchell County's 99% White population makes it the county with the smallest percentage of minorities nationally.[12]
As of the census[13] of 2000, there were 10,874 people, 4,294 households, and 2,984 families residing in the county. The population density was 23 people per square mile (9/km2). There were 4,594 housing units at an average density of 10 per square mile (4/km2). The racial makeup of the county was 99.27% White, 0.17% Black or African American, 0.07% Native American, 0.17% Asian, 0.02% Pacific Islander, 0.07% from other races, and 0.21% from two or more races; 0.58% of the population were Hispanic or Latino of any race.
There were 4,294 households, out of which 30.10% had children under the age of 18 living with them, 60.80% were married couples living together, 5.70% had a female householder with no husband present, and 30.50% were non-families. 27.60% of all households were made up of individuals, and 15.40% had someone living alone who was 65 years of age or older. The average household size was 2.47 and the average family size was 3.02.
In the county, the population was spread out, with 26.50% under the age of 18, 6.10% from 18 to 24, 24.20% from 25 to 44, 21.70% from 45 to 64, and 21.60% who were 65 years of age or older. The median age was 41 years. For every 100 females there were 95.70 males; for every 100 females aged 18 and over, there were 92.00 males.
The median income for a household in the county was $34,843, and the median income for a family was $41,233. Males had a median income of $29,601 versus $22,054 for females. The per capita income for the county was $16,809. About 7.00% of families and 10.70% of the population were below the poverty line, including 16.50% of those under age 18 and 8.10% of those age 65 or over.
Politics[]
Starting with Michael Dukakis's win in 1988, Mitchell County became a Democratic leaning county, voting for Democrats in all presidential elections through 2012. Mitchell County was the whitest county in the United States that voted for President Barack Obama, both in 2008 and 2012.[14] In 2016, Trump became the first Republican to win it since Ronald Reagan in 1984, winning it by a 24% margin, the largest margin for a presidential candidate since 1968. He won it again in 2020, by an even larger 28% margin, the largest margin since 1952. Also, In 2020 Trump became the first Republican to win the county while losing nationally since 1960.
| Year | Republican | Democratic | Third Parties |
|---|---|---|---|
| 2020 | 63.2% 3,677 | 35.3% 2,053 | 1.6% 92 |
| 2016 | 58.9% 3,190 | 34.9% 1,888 | 6.3% 339 |
| 2012 | 47.3% 2,643 | 50.7% 2,831 | 2.0% 112 |
| 2008 | 42.8% 2,469 | 55.1% 3,179 | 2.1% 118 |
| 2004 | 48.3% 2,646 | 50.8% 2,785 | 0.9% 49 |
| 2000 | 46.3% 2,388 | 51.3% 2,650 | 2.4% 124 |
| 1996 | 37.0% 1,877 | 51.2% 2,596 | 11.8% 598 |
| 1992 | 36.2% 1,933 | 40.7% 2,177 | 23.1% 1,237 |
| 1988 | 44.5% 2,338 | 54.7% 2,870 | 0.8% 43 |
| 1984 | 54.7% 3,144 | 44.1% 2,531 | 1.2% 68 |
| 1980 | 58.0% 3,401 | 34.8% 2,040 | 7.2% 423 |
| 1976 | 49.0% 2,887 | 49.3% 2,906 | 1.7% 99 |
| 1972 | 57.4% 3,395 | 41.4% 2,449 | 1.1% 67 |
| 1968 | 60.6% 3,533 | 36.1% 2,103 | 3.3% 194 |
| 1964 | 39.1% 2,489 | 60.7% 3,868 | 0.3% 16 |
| 1960 | 57.6% 3,915 | 42.3% 2,873 | 0.2% 10 |
| 1956 | 61.3% 4,175 | 38.6% 2,630 | 0.1% 7 |
| 1952 | 69.8% 5,050 | 30.1% 2,175 | 0.2% 12 |
| 1948 | 49.4% 3,021 | 47.0% 2,873 | 3.7% 225 |
| 1944 | 55.5% 3,406 | 44.0% 2,696 | 0.5% 30 |
| 1940 | 56.5% 3,947 | 43.3% 3,025 | 0.2% 15 |
| 1936 | 41.9% 2,765 | 54.7% 3,610 | 3.5% 228 |
| 1932 | 38.6% 2,527 | 60.2% 3,940 | 1.3% 82 |
| 1928 | 59.9% 3,534 | 39.1% 2,308 | 1.0% 58 |
| 1924 | 46.9% 2,892 | 6.5% 400 | 46.6% 2,871 |
| 1920 | 84.0% 4,476 | 14.5% 773 | 1.6% 83 |
| 1916 | 64.4% 1,963 | 33.9% 1,033 | 1.7% 53 |
| 1912 | 20.3% 590 | 37.3% 1,082 | 42.4% 1,230 |
| 1908 | 65.1% 1,932 | 33.3% 988 | 1.6% 48 |
| 1904 | 74.9% 2,158 | 22.0% 634 | 3.1% 88 |
| 1900 | 70.4% 2,450 | 28.2% 981 | 1.4% 49 |
| 1896 | 69.8% 2,498 | 28.8% 1,031 | 1.4% 50 |
Economy[]
In January 2017, Mitchell County supervisors denied an application for an Iowa Select contracted farm in Lincoln Township. It was planned for 5,000-hogs.[16]
Communities[]
Cities[]
Census-designated places[]
Townships[]
Population ranking[]
The population ranking of the following table is based on the 2020 census of Mitchell County.[1]
† county seat
| Rank | City/Town/etc. | Municipal type | Population (2020 Census) |
|---|---|---|---|
| 1 | † Osage | City | 3,627 |
| 2 | St. Ansgar | City | 1,160 |
| 3 | Riceville (partially in Howard County) | City | 806 |
| 4 | Stacyville | City | 458 |
| 5 | Mitchell | City | 124 |
| 6 | McIntire | City | 113 |
| 7 | Carpenter | City | 87 |
| 8 | New Haven | CDP | 77 |
| 9 | Orchard | City | 68 |
| 10 | Little Cedar | CDP | 64 |
| 11 | Toeterville | CDP | 53 |
| 12 | Mona | CDP | 35 |
| 13 | Otranto | CDP | 27 |
| 14 | Meyer | CDP | 14 |
See also[]
References[]
- ^ Jump up to: a b c "2020 Census State Redistricting Data". census.gov. United states Census Bureau. Retrieved 12 August 2021.
- ^ "Find a County". National Association of Counties. Retrieved June 7, 2011.
- ^ Mitchell County Archived July 3, 2007, at archive.today
- ^ "Mitchell County Courthouse". Iowa Judicial Branch. Archived from the original on July 26, 2011. Retrieved February 20, 2011.
- ^ "US Gazetteer files: 2010, 2000, and 1990". United States Census Bureau. February 12, 2011. Retrieved April 23, 2011.
- ^ "U.S. Decennial Census". United States Census Bureau. Retrieved July 20, 2014.
- ^ "Historical Census Browser". University of Virginia Library. Retrieved July 20, 2014.
- ^ "Population of Counties by Decennial Census: 1900 to 1990". United States Census Bureau. Retrieved July 20, 2014.
- ^ "Census 2000 PHC-T-4. Ranking Tables for Counties: 1990 and 2000" (PDF). United States Census Bureau. Retrieved July 20, 2014.
- ^ "State & County QuickFacts". United States Census Bureau. Archived from the original on June 7, 2011. Retrieved July 20, 2014.
- ^ "Population & Housing Occupancy Status 2010". United States Census Bureau American FactFinder. Retrieved May 23, 2011.[dead link]
- ^ Census Bureau data, cited in "Minorities now in the majority in nearly 10% of U.S. counties", Associated Press August 8, 2007, Lexington Herald-Leader p A8
- ^ "U.S. Census website". United States Census Bureau. Retrieved 2008-01-31.
- ^ Buchanan, Larry; McDonald, Brent; Parlapiano, Alicia (January 26, 2016). "Rural Voters Can Swing the Iowa Caucuses. Meet Five of Them". The New York Times. New York City. Retrieved 2019-08-10.
- ^ Leip, David. "Dave Leip's Atlas of U.S. Presidential Elections". uselectionatlas.org. Retrieved April 27, 2018.
- ^ "Mitchell". Iowa Citizens for Community Improvement. January 31, 2017. Retrieved February 7, 2017.
External links[]
| Wikimedia Commons has media related to Mitchell County, Iowa. |
| show Places adjacent to Mitchell County, Iowa |
|---|
| show Municipalities and communities of Mitchell County, Iowa, United States |
|---|

Coordinates: 43°21′20″N 92°47′23″W / 43.35556°N 92.78972°W
| show Authority control |
|---|
- Iowa counties
- Mitchell County, Iowa
- 1851 establishments in Iowa
- Populated places established in 1851