Oxford East (UK Parliament constituency)
| Oxford East | |
|---|---|
| Borough constituency for the House of Commons | |
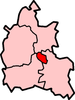
 Boundary of Oxford East in Oxfordshire | |
 Location of Oxfordshire within England | |
| County | Oxfordshire |
| Electorate | 81,644 (December 2010)[1] |
| Current constituency | |
| Created | 1983 |
| Member of Parliament | Anneliese Dodds (Labour Co-op) |
| Number of members | One |
| Created from | Oxford (majority) (abolished), Mid Oxfordshire and Henley[2] |
Oxford East is a constituency[n 1] represented in the House of Commons of the UK Parliament by Anneliese Dodds of the Labour Party, who also serves as party chair.[n 2]

The constituency covers the eastern and southern parts of Oxford in Oxfordshire. It borders Oxford West and Abingdon to the west and Henley to the north, east and south.
The seat, created in 1983, includes Oxford city centre and the majority of the Oxford colleges, Cowley (containing a large car factory) and adjoining parts of the city including a broad area of mid-to-low rise council-built housing, Blackbird Leys, which has kept varying amounts of social housing (see Right to Buy).
A large percentage of the seat's electorate consists of students from Oxford and Oxford Brookes universities (the latter being in the seat). Part of the seat with a high proportion of private housing is archetypal bourgeois/leafy Headington which is mainly a mixture of student tenants and relatively high-income families, while the seat also includes the similarly prosperous areas of Grandpont and New Hinksey in the south of the city. At the end of 2010 unemployment claimant count was 2.3%, 45th of the 84 South East constituencies and close to the mean of 2.45%.[3]
History[]
From 1885 until 1983 the vast bulk of the area of the seat, as it has variously been drawn since 1983, was in the abolished Oxford constituency, historically Liberal then for some decades Conservative, and which then alternated with the Labour Party, who took that seat in the late 1960s and late 1970s.
For the first four years (from 1983) Oxford East was served by Conservative Steven Norris. He was defeated by Labour candidate Andrew Smith who held the seat for the next 30 years before retiring. The Conservative share of the vote fell to a low to date, of 16.7%, in 2005, a year when the seat became an emphatic Labour–Liberal Democrat contest, and the votes for Andrew Smith were 963 more than the "Lib Dem" candidate: a majority of 2.3% of the votes (electorate voting).
Smith held the seat in 2015; it was the 80th-safest of Labour's 232 seats won that year by percentage of majority.[4] On his retirement the local Labour party selected Anneliese Dodds. At[which?] election she took 23,284 votes (43.2%), broadly in line with many of Smith's results.
In 2015 and 2017 the runner-up became a Conservative as before the last two general elections.[clarification needed] The Green Party's candidate has stood in all eight contests since the party was branded as such, once retaining its deposit, in 2015, with almost 12% of the vote.
Ousted ex-MP Norris won the largest runner-up's share of the vote to date (40.4%) during the 1987 general election, which was in general a drubbing for the Liberal party who had a candidates' pact with Social Democratic Party (SDP) candidates and a fallout among the SDP's Gang of Four. Turnout has ranged between 78.9% in 1987 and 55.8% in 2001.
Boundaries and boundary changes[]


- 1983–1997
- The City of Oxford wards of Blackbird Leys, East, Headington, Iffley, Marston, Quarry, St Clement's, Temple Cowley, and Wood Farm, and the District of South Oxfordshire wards of Littlemore, Marston, and Risinghurst.[5]
- The constituency formed largely from the majority of the abolished Borough Constituency of Oxford. Also included three wards in the District of South Oxfordshire, previously part of Henley (Littlemore) and the abolished constituency of Mid-Oxon (Marston and Risinghurst).
- 1997–2010
- The City of Oxford wards of Blackbird Leys, East, Headington, Iffley, Littlemore, Marston, Old Marston and Risinghurst, Quarry, St Clement's, South, Temple Cowley, and Wood Farm.[6]
- The 1997 boundary changes reflected changes to local government boundaries with the majority of the area comprising the three South Oxfordshire wards having been absorbed into the City of Oxford. The remaining, semi-rural Conservative-leaning areas were transferred back to Henley. The urban Oxford South ward that was strong for the Liberal Democrats and Labour was transferred from Oxford West and Abingdon.
- Since 2010
- The City of Oxford wards of Barton and Sandhills, Blackbird Leys, Carfax, Churchill, Cowley, Cowley Marsh, Headington, Headington Hill and Northway, Hinksey Park, Holywell, Iffley Fields, Littlemore, Lye Valley, Marston, Northfield Brook, Quarry and Risinghurst, Rose Hill and Iffley, St Clement's, and St Mary's.[7]
- Parliament accepted the Boundary Commission's Fifth Periodic Review of Westminster constituencies which slightly altered this constituency, in order to equalise electorates, for the General Election 2010 following changes to the City's ward structure. These changes added Carfax and Holywell wards from Oxford West and Abingdon. This meant that Oxford city centre and the majority of Oxford colleges fell into Oxford East which had mainly been in Oxford West and Abingdon. It was predicted that these changes would benefit the Liberal Democrats, whose share of the vote had fallen slightly in 2005. When the seat was contested on the new boundaries, Labour incumbent, Smith, quadrupled his majority on a broad range of pro-Labour two-party swings which was replicated in few seats[clarification needed] in that election.
Members of Parliament[]
| Election | Member[8] | Party | |
|---|---|---|---|
| 1983 | Steve Norris | Conservative | |
| 1987 | Andrew Smith | Labour | |
| 2017 | Anneliese Dodds | Labour Co-op | |
Elections[]
Elections in the 2010s[]
| Party | Candidate | Votes | % | ±% | |
|---|---|---|---|---|---|
| Labour Co-op | Anneliese Dodds | 28,135 | 57.0 | ||
| Conservative | Louise Staite | 10,303 | 20.9 | ||
| Liberal Democrats | Alistair Fernie | 6,884 | 13.9 | ||
| Green | David Williams | 2,392 | 4.8 | ||
| Brexit Party | Roger Carter | 1,146 | 2.3 | New | |
| Independent | David Henwood | 238 | 0.5 | New | |
| Independent | Chaka Artwell | 143 | 0.3 | ||
| Independent | Phil Taylor | 118 | 0.2 | New | |
| Majority | 17,832 | 36.1 | |||
| Turnout | 49,340 | 63.3 | |||
| Labour Co-op hold | Swing | ||||
| Party | Candidate | Votes | % | ±% | |
|---|---|---|---|---|---|
| Labour Co-op | Anneliese Dodds[12] | 35,118 | 65.2 | ||
| Conservative | Suzanne Bartington[13] | 11,834 | 22.0 | ||
| Liberal Democrats | Kirsten Johnson[14] | 4,904 | 9.1 | ||
| Green | Larry Sanders[15] | 1,785 | 3.3 | ||
| Independent | Chaka Artwell | 255 | 0.5 | ||
| Majority | 23,284 | 43.2 | |||
| Turnout | 53,896 | 68.8 | |||
| Labour Co-op hold | Swing | ||||
| Party | Candidate | Votes | % | ±% | |
|---|---|---|---|---|---|
| Labour | Andrew Smith | 25,356 | 50.0 | +7.5 | |
| Conservative | Melanie Magee | 10,076 | 19.9 | +1.1 | |
| Green | Ann Duncan[17] | 5,890 | 11.6 | +9.2 | |
| Liberal Democrats | Alasdair Murray[18] | 5,453 | 10.8 | −22.8 | |
| UKIP | Ian Macdonald[19] | 3,451 | 6.8 | +4.5 | |
| Independent | Chaka Artwell[20] | 160 | 0.3 | +0.3 | |
| Monster Raving Loony | Mad Hatter[20] | 145 | 0.3 | +0.3 | |
| TUSC | James Morbin[21] | 108 | 0.2 | New | |
| Socialist (GB) | Kevin Parkin[22] | 50 | 0.1 | New | |
| Majority | 15,280 | 30.1 | +21.2 | ||
| Turnout | 50,689 | 64.2[23] | +1.1 | ||
| Labour hold | Swing | ||||

| Party | Candidate | Votes | % | ±% | |
|---|---|---|---|---|---|
| Labour | Andrew Smith | 21,938 | 42.5 | +6.5 | |
| Liberal Democrats | Steve Goddard | 17,357 | 33.6 | −1.6 | |
| Conservative | Edward Argar | 9,727 | 18.8 | +1.5 | |
| Green | Sushila Dhall[25] | 1,238 | 2.4 | −2.1 | |
| UKIP | Julia Gasper | 1,202 | 2.3 | +0.6 | |
| Socialist Equality | David O'Sullivan | 116 | 0.2 | New | |
| Equal Parenting Alliance | Roger Crawford | 73 | 0.1 | New | |
| Majority | 4,581 | 8.9 | +6.6 | ||
| Turnout | 51,651 | 63.1 | +5.6 | ||
| Labour hold | Swing | +2.45 | |||
Elections in the 2000s[]
| Party | Candidate | Votes | % | ±% | |
|---|---|---|---|---|---|
| Labour | Andrew Smith | 15,405 | 36.9 | −12.5 | |
| Liberal Democrats | Steve Goddard | 14,442 | 34.6 | +11.2 | |
| Conservative | Virginia Morris | 6,992 | 16.7 | −2.0 | |
| Green | Jacob Saunders | 1,813 | 4.3 | +0.5 | |
| Independent ('New Loony') | Honest Blair | 1,485 | 3.6 | New | |
| Ind. Working Class | Maurice Leen | 892 | 2.1 | New | |
| UKIP | Peter Gardner | 715 | 1.7 | +0.3 | |
| Independent | Pathmanathan Mylvaganam | 46 | 0.1 | −0.1 | |
| Majority | 963 | 2.3 | -23.7 | ||
| Turnout | 41,790 | 57.9 | +2.1 | ||
| Labour hold | Swing | −11.8 | |||
| Party | Candidate | Votes | % | ±% | |
|---|---|---|---|---|---|
| Labour | Andrew Smith | 19,681 | 49.4 | −7.4 | |
| Liberal Democrats | Steve Goddard | 9,337 | 23.4 | +8.7 | |
| Conservative | Cheryl Potter | 7,446 | 18.7 | −3.3 | |
| Green | Pritam Singh | 1,501 | 3.8 | +1.8 | |
| Socialist Alliance | John Lister | 708 | 1.8 | New | |
| UKIP | Peter Gardner | 570 | 1.4 | +0.9 | |
| Socialist Labour | Fahim Ahmed | 274 | 0.7 | New | |
| ProLife Alliance | Linda Hodge | 254 | 0.6 | −0.1 | |
| Independent | Pathmanathan Mylvaganam | 77 | 0.2 | 0.0 | |
| Majority | 10,344 | 26.0 | -8.8 | ||
| Turnout | 39,848 | 55.8 | −12.6 | ||
| Labour hold | Swing | ||||
Elections in the 1990s[]
| Party | Candidate | Votes | % | ±% | |
|---|---|---|---|---|---|
| Labour | Andrew Smith | 27,205 | 56.8 | +6.6 | |
| Conservative | Jonathan Djanogly | 10,540 | 22.0 | −11.5 | |
| Liberal Democrats | George Kershaw | 7,038 | 14.7 | +0.7 | |
| Referendum | John Young | 1,391 | 2.9 | New | |
| Green | Craig Simmons | 975 | 2.0 | 0.0 | |
| ProLife Alliance | David Harper-Jones | 318 | 0.7 | New | |
| UKIP | Peter Gardner | 234 | 0.5 | New | |
| Natural Law | John Thompson | 108 | 0.2 | New | |
| Independent Anti-majority Democracy | Pathmanathan Mylvaganam | 68 | 0.2 | New | |
| Majority | 16,665 | 34.8 | +18.1 | ||
| Turnout | 47,877 | 68.4 | -5.8 | ||
| Labour hold | Swing | +9.1 | |||
| Party | Candidate | Votes | % | ±% | |
|---|---|---|---|---|---|
| Labour | Andrew Smith | 23,702 | 50.4 | +7.4 | |
| Conservative | Mark Mayall | 16,164 | 34.3 | −6.1 | |
| Liberal Democrats | Martin Horwood | 6,105 | 13.0 | −2.6 | |
| Green | Caroline Lucas | 933 | 2.0 | +1.1 | |
| Natural Law | Ann Wilson | 101 | 0.2 | New | |
| Revolutionary Communist | Keith Thompson | 48 | 0.1 | New | |
| Majority | 7,538 | 16.1 | +13.5 | ||
| Turnout | 47,053 | 74.6 | −4.3 | ||
| Labour hold | Swing | +6.8 | |||
Elections in the 1980s[]
| Party | Candidate | Votes | % | ±% | |
|---|---|---|---|---|---|
| Labour | Andrew Smith | 21,103 | 43.0 | +5.7 | |
| Conservative | Steven Norris | 19,815 | 40.4 | +0.4 | |
| Liberal | Margaret Godden | 7,648 | 15.6 | −7.1 | |
| Green | Dave Dalton | 441 | 0.9 | New | |
| Independent | Pathmanathan Mylvaganam | 60 | 0.1 | New | |
| Majority | 1,288 | 2.6 | N/A | ||
| Turnout | 49,067 | 78.9 | +5.0 | ||
| Labour gain from Conservative | Swing | +2.7 | |||
| Party | Candidate | Votes | % | ±% | |
|---|---|---|---|---|---|
| Conservative | Steven Norris | 18,808 | 40.0 | ||
| Labour | Andrew Smith | 17,541 | 37.3 | ||
| Liberal | Margaret Godden | 10,690 | 22.7 | ||
| Majority | 1,267 | 2.7 | |||
| Turnout | 47,039 | 73.9 | |||
| Conservative win (new seat) | |||||
Neighbouring constituencies[]
| show Constituencies bordering Oxford East |
|---|
See also[]
- List of Parliamentary constituencies in Oxfordshire
- Boundary Commission for England
Notes and references[]
- Notes
- References
- ^ "Electorate Figures". 2011 Electorate Figures. Boundary Commission for England. 4 March 2011. Archived from the original on 6 November 2010. Retrieved 13 March 2011.
- ^ "'Oxford East', June 1983 up to May 1997". ElectionWeb Project. Cognitive Computing Limited. Retrieved 13 March 2016.
- ^ Unemployment claimants by constituency The Guardian
- ^ List of Labour MPs elected in 2015 by % majority UK Political.info. Retrieved 29 January 2017
- ^ "The Parliamentary Constituencies (England) Order 1983". www.legislation.gov.uk. Retrieved 13 February 2019.
- ^ "The Parliamentary Constituencies (England) Order 1995". www.legislation.gov.uk. Retrieved 13 February 2019.
- ^ "The Parliamentary Constituencies (England) Order 2007". www.legislation.gov.uk. Retrieved 13 February 2019.
- ^ Leigh Rayment's Historical List of MPs – Constituencies beginning with "O"
- ^ "Oxford East Parliamentary constituency". BBC News. BBC. Retrieved 27 November 2019.
- ^ "GENERAL ELECTION: List of Oxfordshire parliamentary candidates published". The Oxford Times.
- ^ "South Live: Thursday 11 May". BBC News.
- ^ "Parliamentary candidate announced to replace Labour's Andrew Smith". Oxford Mail. Retrieved 27 April 2017.
- ^ "Conservatives reveal Dr Suzanne Bartington as candidate for Oxford East". Oxford Mail. Retrieved 7 May 2017.
- ^ "Dr Kirsten Johnson". Liberal Democrats.
- ^ "Larry Sanders pledges to tackle inequality if he becomes Oxford East MP". Oxford Mail.
- ^ "Election Data 2015". Electoral Calculus. Archived from the original on 17 October 2015. Retrieved 17 October 2015.
- ^ "Ann Duncan". Oxfordshire Green Party.
- ^ McKenzie, Conor (2 March 2015). "Alasdair Murray to Take the Fight to Labour". Oxford East Lib Dems. Archived from the original on 7 March 2015. Retrieved 3 March 2015.
- ^ "UK Polling Report".
- ^ Jump up to: a b Collie, Jason. "Oxford East candidates – who you can vote for". Oxford Mail. Newsquest. Retrieved 10 April 2015.
- ^ "TUSC parliamentary candidates in May 2015" (PDF). TUSC. 4 February 2015.
- ^ "General Election – Campaign News". Socialist Party of Great Britain. 15 January 2015. Archived from the original on 20 January 2015. Retrieved 16 January 2015.
- ^ total electorate 78978: email from Oxford City
- ^ "Election Data 2010". Electoral Calculus. Archived from the original on 26 July 2013. Retrieved 17 October 2015.
- ^ Oxfordshire Green Party news release, 4 February 2010. Peter Tatchell was the prospective parliamentary candidate for the Green Party until withdrawing in December 2009 for health reasons.
- ^ "Election Data 2005". Electoral Calculus. Archived from the original on 15 October 2011. Retrieved 18 October 2015.
- ^ "Election Data 2001". Electoral Calculus. Archived from the original on 15 October 2011. Retrieved 18 October 2015.
- ^ "Election Data 1997". Electoral Calculus. Archived from the original on 15 October 2011. Retrieved 18 October 2015.
- ^ "Politics Resources". Election 1997. Politics Resources. 1 May 1997. Retrieved 7 January 2011.
- ^ Rallings, C; Thrasher, M (1995). The Media Guide to the New Parliamentary Constituencies. Plymouth: LGC Elections Centre. p. 131.
- ^ The 1997 election result is calculated relative to the notional, not the actual, 1992 result.
- ^ "Election Data 1992". Electoral Calculus. Archived from the original on 15 October 2011. Retrieved 18 October 2015.
- ^ "Politics Resources". Election 1992. Politics Resources. 9 April 1992. Archived from the original on 24 July 2011. Retrieved 6 December 2010.
- ^ This was an unusual election, in which an incumbent was challenged by two people who later became MPs.
- ^ "Election Data 1987". Electoral Calculus. Archived from the original on 15 October 2011. Retrieved 18 October 2015.
- ^ "Election Data 1983". Electoral Calculus. Archived from the original on 15 October 2011. Retrieved 18 October 2015.
Sources[]
- Election result 2015
- Election result, 2015 (BBC)
- Election result, 2010 (BBC)
- Election result, 2005 (BBC)
- Election results, 1997–2001 (BBC)
- Election results, 1997–2001 (Election Demon)
- Election results, 1983–1992 (Election Demon)
| show Authority control |
|---|

- Areas of Oxford
- Constituencies of the Parliament of the United Kingdom established in 1983
- Parliamentary constituencies in Oxfordshire
- Politics of Oxford